SlideShare a Scribd company logo
Running head: POSITIVE LEARNING ENVIRONMENTS 1
Understanding Positive Enviornments for Student Learning and Professional Collaboration
Chad D. Cornwell
Walden University
Abstract
Abstracts are not required for all course papers. Please ask your instructor if you have questions
regarding whether an abstract is required for a particular assignment.
Running head: POSITIVE LEARNING ENVIRONMENTS 3
Data Driven Instruction in Title 1 Schools
Sound, comprehensive data is the greatest asset Title 1 schools use to drive impactful
instructional practices. Outside of academic data from classrooms and strategic testing, data collected
about discipline and attendance, school and classroom climate, educational resources, and more help
guide administrators and educators in the daily instructional purposes of the school. While there are a
variety of factors that impact student learning, Walker and Shea (1995) point out that the relationships
between teacher and student will have the greatest impact on students. To this end, all data must
essentially answer questions about teacher-student relationships. Allodi (2010) writes that an
environment grounded in responsiveness and respect has significant bearing on the motivation of students
from diverse or disadvantaged backgrounds (Allodi, 2010) Three areas of concern arise when assessing
school data: (1) whether the school’s or district’s data plan accounts for all factors impacting student
learning, (2) if the school or district has adequate resources in place to collect and analyze data, and (3)
what occurs after data has been analyzed.
School Data Plans
The school’s data plan answers all pertinent questions about the collection, analysis, and use of
data to drive instruction. Holcomb calls this the achievement plan, answering questions of “why (mission
and portfolio), what (goals), and how (strategic evidence)” (Holcomb, 2004, p. 7). Additional questions
requiring answer are who will collect and analyze the data, when and where will this take place, and
funding for the data efforts . Holcomb believes that datas is the link for all educator’s efforts to improve
student achievement.
Frequently school leaders fail to utilize leading indicators to guide decision making. Leading
indicators provide early indicators about student success and help school and districts make preemptive
decisions and function less in a reactive way to test scores and student achievement (Foley, Mishook,
Thompson, Kubiak, Supovitz, & Rhude-Faust, 2008). The data plan exists within the School
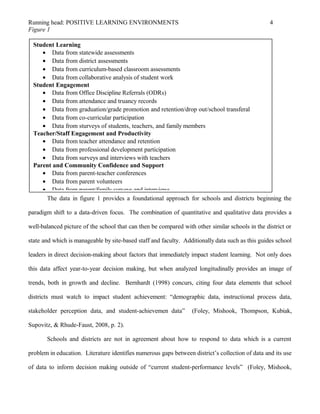
Improvement Plan (SIP) and consists of data addressing four areas (see figure 1 from Holcomb, 2004).
Running head: POSITIVE LEARNING ENVIRONMENTS 4
Figure 1
The data in figure 1 provides a foundational approach for schools and districts beginning the
paradigm shift to a data-driven focus. The combination of quantitative and qualitative data provides a
well-balanced picture of the school that can then be compared with other similar schools in the district or
state and which is manageable by site-based staff and faculty. Additionally data such as this guides school
leaders in direct decision-making about factors that immediately impact student learning. Not only does
this data affect year-to-year decision making, but when analyzed longitudinally provides an image of
trends, both in growth and decline. Bernhardt (1998) concurs, citing four data elements that school
districts must watch to impact student achievement: “demographic data, instructional process data,
stakeholder perception data, and student-achievemen data” (Foley, Mishook, Thompson, Kubiak,
Supovitz, & Rhude-Faust, 2008, p. 2).
Schools and districts are not in agreement about how to respond to data which is a current
problem in education. Literature identifies numerous gaps between district’s collection of data and its use
of data to inform decision making outside of “current student-performance levels” (Foley, Mishook,
Student Learning
• Data from statewide assessments
• Data from district assessments
• Data from curriculum-based classroom assessments
• Data from collaborative analysis of student work
Student Engagement
• Data from Office Discipline Referrals (ODRs)
• Data from attendance and truancy records
• Data from graduation/grade promotion and retention/drop out/school transferal
• Data from co-curricular participation
• Data from sturveys of students, teachers, and family members
Teacher/Staff Engagement and Productivity
• Data from teacher attendance and retention
• Data from professional development participation
• Data from surveys and interviews with teachers
Parent and Community Confidence and Support
• Data from parent-teacher conferences
• Data from parent volunteers
• Data from parent/family surveys and interviews
Running head: POSITIVE LEARNING ENVIRONMENTS 5
Thompson, Kubiak, Supovitz, & Rhude-Faust, 2008, p. 6). Where CSUSA excels is in their collection of
leading benchmark indicators as predictors of success on state-mandated tests in Florida. CSUSA
schools in Florida take three Discovery Education tests annually which are reviewed by faculty and staff
as indicators of potential success on the spring’s FCAT test. Foley et al. (2008) define leading indicators
as: timely and actionable, benchmarked, and powerful. The three Discovery tests (one in the fall, one in
winter and one in spring) provide data about CSUSA student achievement on reading comprehension,
math, and science. Teachers and administrators use Discovery data to identify students who may benefit
from additional supports like after-school tutoring, identify curricular areas which are lagging and which
curricular areas are on or above-level, and which students may need additional services in the form of
IEPs, 504s, ESOL, or other school-supported services.
School Resources
One problem that occurs with the trend towards a data driven education system is that many
schools are not equipped to handle large quantity of data required by their districts, or necessary to make
truly impactful changes (Childress, Elmore, Grossman, & Johnson, 2007). Schools like Woodmont
Charter School, under the propriety of Charter Schools USA (CSUSA) provides the basic data like
FCAT (Florida’s standardized test) and students’ classroom grades, however fail to provide detailed
attendance and behavioral data, a key component to managing a Title 1 school. The positive behavioral
instructional support (PBIS) model relies heavily on data to drive instruction about acceptable behavior
and drive down the recurrence of behavioral incidents and office discipline referrals (ODRs).
Analyzing ODR data on a regular basis by the PBIS team which includes teachers representative
of all grade levels, specialization areas and administration (Clonan, McDougal, Clark, & Davison, 2007)
provide a look at factors that inhibit the learning of students due to behavioral needs and the success of
targeted interventions. Clonan, et al. recommend looking at ODRs by month, by infraction, by location,
by student, and by staff member. This data helps school address the needs of all students and helps
identify where additional support is needed throughout the school.
Running head: POSITIVE LEARNING ENVIRONMENTS 6
Research has identified that reductions in school violence acount for increases in student
engagement and success (Karcher, 2002; Goldstein, Young, and Boyd, 2008; Brookmeyer, Fanti, and
Henrich, 2006). Resources are needed not only to analyze behavioral data, but to provide support for
teachers in the form of professional development experiences about classroom management strategies.
Wilson (2004) believes that the level of support and connectedness a student feels with his or her school
is in direct proportion to his or her propencity toward agression or victimization. PBIS is designed to
support students’ connectedness to their school, peers, and teachers by offering a tiered level of
behavioral support.
As schools tackle issues of behavior, they will see a reduction in absenteeism, truism, and an
increase in school climate which promoted greater learning by students. Reseach from Berkowicz and
Bier (2005), Catalano, Berglunc, Ryan, Lonczak, and Hawkins (2002), and Greenberg, Weissberg,
O’Brien, Zins, Fredericks, Resnik, and Elias (2003) indicate that a positive school climate leads to a
reduction in risky behaviors linked to drug use, alcoholism, absenteeism, bullying and physical violence.
Cragor (2008) cites a long list of positive benefits for schools that successfully implement PBIS. Among
those benefits are significant reductions in office referals, absetneeism, drop-out rates, and referrals to
special education services (Cregor, 2008). Positive outcomes include improvement in school
engagement, improved academic achievement, and an improved school atmosphere.
Implementation after Data Collection and Analysis
PBIS efforts are in vain without followthrough to implement them into the school system. Cregor
stresses that PBIS is system wide and must be taught throughout the year after the initial introduction at
the year’s start (Cregor, 2008). Without a commitment to ongoing classroom instruction about PBIS
the systems fail and data collection and analysis is moot. PBIS makes disciplinary action consistent for all
students. Kathy Davis, assistant principal at Abbott Middle School told Cregor, “It’s hard to argue with
the numbers” (Cregor, 2008, p. 33). The numbers to which she refers are data about office referrals and
attandance that is used at Abbott to monitor trends in student behavior and be proactive rather than
Running head: POSITIVE LEARNING ENVIRONMENTS 7
reactive. Abbott’s PBIS team meets monthly and includes teachers from each grade level and department
who then take data back to departmental meetings for further discussion.
That PBIS is efficable with each individual school and its resources means that there is no need to
ear mark funds for implementation, as much of the required resources are free to schools through the
National PBIS Technical Assistance Center (PBIS, 2011; Bradshaw and Pass, 2011). Bradshaw and Pass
(2011) emphasize that PBIS works into existing school cultures and works with other strategies such as
RtI and functional behavioral assessments.
Data is generally the missing component to successful implementation and sustainability of PBIS
programs in schools. The missing component is not the collection of data, but rather what to do with the
data once it is collected. When Maryland implemented state-wide PBIS efforts they were armed with
dasta about school safety (Hogan et al., 2003).
Perceptions of School Safety
The PBIS School Safety Survey (Sprague, Colvin, & Irvin, 2003) is a document available to all
schools, comprised of two rating sections and a section for respondents to provide commentary about
their perception of safety at their school. The survey was administered to two administrators, seven
teachers (representing grades K-1, 2-3, 4, 5, 6, 7, and electives courses), as well as lunch and custodial
staff at Woodmont. School staff reported top three safety concerns as truancy, student suspension and/or
expulsion, and poverty. During the 2011-2012 school year, Woodmont Charter School reported 68%
(FLDOE) of students eligible for free or reduced lunch. Such a high percentage from a school located in
a community grounded in poverty in which city-data.com reports 55% of married families have neither
adult working, 49% of poor residents reported not working, 51% of households are led my single mother
where the husband is not present, and 7% of children live in poverty compared with 21% in the state of
Florida.
Running head: POSITIVE LEARNING ENVIRONMENTS 8
Woodmont’s Discovery test data supports the school’s state “D” rating (FLDOE, 2012) with a
high degree of failure on reading, math, and science tests. When asked (Woodmont Parent A, 2013, (A,
2013; Woodmont Parent B, 2013; Woodmont Parent C, 2013), parents of Woodmont students were
unaware that individual student data on the three benchmark tests were available upon request. Teachers
are provided data based on their homeroom, which is problematic for middle school teachers who see
every child in their grade, yet are not privy to data outside of their homerooms unless specifically asked
of the data team. When assessed in 2013 homeroom scores for sixth grade Language Arts were 17%
and for sixth grade social studies were 21%; a computation based on the percentage of students meeting
adequate (level 3 or higher) on FCAT (reading, writing, math, and science), percentages of students
making learning gains, and adequate progress within the lowest 25% of the gradew population. A
passing (D) score is considered 49%.
What is not occurring is the transferral of data into the classroom to aid in student achievement.
Information from the school safety survey (Sprague, Colvin, & Irvin, 2003) indicates that teachers feel
little support from administration on disciplinary issues, while administation feels that teachers lack
adequate classroom management abilities. Parents agree that teachers need better classroom management
training.
Another Level 2 Heading
AAA bbb cccc dddd eeee ffff gggg hhhh iiii jjjj kkkk llll mmmm nnnn oooo pppp qqqq rrrr sssss
tttt uuuu vvvv wwww xxxx yyyy zzzz. AAA bbb cccc dddd eeee ffff gggg hhhh iiii jjjj kkkk llll mmmm
nnnn oooo pppp qqqq rrrr sssss tttt uuuu vvvv wwww xxxx yyyy zzzz. AAA bbb cccc dddd eeee ffff
gggg hhhh iiii jjjj kkkk llll mmmm nnnn oooo pppp qqqq rrrr sssss tttt uuuu vvvv wwww xxxx yyyy zzzz.
AAA bbb cccc dddd eeee ffff gggg hhhh iiii jjjj kkkk llll mmmm nnnn oooo pppp qqqq rrrr sssss tttt uuuu
vvvv wwww xxxx yyyy zzzz. AAA bbb cccc dddd eeee ffff gggg hhhh iiii jjjj kkkk llll mmmm nnnn oooo
pppp qqqq rrrr sssss tttt uuuu vvvv wwww xxxx yyyy zzzz.
Running head: POSITIVE LEARNING ENVIRONMENTS 9
Level 3 heading. AAA bbb cccc dddd eeee ffff gggg hhhh iiii jjjj kkkk llll mmmm nnnn oooo
pppp qqqq rrrr sssss tttt uuuu vvvv wwww xxxx yyyy zzzz. AAA bbb cccc dddd eeee ffff gggg hhhh iiii
jjjj kkkk llll mmmm nnnn oooo pppp qqqq rrrr sssss tttt uuuu vvvv wwww xxxx yyyy zzzz. AAA bbb
cccc dddd eeee ffff gggg hhhh iiii jjjj kkkk llll mmmm nnnn oooo pppp qqqq rrrr sssss tttt uuuu vvvv
wwww xxxx yyyy zzzz. AAA bbb cccc dddd eeee ffff gggg hhhh iiii jjjj kkkk llll mmmm nnnn oooo pppp
qqqq rrrr sssss tttt uuuu vvvv wwww xxxx yyyy zzzz.
Level 4 heading. AAA bbb cccc dddd eeee ffff gggg hhhh iiii jjjj kkkk llll mmmm. AAA bbb cccc
dddd eeee ffff gggg hhhh iiii jjjj kkkk llll mmmm nnnn oooo pppp qqqq rrrr sssss tttt uuuu vvvv wwww
xxxx yyyy zzzz. AAA bbb cccc dddd eeee ffff gggg hhhh iiii jjjj kkkk llll mmmm nnnn oooo pppp qqqq
rrrr sssss tttt uuuu vvvv wwww xxxx yyyy zzzz.
Level 4 heading. AAA bbb cccc dddd eeee ffff gggg hhhh iiii jjjj kkkk llll mmmm. AAA bbb cccc
dddd eeee ffff gggg hhhh iiii jjjj kkkk llll mmmm nnnn oooo pppp qqqq rrrr sssss tttt uuuu vvvv wwww
xxxx yyyy zzzz.
Level 3 heading. AAA bbb cccc dddd eeee ffff gggg hhhh iiii jjjj kkkk llll mmmm nnnn oooo
pppp qqqq rrrr sssss tttt uuuu vvvv wwww xxxx yyyy zzzz. AAA bbb cccc dddd eeee ffff gggg hhhh iiii
jjjj kkkk llll mmmm nnnn oooo pppp qqqq rrrr sssss tttt uuuu vvvv wwww xxxx yyyy zzzz. AAA bbb
cccc dddd eeee ffff gggg hhhh iiii jjjj kkkk llll mmmm nnnn oooo pppp qqqq rrrr sssss tttt uuuu vvvv
wwww xxxx yyyy zzzz.
Appendix B
Essential Questions for School Safety Planning
Choose a minimum of 5 staff, including 1 administrator, 1 custodial staff member, 1
supervisory/classified member, 1 certified member and 1 office staff member, to complete this
survey. Please place a check (X) next to the item that best reflects your opinion for each
question. Your responses will be valuable in determining training and support needs related to
school safety and violence prevention.
Running head: POSITIVE LEARNING ENVIRONMENTS 10
School Name: __________ Date: ____/____/____
District: _________________________ State: _____________
Your Role:
1. Administrator _____
2. Teacher _____
3. Special Education Teacher _____
4. Educational Assistant _____
5. Office Staff _____
6. Custodial Staff _____
7. Related Service Provider _____
8. Student _____
9. Parent _____
10.Community Member _____
11.Other ____
POSITIVE LEARNING ENVIRONMENTS
Section One: Assessment of Risk Factors for School Safety and Violence
Indicate the extent to which
these factors exist in your
school and neighborhood:
Rating
not at all minimally moderately extensively don’t know
1. Illegal weapons.
2. Vandalism.
3. High student mobility (i.e. frequent
changes in school enrollment).
4. Graffiti.
5. Gang activity.
6. Truancy.
7. Student suspensions and/or expulsions.
8. Students adjudicated by the court.
9. Parents withdrawing students from
school because of safety concerns.
10. Child abuse in the home.
11. Trespassing on school grounds.
12. Poverty.
13. Crimes (e.g. theft, extortion, hazing).
14. Illegal drug and alcohol use.
15. Fights, conflict, and assault.
16. Incidence of bullying, intimidation, and
harassment.
17. Deteriorating condition of the physical
facilities in the school.
Section Two: Assessment of Response Plans for School Safety and Violence
Rating
11
POSITIVE LEARNING ENVIRONMENTS
Section Two: Assessment of Response Plans for School Safety and Violence
Indicate the extent to which
these factors exist in your
school and neighborhood:
not at all minimally moderately extensively don’t know
18. Opportunity for extracurricular
programs and sports activities.
19. Professional development and staff
training.
20. Crisis and emergency response plans.
21. Consistently implemented school-wide
discipline plans.
22. Student support services in school (e.g.
counseling, monitoring, support team
systems).
23. Parent involvement in our school (e.g.
efforts to enhance school safety,
student support).
24. Student preparation for crises and
emergencies.
25. Supervision of students across all
settings.
26. Suicide prevention/response plans.
27. Student participation and involvement
in academic activities.
28. Positive school climate for learning.
29. Acceptance of diversity.
30. Response to conflict and problem
solving.
31. Collaboration with community
resources.
32. High expectations for student learning
and productivity.
33. Effective student-teacher relationships.
12
POSITIVE LEARNING ENVIRONMENTS
Section Three: Your Comments on School Safety and Violence
1. What is the most pressing safety need in your school?
2. What school safety activities does your school do best?
3. What topics are most important for training and staff development?
4. What are the biggest barriers to improved school safety measures?
5. What other comments do you have regarding school safety?
6. What other factors not included in this survey do you believe affect school safety?
13
POSITIVE LEARNING ENVIRONMENTS
References
(Please note that the following references are intended as examples only.)
Alexander, G., & Bonaparte, N. (2008). My way or the highway that I built. Ancient Dictators,
25(7), 14-31. doi:10.8220/CTCE.52.1.23-91
Babar, E. (2007). The art of being a French elephant. Adventurous Cartoon Animals, 19, 4319-
4392. Retrieved from http://www.elephants104.ace.org
Bumstead, D. (2009). The essentials: Sandwiches and sleep. Journals of Famous Loafers, 5, 565-
582. doi:12.2847/CEDG.39.2.51-71
Hansel, G., & Gretel, D. (1973). Candied houses and unfriendly occupants. Thousand Oaks, CA:
Fairy Tale Publishing.
Hera, J. (2008). Why Paris was wrong. Journal of Greek Goddess Sore Spots, 20(4), 19-21. doi:
15.555/GGE.64.1.76-82
Laureate Education, Inc. (Producer). (2007). How to cite a video: The city is always Baltimore
[DVD]. Baltimore, MD: Author.
Laureate Education, Inc. (Producer). (2010). Name of program [Video webcast]. Retrieved from
http://www.courseurl.com
Sinatra, F. (2008). Zing! Went the strings of my heart. Making Good Songs Great, 18(3), 31-22.
Retrieved from http://articlesextollingrecordingsofyore.192/fs.com
Smasfaldi, H., Wareumph, I., Aeoli, Q., Rickies, F., Furoush, P., Aaegrade, V., … Fiiel, B.
(2005). The art of correcting surname mispronunciation. New York, NY: Supportive
Publisher Press. Retrieved from
http://www.onewaytociteelectronicbooksperAPA7.02.com
14
POSITIVE LEARNING ENVIRONMENTS
White, S., & Red, R. (2001). Stop and smell the what now? Floral arranging for beginners
(Research Report No. 40-921). Retrieved from University of Wooded Glen, Center for
Aesthetic Improvements in Fairy Tales website: http://www.uwg.caift/~40_921.pdf
15

More Related Content

What's hot

Effect of teaching method, choice of discipline and student lecturer relation...
Effect of teaching method, choice of discipline and student lecturer relation...Effect of teaching method, choice of discipline and student lecturer relation...
Effect of teaching method, choice of discipline and student lecturer relation...
Alexander Decker
 
Dissertation defense ppt
Dissertation defense ppt Dissertation defense ppt
Dissertation defense ppt
Dr. James Lake
 
Brooks,%20 morris%20middle%20school%20principals%20nfeasj%20v27%20n4%202010
Brooks,%20 morris%20middle%20school%20principals%20nfeasj%20v27%20n4%202010Brooks,%20 morris%20middle%20school%20principals%20nfeasj%20v27%20n4%202010
Brooks,%20 morris%20middle%20school%20principals%20nfeasj%20v27%20n4%202010
William Kritsonis
 
Carol A Johnson Pbr Spresentation
Carol A Johnson Pbr SpresentationCarol A Johnson Pbr Spresentation
Carol A Johnson Pbr Spresentation
carol_johnson
 
Learning analytics summary document Prakash
Learning analytics summary document PrakashLearning analytics summary document Prakash
Learning analytics summary document PrakashPrakash Hegde
 
Dissertation defense power point
Dissertation defense power pointDissertation defense power point
Dissertation defense power pointKelly Dodson
 
CCSA 2015 225. Increasing the Teacher's Effectiveness Toolbox
CCSA 2015 225. Increasing the Teacher's Effectiveness ToolboxCCSA 2015 225. Increasing the Teacher's Effectiveness Toolbox
CCSA 2015 225. Increasing the Teacher's Effectiveness Toolbox
joniallison23
 
Teacher opinions about the use of Value-Added models
Teacher opinions about the use of Value-Added models Teacher opinions about the use of Value-Added models
Teacher opinions about the use of Value-Added models llee18
 
10.1.1.115.7999(1)
10.1.1.115.7999(1)10.1.1.115.7999(1)
10.1.1.115.7999(1)Gary Abud Jr
 
Action Research Proposal Presentation [Autosaved].pptx
Action Research Proposal  Presentation [Autosaved].pptxAction Research Proposal  Presentation [Autosaved].pptx
Action Research Proposal Presentation [Autosaved].pptx
StephanieWillis11
 
Manelyn L. Mananap Thesis (Bibliography)
Manelyn L. Mananap Thesis (Bibliography)Manelyn L. Mananap Thesis (Bibliography)
Manelyn L. Mananap Thesis (Bibliography)
mtlobrido
 
Data and Assessment in Academic Libraries: Linking Freshmen Student Success a...
Data and Assessment in Academic Libraries: Linking Freshmen Student Success a...Data and Assessment in Academic Libraries: Linking Freshmen Student Success a...
Data and Assessment in Academic Libraries: Linking Freshmen Student Success a...
Georgia Libraries Conference (formerly Ga COMO).
 
Educator Autonomy Research Sources and Summaries
Educator Autonomy Research Sources and SummariesEducator Autonomy Research Sources and Summaries
Educator Autonomy Research Sources and Summaries
ppageegd
 
Suspending ISS Research Study
Suspending ISS Research StudySuspending ISS Research Study
Suspending ISS Research StudyLeron Rahynes
 
Jorge Cimentada- Master's thesis
Jorge Cimentada- Master's thesisJorge Cimentada- Master's thesis
Jorge Cimentada- Master's thesisJorge Cimentada
 
Multiple Measures Of Data Slide
Multiple Measures Of Data SlideMultiple Measures Of Data Slide
Multiple Measures Of Data SlideWSU Cougars
 
Using State ECE Workforce Registry Data
Using State ECE Workforce Registry DataUsing State ECE Workforce Registry Data
Using State ECE Workforce Registry DataDebra Ackerman
 
Self-selection in choice of occupations
Self-selection in choice of occupationsSelf-selection in choice of occupations
Self-selection in choice of occupations
GRAPE
 
Understanding the U.S. News & World Report “Best Colleges” 2007 - Handout
Understanding the U.S. News & World Report “Best Colleges” 2007 - HandoutUnderstanding the U.S. News & World Report “Best Colleges” 2007 - Handout
Understanding the U.S. News & World Report “Best Colleges” 2007 - HandoutMatthew Hendrickson
 

What's hot (20)

Effect of teaching method, choice of discipline and student lecturer relation...
Effect of teaching method, choice of discipline and student lecturer relation...Effect of teaching method, choice of discipline and student lecturer relation...
Effect of teaching method, choice of discipline and student lecturer relation...
 
Dissertation defense ppt
Dissertation defense ppt Dissertation defense ppt
Dissertation defense ppt
 
Brooks,%20 morris%20middle%20school%20principals%20nfeasj%20v27%20n4%202010
Brooks,%20 morris%20middle%20school%20principals%20nfeasj%20v27%20n4%202010Brooks,%20 morris%20middle%20school%20principals%20nfeasj%20v27%20n4%202010
Brooks,%20 morris%20middle%20school%20principals%20nfeasj%20v27%20n4%202010
 
Carol A Johnson Pbr Spresentation
Carol A Johnson Pbr SpresentationCarol A Johnson Pbr Spresentation
Carol A Johnson Pbr Spresentation
 
Learning analytics summary document Prakash
Learning analytics summary document PrakashLearning analytics summary document Prakash
Learning analytics summary document Prakash
 
Dissertation defense power point
Dissertation defense power pointDissertation defense power point
Dissertation defense power point
 
CCSA 2015 225. Increasing the Teacher's Effectiveness Toolbox
CCSA 2015 225. Increasing the Teacher's Effectiveness ToolboxCCSA 2015 225. Increasing the Teacher's Effectiveness Toolbox
CCSA 2015 225. Increasing the Teacher's Effectiveness Toolbox
 
Teacher opinions about the use of Value-Added models
Teacher opinions about the use of Value-Added models Teacher opinions about the use of Value-Added models
Teacher opinions about the use of Value-Added models
 
10.1.1.115.7999(1)
10.1.1.115.7999(1)10.1.1.115.7999(1)
10.1.1.115.7999(1)
 
Action Research Proposal Presentation [Autosaved].pptx
Action Research Proposal  Presentation [Autosaved].pptxAction Research Proposal  Presentation [Autosaved].pptx
Action Research Proposal Presentation [Autosaved].pptx
 
Manelyn L. Mananap Thesis (Bibliography)
Manelyn L. Mananap Thesis (Bibliography)Manelyn L. Mananap Thesis (Bibliography)
Manelyn L. Mananap Thesis (Bibliography)
 
Data and Assessment in Academic Libraries: Linking Freshmen Student Success a...
Data and Assessment in Academic Libraries: Linking Freshmen Student Success a...Data and Assessment in Academic Libraries: Linking Freshmen Student Success a...
Data and Assessment in Academic Libraries: Linking Freshmen Student Success a...
 
Educator Autonomy Research Sources and Summaries
Educator Autonomy Research Sources and SummariesEducator Autonomy Research Sources and Summaries
Educator Autonomy Research Sources and Summaries
 
Suspending ISS Research Study
Suspending ISS Research StudySuspending ISS Research Study
Suspending ISS Research Study
 
Jorge Cimentada- Master's thesis
Jorge Cimentada- Master's thesisJorge Cimentada- Master's thesis
Jorge Cimentada- Master's thesis
 
1.1.16 Course Fusion . DSS, Inc v3
1.1.16 Course Fusion . DSS, Inc v31.1.16 Course Fusion . DSS, Inc v3
1.1.16 Course Fusion . DSS, Inc v3
 
Multiple Measures Of Data Slide
Multiple Measures Of Data SlideMultiple Measures Of Data Slide
Multiple Measures Of Data Slide
 
Using State ECE Workforce Registry Data
Using State ECE Workforce Registry DataUsing State ECE Workforce Registry Data
Using State ECE Workforce Registry Data
 
Self-selection in choice of occupations
Self-selection in choice of occupationsSelf-selection in choice of occupations
Self-selection in choice of occupations
 
Understanding the U.S. News & World Report “Best Colleges” 2007 - Handout
Understanding the U.S. News & World Report “Best Colleges” 2007 - HandoutUnderstanding the U.S. News & World Report “Best Colleges” 2007 - Handout
Understanding the U.S. News & World Report “Best Colleges” 2007 - Handout
 

Viewers also liked

Essential oil diffuser
Essential oil diffuserEssential oil diffuser
Essential oil diffuser
FloraVida
 
autodest certificate from Auto desk
autodest certificate from Auto deskautodest certificate from Auto desk
autodest certificate from Auto deskShirin Pourvesal
 
중소기업을 위한 블로그 기초 세팅
중소기업을 위한 블로그 기초 세팅중소기업을 위한 블로그 기초 세팅
중소기업을 위한 블로그 기초 세팅
성혁 장
 
Kenyan media freedom
Kenyan media freedom Kenyan media freedom
Kenyan media freedom
HENRY NEONDO
 
The Missing Future: MOMA and Modern Women
The Missing Future: MOMA and Modern WomenThe Missing Future: MOMA and Modern Women
The Missing Future: MOMA and Modern Women
Alejandro Collados-Nunez
 
소셜에티켓
소셜에티켓소셜에티켓
소셜에티켓
성혁 장
 
Ejercicios con referencias, filtros
Ejercicios con referencias, filtros Ejercicios con referencias, filtros
Ejercicios con referencias, filtros
Johanna Castro
 
Taxi And Its History
Taxi And Its HistoryTaxi And Its History
Taxi And Its History
taxiservice farnham
 
Rainwater harvesting in Chandigarh_Architect Surinder Bahga_August 19, 2015
Rainwater harvesting in Chandigarh_Architect Surinder Bahga_August 19, 2015Rainwater harvesting in Chandigarh_Architect Surinder Bahga_August 19, 2015
Rainwater harvesting in Chandigarh_Architect Surinder Bahga_August 19, 2015
India Water Portal
 
Motorcycle usage in Vietnam
Motorcycle usage in VietnamMotorcycle usage in Vietnam
Motorcycle usage in Vietnam
DI Marketing
 

Viewers also liked (10)

Essential oil diffuser
Essential oil diffuserEssential oil diffuser
Essential oil diffuser
 
autodest certificate from Auto desk
autodest certificate from Auto deskautodest certificate from Auto desk
autodest certificate from Auto desk
 
중소기업을 위한 블로그 기초 세팅
중소기업을 위한 블로그 기초 세팅중소기업을 위한 블로그 기초 세팅
중소기업을 위한 블로그 기초 세팅
 
Kenyan media freedom
Kenyan media freedom Kenyan media freedom
Kenyan media freedom
 
The Missing Future: MOMA and Modern Women
The Missing Future: MOMA and Modern WomenThe Missing Future: MOMA and Modern Women
The Missing Future: MOMA and Modern Women
 
소셜에티켓
소셜에티켓소셜에티켓
소셜에티켓
 
Ejercicios con referencias, filtros
Ejercicios con referencias, filtros Ejercicios con referencias, filtros
Ejercicios con referencias, filtros
 
Taxi And Its History
Taxi And Its HistoryTaxi And Its History
Taxi And Its History
 
Rainwater harvesting in Chandigarh_Architect Surinder Bahga_August 19, 2015
Rainwater harvesting in Chandigarh_Architect Surinder Bahga_August 19, 2015Rainwater harvesting in Chandigarh_Architect Surinder Bahga_August 19, 2015
Rainwater harvesting in Chandigarh_Architect Surinder Bahga_August 19, 2015
 
Motorcycle usage in Vietnam
Motorcycle usage in VietnamMotorcycle usage in Vietnam
Motorcycle usage in Vietnam
 

Similar to MA2and8CCornwell

School districts are in the process of adopting theResponse .docx
School districts are in the process of adopting theResponse .docxSchool districts are in the process of adopting theResponse .docx
School districts are in the process of adopting theResponse .docx
anhlodge
 
Eunetra Ellison Simpson, PhD Proposal Defense, Dr. William Allan Kritsonis, D...
Eunetra Ellison Simpson, PhD Proposal Defense, Dr. William Allan Kritsonis, D...Eunetra Ellison Simpson, PhD Proposal Defense, Dr. William Allan Kritsonis, D...
Eunetra Ellison Simpson, PhD Proposal Defense, Dr. William Allan Kritsonis, D...
William Kritsonis
 
Eunetra Ellison-Simpson
Eunetra Ellison-SimpsonEunetra Ellison-Simpson
Eunetra Ellison-Simpson
William Kritsonis
 
An Evaluation Of Predictors Of Achievement On Selected Outcomes In A Self-Pac...
An Evaluation Of Predictors Of Achievement On Selected Outcomes In A Self-Pac...An Evaluation Of Predictors Of Achievement On Selected Outcomes In A Self-Pac...
An Evaluation Of Predictors Of Achievement On Selected Outcomes In A Self-Pac...
Zaara Jensen
 
Scott, T. M., Hirn, R., and Barber, H
Scott, T. M., Hirn, R., and Barber, HScott, T. M., Hirn, R., and Barber, H
Scott, T. M., Hirn, R., and Barber, HHouston Barber
 
Effects of School of Life Foundation Intervention on Grade Advancement, Drop...
 Effects of School of Life Foundation Intervention on Grade Advancement, Drop... Effects of School of Life Foundation Intervention on Grade Advancement, Drop...
Effects of School of Life Foundation Intervention on Grade Advancement, Drop...
Research Journal of Education
 
Dr. John Hamilton, Texas A&M University at Texarkana
Dr. John Hamilton, Texas A&M University at TexarkanaDr. John Hamilton, Texas A&M University at Texarkana
Dr. John Hamilton, Texas A&M University at Texarkana
William Kritsonis
 
Data Driven Decision Making
Data Driven Decision MakingData Driven Decision Making
Data Driven Decision MakingMelissa Roth
 
Felege, christopher online education perceptions and recommendations focus ...
Felege, christopher online education   perceptions and recommendations focus ...Felege, christopher online education   perceptions and recommendations focus ...
Felege, christopher online education perceptions and recommendations focus ...
William Kritsonis
 
Oumh1103 pdf factor influencing adult learners' decicion to drop out or per...
Oumh1103 pdf factor influencing adult learners'  decicion to drop  out or per...Oumh1103 pdf factor influencing adult learners'  decicion to drop  out or per...
Oumh1103 pdf factor influencing adult learners' decicion to drop out or per...Mohamad Kelana Mat
 
Running Head PERSUASIVE PAPER PART 11PERSUASIVE PAPER PAR.docx
Running Head PERSUASIVE PAPER PART 11PERSUASIVE PAPER PAR.docxRunning Head PERSUASIVE PAPER PART 11PERSUASIVE PAPER PAR.docx
Running Head PERSUASIVE PAPER PART 11PERSUASIVE PAPER PAR.docx
charisellington63520
 
Current Practices and Barriers of Training Paraeducators Who work with Elemen...
Current Practices and Barriers of Training Paraeducators Who work with Elemen...Current Practices and Barriers of Training Paraeducators Who work with Elemen...
Current Practices and Barriers of Training Paraeducators Who work with Elemen...
National Resource Center for Paraprofessionals
 
Discussion 5Critically think about ethnocentrism, culture, and
Discussion 5Critically think about ethnocentrism, culture, andDiscussion 5Critically think about ethnocentrism, culture, and
Discussion 5Critically think about ethnocentrism, culture, and
LyndonPelletier761
 
Pages 8 35
Pages 8 35Pages 8 35
Pages 8 35
maryjoy tangkilan
 
A Framework for Examining Tailored Longitudinal Data to Advance Institutional...
A Framework for Examining Tailored Longitudinal Data to Advance Institutional...A Framework for Examining Tailored Longitudinal Data to Advance Institutional...
A Framework for Examining Tailored Longitudinal Data to Advance Institutional...
crealcsuf
 
Running Header PROJECT BASED LEARNING PROJECT BASED LEARNING .docx
Running Header PROJECT BASED LEARNING PROJECT BASED LEARNING   .docxRunning Header PROJECT BASED LEARNING PROJECT BASED LEARNING   .docx
Running Header PROJECT BASED LEARNING PROJECT BASED LEARNING .docx
agnesdcarey33086
 
Classroom Social Environment and School Performance in The Selected Secondary...
Classroom Social Environment and School Performance in The Selected Secondary...Classroom Social Environment and School Performance in The Selected Secondary...
Classroom Social Environment and School Performance in The Selected Secondary...
AJHSSR Journal
 
EDUCARNIVAL 2014 at IIT Delhi- School leadership and its effect on student ac...
EDUCARNIVAL 2014 at IIT Delhi- School leadership and its effect on student ac...EDUCARNIVAL 2014 at IIT Delhi- School leadership and its effect on student ac...
EDUCARNIVAL 2014 at IIT Delhi- School leadership and its effect on student ac...
Eduexcellence
 

Similar to MA2and8CCornwell (20)

School districts are in the process of adopting theResponse .docx
School districts are in the process of adopting theResponse .docxSchool districts are in the process of adopting theResponse .docx
School districts are in the process of adopting theResponse .docx
 
Eunetra Ellison Simpson, PhD Proposal Defense, Dr. William Allan Kritsonis, D...
Eunetra Ellison Simpson, PhD Proposal Defense, Dr. William Allan Kritsonis, D...Eunetra Ellison Simpson, PhD Proposal Defense, Dr. William Allan Kritsonis, D...
Eunetra Ellison Simpson, PhD Proposal Defense, Dr. William Allan Kritsonis, D...
 
Eunetra Ellison-Simpson
Eunetra Ellison-SimpsonEunetra Ellison-Simpson
Eunetra Ellison-Simpson
 
An Evaluation Of Predictors Of Achievement On Selected Outcomes In A Self-Pac...
An Evaluation Of Predictors Of Achievement On Selected Outcomes In A Self-Pac...An Evaluation Of Predictors Of Achievement On Selected Outcomes In A Self-Pac...
An Evaluation Of Predictors Of Achievement On Selected Outcomes In A Self-Pac...
 
Scott, T. M., Hirn, R., and Barber, H
Scott, T. M., Hirn, R., and Barber, HScott, T. M., Hirn, R., and Barber, H
Scott, T. M., Hirn, R., and Barber, H
 
Effects of School of Life Foundation Intervention on Grade Advancement, Drop...
 Effects of School of Life Foundation Intervention on Grade Advancement, Drop... Effects of School of Life Foundation Intervention on Grade Advancement, Drop...
Effects of School of Life Foundation Intervention on Grade Advancement, Drop...
 
Dr. John Hamilton, Texas A&M University at Texarkana
Dr. John Hamilton, Texas A&M University at TexarkanaDr. John Hamilton, Texas A&M University at Texarkana
Dr. John Hamilton, Texas A&M University at Texarkana
 
Data Driven Decision Making
Data Driven Decision MakingData Driven Decision Making
Data Driven Decision Making
 
Felege, christopher online education perceptions and recommendations focus ...
Felege, christopher online education   perceptions and recommendations focus ...Felege, christopher online education   perceptions and recommendations focus ...
Felege, christopher online education perceptions and recommendations focus ...
 
Oumh1103 pdf factor influencing adult learners' decicion to drop out or per...
Oumh1103 pdf factor influencing adult learners'  decicion to drop  out or per...Oumh1103 pdf factor influencing adult learners'  decicion to drop  out or per...
Oumh1103 pdf factor influencing adult learners' decicion to drop out or per...
 
Running Head PERSUASIVE PAPER PART 11PERSUASIVE PAPER PAR.docx
Running Head PERSUASIVE PAPER PART 11PERSUASIVE PAPER PAR.docxRunning Head PERSUASIVE PAPER PART 11PERSUASIVE PAPER PAR.docx
Running Head PERSUASIVE PAPER PART 11PERSUASIVE PAPER PAR.docx
 
Current Practices and Barriers of Training Paraeducators Who work with Elemen...
Current Practices and Barriers of Training Paraeducators Who work with Elemen...Current Practices and Barriers of Training Paraeducators Who work with Elemen...
Current Practices and Barriers of Training Paraeducators Who work with Elemen...
 
Discussion 5Critically think about ethnocentrism, culture, and
Discussion 5Critically think about ethnocentrism, culture, andDiscussion 5Critically think about ethnocentrism, culture, and
Discussion 5Critically think about ethnocentrism, culture, and
 
Pages 8 35
Pages 8 35Pages 8 35
Pages 8 35
 
A Framework for Examining Tailored Longitudinal Data to Advance Institutional...
A Framework for Examining Tailored Longitudinal Data to Advance Institutional...A Framework for Examining Tailored Longitudinal Data to Advance Institutional...
A Framework for Examining Tailored Longitudinal Data to Advance Institutional...
 
Running Header PROJECT BASED LEARNING PROJECT BASED LEARNING .docx
Running Header PROJECT BASED LEARNING PROJECT BASED LEARNING   .docxRunning Header PROJECT BASED LEARNING PROJECT BASED LEARNING   .docx
Running Header PROJECT BASED LEARNING PROJECT BASED LEARNING .docx
 
Hall
HallHall
Hall
 
Wheatleyetal2009
Wheatleyetal2009Wheatleyetal2009
Wheatleyetal2009
 
Classroom Social Environment and School Performance in The Selected Secondary...
Classroom Social Environment and School Performance in The Selected Secondary...Classroom Social Environment and School Performance in The Selected Secondary...
Classroom Social Environment and School Performance in The Selected Secondary...
 
EDUCARNIVAL 2014 at IIT Delhi- School leadership and its effect on student ac...
EDUCARNIVAL 2014 at IIT Delhi- School leadership and its effect on student ac...EDUCARNIVAL 2014 at IIT Delhi- School leadership and its effect on student ac...
EDUCARNIVAL 2014 at IIT Delhi- School leadership and its effect on student ac...
 

More from Chad Cornwell

Beginning Band Instrument Selection
Beginning Band Instrument SelectionBeginning Band Instrument Selection
Beginning Band Instrument SelectionChad Cornwell
 
MajorAssessment3CCornwell
MajorAssessment3CCornwellMajorAssessment3CCornwell
MajorAssessment3CCornwellChad Cornwell
 
MD6AssignCCornwell PP
MD6AssignCCornwell PPMD6AssignCCornwell PP
MD6AssignCCornwell PPChad Cornwell
 
Lesson Plan Vocabulary 9
Lesson Plan Vocabulary 9Lesson Plan Vocabulary 9
Lesson Plan Vocabulary 9Chad Cornwell
 
Lesson Plan Closed Reading Grade 9
Lesson Plan Closed Reading Grade 9Lesson Plan Closed Reading Grade 9
Lesson Plan Closed Reading Grade 9Chad Cornwell
 
Lesson Plan Oral Language Grade 1112.2
Lesson Plan Oral Language Grade 1112.2Lesson Plan Oral Language Grade 1112.2
Lesson Plan Oral Language Grade 1112.2Chad Cornwell
 

More from Chad Cornwell (11)

Beginning Band Instrument Selection
Beginning Band Instrument SelectionBeginning Band Instrument Selection
Beginning Band Instrument Selection
 
MajorAssessment3CCornwell
MajorAssessment3CCornwellMajorAssessment3CCornwell
MajorAssessment3CCornwell
 
MD8Assign1CCornwell
MD8Assign1CCornwellMD8Assign1CCornwell
MD8Assign1CCornwell
 
MD2AssignCCornwell
MD2AssignCCornwellMD2AssignCCornwell
MD2AssignCCornwell
 
MD6AssignCCornwell
MD6AssignCCornwellMD6AssignCCornwell
MD6AssignCCornwell
 
MD6AssignCCornwell PP
MD6AssignCCornwell PPMD6AssignCCornwell PP
MD6AssignCCornwell PP
 
MA4CCornwell
MA4CCornwellMA4CCornwell
MA4CCornwell
 
MD8AssignCCornwell
MD8AssignCCornwellMD8AssignCCornwell
MD8AssignCCornwell
 
Lesson Plan Vocabulary 9
Lesson Plan Vocabulary 9Lesson Plan Vocabulary 9
Lesson Plan Vocabulary 9
 
Lesson Plan Closed Reading Grade 9
Lesson Plan Closed Reading Grade 9Lesson Plan Closed Reading Grade 9
Lesson Plan Closed Reading Grade 9
 
Lesson Plan Oral Language Grade 1112.2
Lesson Plan Oral Language Grade 1112.2Lesson Plan Oral Language Grade 1112.2
Lesson Plan Oral Language Grade 1112.2
 

MA2and8CCornwell

  • 1. Running head: POSITIVE LEARNING ENVIRONMENTS 1 Understanding Positive Enviornments for Student Learning and Professional Collaboration Chad D. Cornwell Walden University
  • 2. Abstract Abstracts are not required for all course papers. Please ask your instructor if you have questions regarding whether an abstract is required for a particular assignment.
  • 3. Running head: POSITIVE LEARNING ENVIRONMENTS 3 Data Driven Instruction in Title 1 Schools Sound, comprehensive data is the greatest asset Title 1 schools use to drive impactful instructional practices. Outside of academic data from classrooms and strategic testing, data collected about discipline and attendance, school and classroom climate, educational resources, and more help guide administrators and educators in the daily instructional purposes of the school. While there are a variety of factors that impact student learning, Walker and Shea (1995) point out that the relationships between teacher and student will have the greatest impact on students. To this end, all data must essentially answer questions about teacher-student relationships. Allodi (2010) writes that an environment grounded in responsiveness and respect has significant bearing on the motivation of students from diverse or disadvantaged backgrounds (Allodi, 2010) Three areas of concern arise when assessing school data: (1) whether the school’s or district’s data plan accounts for all factors impacting student learning, (2) if the school or district has adequate resources in place to collect and analyze data, and (3) what occurs after data has been analyzed. School Data Plans The school’s data plan answers all pertinent questions about the collection, analysis, and use of data to drive instruction. Holcomb calls this the achievement plan, answering questions of “why (mission and portfolio), what (goals), and how (strategic evidence)” (Holcomb, 2004, p. 7). Additional questions requiring answer are who will collect and analyze the data, when and where will this take place, and funding for the data efforts . Holcomb believes that datas is the link for all educator’s efforts to improve student achievement. Frequently school leaders fail to utilize leading indicators to guide decision making. Leading indicators provide early indicators about student success and help school and districts make preemptive decisions and function less in a reactive way to test scores and student achievement (Foley, Mishook, Thompson, Kubiak, Supovitz, & Rhude-Faust, 2008). The data plan exists within the School Improvement Plan (SIP) and consists of data addressing four areas (see figure 1 from Holcomb, 2004).
  • 4. Running head: POSITIVE LEARNING ENVIRONMENTS 4 Figure 1 The data in figure 1 provides a foundational approach for schools and districts beginning the paradigm shift to a data-driven focus. The combination of quantitative and qualitative data provides a well-balanced picture of the school that can then be compared with other similar schools in the district or state and which is manageable by site-based staff and faculty. Additionally data such as this guides school leaders in direct decision-making about factors that immediately impact student learning. Not only does this data affect year-to-year decision making, but when analyzed longitudinally provides an image of trends, both in growth and decline. Bernhardt (1998) concurs, citing four data elements that school districts must watch to impact student achievement: “demographic data, instructional process data, stakeholder perception data, and student-achievemen data” (Foley, Mishook, Thompson, Kubiak, Supovitz, & Rhude-Faust, 2008, p. 2). Schools and districts are not in agreement about how to respond to data which is a current problem in education. Literature identifies numerous gaps between district’s collection of data and its use of data to inform decision making outside of “current student-performance levels” (Foley, Mishook, Student Learning • Data from statewide assessments • Data from district assessments • Data from curriculum-based classroom assessments • Data from collaborative analysis of student work Student Engagement • Data from Office Discipline Referrals (ODRs) • Data from attendance and truancy records • Data from graduation/grade promotion and retention/drop out/school transferal • Data from co-curricular participation • Data from sturveys of students, teachers, and family members Teacher/Staff Engagement and Productivity • Data from teacher attendance and retention • Data from professional development participation • Data from surveys and interviews with teachers Parent and Community Confidence and Support • Data from parent-teacher conferences • Data from parent volunteers • Data from parent/family surveys and interviews
  • 5. Running head: POSITIVE LEARNING ENVIRONMENTS 5 Thompson, Kubiak, Supovitz, & Rhude-Faust, 2008, p. 6). Where CSUSA excels is in their collection of leading benchmark indicators as predictors of success on state-mandated tests in Florida. CSUSA schools in Florida take three Discovery Education tests annually which are reviewed by faculty and staff as indicators of potential success on the spring’s FCAT test. Foley et al. (2008) define leading indicators as: timely and actionable, benchmarked, and powerful. The three Discovery tests (one in the fall, one in winter and one in spring) provide data about CSUSA student achievement on reading comprehension, math, and science. Teachers and administrators use Discovery data to identify students who may benefit from additional supports like after-school tutoring, identify curricular areas which are lagging and which curricular areas are on or above-level, and which students may need additional services in the form of IEPs, 504s, ESOL, or other school-supported services. School Resources One problem that occurs with the trend towards a data driven education system is that many schools are not equipped to handle large quantity of data required by their districts, or necessary to make truly impactful changes (Childress, Elmore, Grossman, & Johnson, 2007). Schools like Woodmont Charter School, under the propriety of Charter Schools USA (CSUSA) provides the basic data like FCAT (Florida’s standardized test) and students’ classroom grades, however fail to provide detailed attendance and behavioral data, a key component to managing a Title 1 school. The positive behavioral instructional support (PBIS) model relies heavily on data to drive instruction about acceptable behavior and drive down the recurrence of behavioral incidents and office discipline referrals (ODRs). Analyzing ODR data on a regular basis by the PBIS team which includes teachers representative of all grade levels, specialization areas and administration (Clonan, McDougal, Clark, & Davison, 2007) provide a look at factors that inhibit the learning of students due to behavioral needs and the success of targeted interventions. Clonan, et al. recommend looking at ODRs by month, by infraction, by location, by student, and by staff member. This data helps school address the needs of all students and helps identify where additional support is needed throughout the school.
  • 6. Running head: POSITIVE LEARNING ENVIRONMENTS 6 Research has identified that reductions in school violence acount for increases in student engagement and success (Karcher, 2002; Goldstein, Young, and Boyd, 2008; Brookmeyer, Fanti, and Henrich, 2006). Resources are needed not only to analyze behavioral data, but to provide support for teachers in the form of professional development experiences about classroom management strategies. Wilson (2004) believes that the level of support and connectedness a student feels with his or her school is in direct proportion to his or her propencity toward agression or victimization. PBIS is designed to support students’ connectedness to their school, peers, and teachers by offering a tiered level of behavioral support. As schools tackle issues of behavior, they will see a reduction in absenteeism, truism, and an increase in school climate which promoted greater learning by students. Reseach from Berkowicz and Bier (2005), Catalano, Berglunc, Ryan, Lonczak, and Hawkins (2002), and Greenberg, Weissberg, O’Brien, Zins, Fredericks, Resnik, and Elias (2003) indicate that a positive school climate leads to a reduction in risky behaviors linked to drug use, alcoholism, absenteeism, bullying and physical violence. Cragor (2008) cites a long list of positive benefits for schools that successfully implement PBIS. Among those benefits are significant reductions in office referals, absetneeism, drop-out rates, and referrals to special education services (Cregor, 2008). Positive outcomes include improvement in school engagement, improved academic achievement, and an improved school atmosphere. Implementation after Data Collection and Analysis PBIS efforts are in vain without followthrough to implement them into the school system. Cregor stresses that PBIS is system wide and must be taught throughout the year after the initial introduction at the year’s start (Cregor, 2008). Without a commitment to ongoing classroom instruction about PBIS the systems fail and data collection and analysis is moot. PBIS makes disciplinary action consistent for all students. Kathy Davis, assistant principal at Abbott Middle School told Cregor, “It’s hard to argue with the numbers” (Cregor, 2008, p. 33). The numbers to which she refers are data about office referrals and attandance that is used at Abbott to monitor trends in student behavior and be proactive rather than
  • 7. Running head: POSITIVE LEARNING ENVIRONMENTS 7 reactive. Abbott’s PBIS team meets monthly and includes teachers from each grade level and department who then take data back to departmental meetings for further discussion. That PBIS is efficable with each individual school and its resources means that there is no need to ear mark funds for implementation, as much of the required resources are free to schools through the National PBIS Technical Assistance Center (PBIS, 2011; Bradshaw and Pass, 2011). Bradshaw and Pass (2011) emphasize that PBIS works into existing school cultures and works with other strategies such as RtI and functional behavioral assessments. Data is generally the missing component to successful implementation and sustainability of PBIS programs in schools. The missing component is not the collection of data, but rather what to do with the data once it is collected. When Maryland implemented state-wide PBIS efforts they were armed with dasta about school safety (Hogan et al., 2003). Perceptions of School Safety The PBIS School Safety Survey (Sprague, Colvin, & Irvin, 2003) is a document available to all schools, comprised of two rating sections and a section for respondents to provide commentary about their perception of safety at their school. The survey was administered to two administrators, seven teachers (representing grades K-1, 2-3, 4, 5, 6, 7, and electives courses), as well as lunch and custodial staff at Woodmont. School staff reported top three safety concerns as truancy, student suspension and/or expulsion, and poverty. During the 2011-2012 school year, Woodmont Charter School reported 68% (FLDOE) of students eligible for free or reduced lunch. Such a high percentage from a school located in a community grounded in poverty in which city-data.com reports 55% of married families have neither adult working, 49% of poor residents reported not working, 51% of households are led my single mother where the husband is not present, and 7% of children live in poverty compared with 21% in the state of Florida.
  • 8. Running head: POSITIVE LEARNING ENVIRONMENTS 8 Woodmont’s Discovery test data supports the school’s state “D” rating (FLDOE, 2012) with a high degree of failure on reading, math, and science tests. When asked (Woodmont Parent A, 2013, (A, 2013; Woodmont Parent B, 2013; Woodmont Parent C, 2013), parents of Woodmont students were unaware that individual student data on the three benchmark tests were available upon request. Teachers are provided data based on their homeroom, which is problematic for middle school teachers who see every child in their grade, yet are not privy to data outside of their homerooms unless specifically asked of the data team. When assessed in 2013 homeroom scores for sixth grade Language Arts were 17% and for sixth grade social studies were 21%; a computation based on the percentage of students meeting adequate (level 3 or higher) on FCAT (reading, writing, math, and science), percentages of students making learning gains, and adequate progress within the lowest 25% of the gradew population. A passing (D) score is considered 49%. What is not occurring is the transferral of data into the classroom to aid in student achievement. Information from the school safety survey (Sprague, Colvin, & Irvin, 2003) indicates that teachers feel little support from administration on disciplinary issues, while administation feels that teachers lack adequate classroom management abilities. Parents agree that teachers need better classroom management training. Another Level 2 Heading AAA bbb cccc dddd eeee ffff gggg hhhh iiii jjjj kkkk llll mmmm nnnn oooo pppp qqqq rrrr sssss tttt uuuu vvvv wwww xxxx yyyy zzzz. AAA bbb cccc dddd eeee ffff gggg hhhh iiii jjjj kkkk llll mmmm nnnn oooo pppp qqqq rrrr sssss tttt uuuu vvvv wwww xxxx yyyy zzzz. AAA bbb cccc dddd eeee ffff gggg hhhh iiii jjjj kkkk llll mmmm nnnn oooo pppp qqqq rrrr sssss tttt uuuu vvvv wwww xxxx yyyy zzzz. AAA bbb cccc dddd eeee ffff gggg hhhh iiii jjjj kkkk llll mmmm nnnn oooo pppp qqqq rrrr sssss tttt uuuu vvvv wwww xxxx yyyy zzzz. AAA bbb cccc dddd eeee ffff gggg hhhh iiii jjjj kkkk llll mmmm nnnn oooo pppp qqqq rrrr sssss tttt uuuu vvvv wwww xxxx yyyy zzzz.
  • 9. Running head: POSITIVE LEARNING ENVIRONMENTS 9 Level 3 heading. AAA bbb cccc dddd eeee ffff gggg hhhh iiii jjjj kkkk llll mmmm nnnn oooo pppp qqqq rrrr sssss tttt uuuu vvvv wwww xxxx yyyy zzzz. AAA bbb cccc dddd eeee ffff gggg hhhh iiii jjjj kkkk llll mmmm nnnn oooo pppp qqqq rrrr sssss tttt uuuu vvvv wwww xxxx yyyy zzzz. AAA bbb cccc dddd eeee ffff gggg hhhh iiii jjjj kkkk llll mmmm nnnn oooo pppp qqqq rrrr sssss tttt uuuu vvvv wwww xxxx yyyy zzzz. AAA bbb cccc dddd eeee ffff gggg hhhh iiii jjjj kkkk llll mmmm nnnn oooo pppp qqqq rrrr sssss tttt uuuu vvvv wwww xxxx yyyy zzzz. Level 4 heading. AAA bbb cccc dddd eeee ffff gggg hhhh iiii jjjj kkkk llll mmmm. AAA bbb cccc dddd eeee ffff gggg hhhh iiii jjjj kkkk llll mmmm nnnn oooo pppp qqqq rrrr sssss tttt uuuu vvvv wwww xxxx yyyy zzzz. AAA bbb cccc dddd eeee ffff gggg hhhh iiii jjjj kkkk llll mmmm nnnn oooo pppp qqqq rrrr sssss tttt uuuu vvvv wwww xxxx yyyy zzzz. Level 4 heading. AAA bbb cccc dddd eeee ffff gggg hhhh iiii jjjj kkkk llll mmmm. AAA bbb cccc dddd eeee ffff gggg hhhh iiii jjjj kkkk llll mmmm nnnn oooo pppp qqqq rrrr sssss tttt uuuu vvvv wwww xxxx yyyy zzzz. Level 3 heading. AAA bbb cccc dddd eeee ffff gggg hhhh iiii jjjj kkkk llll mmmm nnnn oooo pppp qqqq rrrr sssss tttt uuuu vvvv wwww xxxx yyyy zzzz. AAA bbb cccc dddd eeee ffff gggg hhhh iiii jjjj kkkk llll mmmm nnnn oooo pppp qqqq rrrr sssss tttt uuuu vvvv wwww xxxx yyyy zzzz. AAA bbb cccc dddd eeee ffff gggg hhhh iiii jjjj kkkk llll mmmm nnnn oooo pppp qqqq rrrr sssss tttt uuuu vvvv wwww xxxx yyyy zzzz. Appendix B Essential Questions for School Safety Planning Choose a minimum of 5 staff, including 1 administrator, 1 custodial staff member, 1 supervisory/classified member, 1 certified member and 1 office staff member, to complete this survey. Please place a check (X) next to the item that best reflects your opinion for each question. Your responses will be valuable in determining training and support needs related to school safety and violence prevention.
  • 10. Running head: POSITIVE LEARNING ENVIRONMENTS 10 School Name: __________ Date: ____/____/____ District: _________________________ State: _____________ Your Role: 1. Administrator _____ 2. Teacher _____ 3. Special Education Teacher _____ 4. Educational Assistant _____ 5. Office Staff _____ 6. Custodial Staff _____ 7. Related Service Provider _____ 8. Student _____ 9. Parent _____ 10.Community Member _____ 11.Other ____
  • 11. POSITIVE LEARNING ENVIRONMENTS Section One: Assessment of Risk Factors for School Safety and Violence Indicate the extent to which these factors exist in your school and neighborhood: Rating not at all minimally moderately extensively don’t know 1. Illegal weapons. 2. Vandalism. 3. High student mobility (i.e. frequent changes in school enrollment). 4. Graffiti. 5. Gang activity. 6. Truancy. 7. Student suspensions and/or expulsions. 8. Students adjudicated by the court. 9. Parents withdrawing students from school because of safety concerns. 10. Child abuse in the home. 11. Trespassing on school grounds. 12. Poverty. 13. Crimes (e.g. theft, extortion, hazing). 14. Illegal drug and alcohol use. 15. Fights, conflict, and assault. 16. Incidence of bullying, intimidation, and harassment. 17. Deteriorating condition of the physical facilities in the school. Section Two: Assessment of Response Plans for School Safety and Violence Rating 11
  • 12. POSITIVE LEARNING ENVIRONMENTS Section Two: Assessment of Response Plans for School Safety and Violence Indicate the extent to which these factors exist in your school and neighborhood: not at all minimally moderately extensively don’t know 18. Opportunity for extracurricular programs and sports activities. 19. Professional development and staff training. 20. Crisis and emergency response plans. 21. Consistently implemented school-wide discipline plans. 22. Student support services in school (e.g. counseling, monitoring, support team systems). 23. Parent involvement in our school (e.g. efforts to enhance school safety, student support). 24. Student preparation for crises and emergencies. 25. Supervision of students across all settings. 26. Suicide prevention/response plans. 27. Student participation and involvement in academic activities. 28. Positive school climate for learning. 29. Acceptance of diversity. 30. Response to conflict and problem solving. 31. Collaboration with community resources. 32. High expectations for student learning and productivity. 33. Effective student-teacher relationships. 12
  • 13. POSITIVE LEARNING ENVIRONMENTS Section Three: Your Comments on School Safety and Violence 1. What is the most pressing safety need in your school? 2. What school safety activities does your school do best? 3. What topics are most important for training and staff development? 4. What are the biggest barriers to improved school safety measures? 5. What other comments do you have regarding school safety? 6. What other factors not included in this survey do you believe affect school safety? 13
  • 14. POSITIVE LEARNING ENVIRONMENTS References (Please note that the following references are intended as examples only.) Alexander, G., & Bonaparte, N. (2008). My way or the highway that I built. Ancient Dictators, 25(7), 14-31. doi:10.8220/CTCE.52.1.23-91 Babar, E. (2007). The art of being a French elephant. Adventurous Cartoon Animals, 19, 4319- 4392. Retrieved from http://www.elephants104.ace.org Bumstead, D. (2009). The essentials: Sandwiches and sleep. Journals of Famous Loafers, 5, 565- 582. doi:12.2847/CEDG.39.2.51-71 Hansel, G., & Gretel, D. (1973). Candied houses and unfriendly occupants. Thousand Oaks, CA: Fairy Tale Publishing. Hera, J. (2008). Why Paris was wrong. Journal of Greek Goddess Sore Spots, 20(4), 19-21. doi: 15.555/GGE.64.1.76-82 Laureate Education, Inc. (Producer). (2007). How to cite a video: The city is always Baltimore [DVD]. Baltimore, MD: Author. Laureate Education, Inc. (Producer). (2010). Name of program [Video webcast]. Retrieved from http://www.courseurl.com Sinatra, F. (2008). Zing! Went the strings of my heart. Making Good Songs Great, 18(3), 31-22. Retrieved from http://articlesextollingrecordingsofyore.192/fs.com Smasfaldi, H., Wareumph, I., Aeoli, Q., Rickies, F., Furoush, P., Aaegrade, V., … Fiiel, B. (2005). The art of correcting surname mispronunciation. New York, NY: Supportive Publisher Press. Retrieved from http://www.onewaytociteelectronicbooksperAPA7.02.com 14
  • 15. POSITIVE LEARNING ENVIRONMENTS White, S., & Red, R. (2001). Stop and smell the what now? Floral arranging for beginners (Research Report No. 40-921). Retrieved from University of Wooded Glen, Center for Aesthetic Improvements in Fairy Tales website: http://www.uwg.caift/~40_921.pdf 15