1. Master Thesis • July 2015 • University Pompeu Fabra
Improving cognitive and non-cognitive abilities:
Impact evaluation of the AGE program in Mexico
Jorge Cimentada
University Pompeu Fabra
cimentadaj@gmail.com
Abstract
This article evaluates a World Bank policy named AGE that aims to involve parents in the decision
making process of schools. Using data from an experimental design, we explore if parents involvement
in the schools decision making in four rural provinces in Mexico improved math test scores and survey
response rates, a new and innovative measure of conscientiousness. With the 2007 baseline survey, which
contained 8,723 students, and the 2009 survey, which contained 7,311 respondents, we investigated dif-
ferences between treated and control students, indigenous and non-indigenous students and indigenous
students in the treated and control schools. We find that the application of the treatment has no signifi-
cant impact in both our measures of interest. We do find that indigenous students have higher response
rates than in the baseline survey. This, however, is not due to the treatment of interest. This is likely to
be related to the inclusion and acceptance of this marginalized group into society.
.
I. Introduction
World Bank interventions have long been inter-
ested in student’s test scores as a quantitative
measure of cognitive abilities. More specif-
ically, school-based management (a World
Bank educational policy designed to decen-
tralize educational decision making from the
government to school level) has limited its ef-
fectiveness to measuring how much these test
scores increase after applying the policy. A
likely explanation for this approach is that test
scores are easy to apply and widely accepted
as proxies of cognitive abilities.
However, a plethora of research from the past
decade has highlighted the importance of char-
acter skills, such as grit, persistence and con-
scientiousness, which are thought to have a
positive effect on labour market opportuni-
ties, higher wages, less criminal behaviour,
amongst others. Although there is a clear con-
sensus, some researchers are even suggesting
that early childhood interventions should give
more attention to non-cognitive over cognitive
ones (Almlund et al., 2011).
To raise attention on the importance of non-
cognitive skills on policy impact evaluation,
we study an experiment conducted in Mex-
ico from 2008-2010 by the World Bank. The
schools under study were all participating
in a Mexican program named AGE which
gave schools US$600 in quarterly payments
through the parents association. The goal of
this grant is to get parents involved in school
affairs, prompt them to take part in school de-
cisions and be involved in children’s school
activities. This grant has been shown to in-
crease parental participation in the decision
making process of schools (Gertler et al., 2012).
In the current experiment, World Bank investi-
gators increased the grant to US$1200 for the
treated schools to see if parental involvement
in school affairs increased even further. They
expected this grant to have an effect in low-
ering drop out rates, repetition rates and in-
crease test scores. Therefore, we question our-
selves, how did the AGE program influence
non-cognitive and cognitive skills?
The present study has two main strengths:
its randomized design and a innovative new
measurement of a non-cognitive skill. Edu-
cational interventions are often hard to study
in a randomized fashion. In fact, a handful
of school-based management evaluations have
1
2. Master Thesis • July 2015 • University Pompeu Fabra
had something close to a randomized design.
Having said that, this is one of the few evalua-
tions of school-based management under a rig-
orous experimental randomized design. We
take advantage of this to make strong causal
claims of the effect of the program on non-
cognitive and cognitive skills. In addition, we
incorporate a new measure of a non-cognitive
skill: survey response rates. Work by Heden-
gren and Stratmann (2012) and Hitt and Trivitt
(2013) has argued that survey response rates,
which measures the persistence of a student
to complete a survey, correlates with actual
proxies of conscientiousness, wages and later
educational attainment. Their arguments are
supported by their findings as they find that
survey response rates strongly predict educa-
tional attainment. These findings hold valid in
several nationally representative datasets, in-
cluding the National Longitudinal Survey of
Youth (NLSY). We find support that survey re-
sponse rates measures some type of conscien-
tiousness within our dataset and go further on
to use it as a proxy of non-cognitive skills.
Using World Bank data with the baseline sur-
vey for 2007, which contained 8,723 students
from ages 9 to 12, and the data for 2009, which
contained 7,311 students from ages 9 to 12, we
test if the program had an impact on survey
response rates and on math test scores. We
find evidence that the program had no impact
on survey response rates. We also don’t find
significant differences in test scores between
those treated and not treated. We extend this
to the disadvantaged children and find that in-
digenous children had significantly lower re-
sponse rates in the baseline but later on they
ceased to be significantly lower.This suggests
that indigenous children did have higher re-
sponse rates 2 years later. This, however, is not
likely to be due to the treatment. Our results
confirms that this type of school-based man-
agement does not show evidence of improving
this non-cognitive proxy or math grades.
II. Literature Review
I. Decentralizing education
Decentralizing educational systems is a trend
that has been gaining ground for the past
decade. The OECD, through the Program
for International Student Assessment (PISA),
has found that those countries who have al-
lowed teachers and principals to have an am-
ple range of decision making, have decreased
differences in test scores between schools, and
outperform countries with less decentraliza-
tion (OECD, 2013).
A benchmark example is the Finnish case. Pasi
Sahlberg (2007), from the World Bank, pro-
poses that the main success of the Finnish
system is that it grants complete responsibil-
ity to teachers and principals to make their
decisions in a vast array of educational as-
pects. When that happens, schools start to
offer different educational experiences (with-
out neglecting the quality of education), in-
creasing competition among schools, while
still maintaining a quality education for every-
one(Sahlberg, 2007).
To put it differently, starting from a simple
demand-supply model, as the product of ed-
ucation has more quality, more emphasis is
placed on diversification of the product and
thus schools become more encouraged to ex-
ceed each other. However, as Sahlberg (2007)
emphasizes, this worked seamlessly only be-
cause everyone, regardless of income or so-
cial background, had free access to all schools.
The schools were different, but all offered vir-
tually the same level of quality. Hanushek
and Wößmann (2007) have also uncovered
that learning encouragement can be driven by
school institutional factors. Allowing teach-
ers to decide how to teach the curriculum
and to choose their own personalized peda-
gogical techniques will promote and encour-
age a sense of responsibility in them. When
this mechanism is at play, then it will in-
evitably strengthen the accountability frame-
work given that teachers will feel responsible
for their outcomes.
School based management (SBM) is an edu-
2
3. Master Thesis • July 2015 • University Pompeu Fabra
cational policy that has been implemented in
developed as well as developing countries to
decentralize educational systems. The objec-
tive of the policy is to decentralize decision
making to the state, regional or school level,
depending on the specific goal of the reform-
ers (Bruns et al., 2011). The logic runs in this
manner: educational systems are organisms
which are far too complex to be efficiently han-
dled in a centralized fashion. Producing edu-
cational quality and distributing it equally is
almost impossible when decision making is
held solely by a single actor (King and Guerra,
2005). By transferring responsibility to local
stakeholders, who know much more about
what their community needs, it then becomes
an efficient means of making decisions. After
transferring authority to the schools, a coun-
cil composed of parents, teachers and princi-
pals is to be created on which consensus is
reached on the priorities of that school. What
is then applied to prevent undesirable results
is a set of limited responsibilities. Accord-
ing to Bruns et al. (2011), the decision making
that is allowed to teachers, parents or princi-
pals is limited to: budget allocations, decid-
ing on whether to dismiss or keep teachers,
administrative decisions such as buying text-
books, adjusting the curriculum, rebuilding or
improving school infrastructure and evaluat-
ing teacher and student outcomes. However,
some contend that this type of decentraliza-
tion is still ineffective given that key aspects of
the decision making process, like how the na-
tional curriculum is planned, are still unmov-
able from the central organism (Fullan and
Watson, 2000). Furthermore, another issue is
also whether parents are prepared to make
such decisions and if children will be affected
by this, as they might spend less time spent
with their parents.
In addition to the transfer of responsibilities,
SBM implements an accountability framework.
Those in charge of decision making are held
accountable for their decisions but also those
in charge of the decision making make those
below them accountable. Leithwood and Men-
zies (1998) find, after studying hundreds of
cases of SBM, four types of SBM: adminis-
trative control, professional control, commu-
nity control and balanced control. The first
one implies that principals are in sole own-
ership of decisions. The second one allows
only teachers to be in charge of the decision
making. The third just includes parents and
community stake holders and lastly, the fourth
one is a balanced control which involves par-
ents and teachers. However, the program has
evolved broadly and nowadays there are SBM
programs which involve school directors, par-
ents, teachers and even students themselves.
SBM has been implemented in many coun-
tries among which are the US (Taylor and
Teddlie, 1992), Nicaragua (King and Ozler,
2005), Guatemala, Honduras and El Salvador
(Di Gropello, 2006). All of these authors have
found that the program has had an impact
in lowering drop out rates, increasing student
enrolment and student achievement. On this
last outcome, however, there’s mixed evidence.
Findings by de Barros and Mendonca (1998)
show that achievement did not increase in
Brazil even after measuring it 11 years later.
As a matter of fact, Gertler et al. (2012) note
that SBM evaluations should be interpreted
with great care, as most of them haven’t had
rigorous experimental designs. In contrast,
they find that the results of those few stud-
ies with strong experimental designs are am-
biguous, ranging from strong improvements
of test scores to statistically insignificant im-
provements. In short, SBM proves to have
consistent and significant positive results on
intermediate school outcomes such as repeti-
tion rates, drop out rates and graduation rates.
When student achievement is concerned, how-
ever, mixed results blur the landscape.
Another concern that hampers the effective-
ness of SBM is whether parents are ready to
provide a good education to their children in
their family environment. Intermediate school
outcomes can be easily altered by being more
attentive on their children and their school
matters, but other skills, such as cognitive and
non-cognitive ones, might need a more thor-
ough approach. They need nurture in specific
3
4. Master Thesis • July 2015 • University Pompeu Fabra
high-quality activities like reading and discus-
sions. We raise this concern considering that
most SBM reforms have ignored the issue and
don’t give it the necessary attention(For a re-
view of almost all SBM evaluations and their
outcomes of interest, see Bruns et al., 2011).
The benefits of SBM depend greatly on the
type of the reform. In principal, the potential
benefits of SBM can be better management of
school affairs, be it economically, administra-
tive and extracurricular. Community involve-
ment in decision making can also drive to im-
provements in the quality of the classes and
the demands that are placed on the teachers.
Lastly, the most studied outcome and the one
with the most research is student achievement
measured as test scores. However, all of these
outcomes just represent the expected results of
changing structural aspects of schools. But if
teachers are developing new pedagogical tech-
niques, as well as improving their skills due
to accountability feedback, then we should ex-
pect a change in a wide variety of outcomes,
ranging from character skills to even students’
school perception. If that is combined with the
role of parents, like in the case of increased
community involvement, then the range of
possible outcomes should be even broader.
We presume that most SBM researchers limit
themselves to child outcomes that are specifi-
cally chosen given that they can be increased
in short time. When we turn to more demand-
ing skills, such as non-cognitive ones, they are
mostly neglected.
II. Non-cognitive skills
Just as SBM reformers, almost all researchers
in the field of educational research have con-
centrated on cognitive skills as the most im-
portant outcome in children and adolescents.
But prior research (Cunha et al., 2010) has
showed that when predicting, for instance,
educational attainment, cognitive abilities ex-
plain only 16% of the variance. Moreover, cog-
nitive abilities are found to be steadily formed
by age 10 whereas another set of skills, namely
non-cognitive ones, are found to be malleable
at later ages (Kautz et al., 2014). The impor-
tance of cognitive skills is, however, unques-
tionable. We do know that cognitive skills
are important predictors of life outcomes. But
what we have started to know in the past
years is that non-cognitive skills, such as per-
severance, grit and conscientiousness, might
be very important as well. Some even pro-
pose that these personality traits are more im-
portant than cognitive ones (Almlund et al.,
2011). Heckman and Rubinstein (2001) raised
the topic with surprising evidence from the
GED test in the United States. The GED test is
given to those students who never completed
high school and consequently could not en-
rol in tertiary education. This test serves as
a compensatory high school diploma if it is
passed. With data from the GED, the authors
found that those students who completed high
school education but did not attend college,
had the same levels of cognitive skills as those
who had passed the GED test. Strikingly, they
found that those who graduated high school
in the first place had substantial differences
with respect to GED recipients on earnings,
criminal behaviour and health. The authors
are tempted to link this difference to non-
cognitive skills; it should be noted that those
who took the GED tend to come from wealth-
ier, but rather unstable, households than those
other drop outs who did not pass the GED, so
selection bias might be at play.
In the same line of thought, something that
has become quite clear by now is that early
educational interventions serve as an effective
means to prevent and eliminate long term in-
equalities. Measurements at the moment chil-
dren enter early childcare provide evidence
that already in the early years there are re-
markable differences between advantaged and
disadvantaged children. These differences can
be explained by factors related to family en-
vironment (Heckman, 2008). But it is impor-
tant to note that adverse family environments
do not necessarily mean families with lower
incomes but rather those who spent low qual-
ity time or no time at all with their children
(Mayer, 1997).
4
5. Master Thesis • July 2015 • University Pompeu Fabra
Further research on the topic has shed light on
how the process of learning evolves over time.
A set of skills obtained at the adolescent years
depend greatly on the inputs that were given
in the early stages. Learning has a cumulative
toll on future skills and development (Cunha
and Heckman, 2007).This has important im-
plications for certain groups. Children from
disadvantaged backgrounds then have an im-
paired destiny. Precisely for that reason some
authors contend that instead of giving condi-
tional cash transfers to disadvantaged families,
just as the World Bank normally does, they
should be included in early intervention pro-
grams, which will certainly yield fruitful re-
sults in the long term (Currie, 2001). In fact,
almost all early childhood interventions that
have been evaluated so far confirm that chil-
dren, who were not exposed to stimulating ac-
tivities and quality time at earlier ages, benefit
over proportionally more than those who did
have a stimulating background (Schweinhart
and Weikart, 1981; Campbell et al., 2008; Lud-
wig and Miller, 2005). These interventions can
be summarized as equalizers of opportunities.
Heckman et al. (2004) make it clear that the
most cost-efficient strategy to prevent and cor-
rect for inequalities is to implement the pro-
gram when the child’s brain is at a sensitive
stage and learning is a crucial pillar for future
knowledge. In line with their findings, adoles-
cent interventions are also fruitful, although
much more expensive and less effective than
early ones. Nonetheless, we can apply this
logic to SBM reforms. Given that disadvan-
taged adolescents in the program did not have
an appropriate childhood environment, their
present set of skills are much less developed
than other kids. And as mentioned before,
cognitive skills tend to become stable around
the age of 10 whereas non-cognitive ones can
be improved much more effectively at later
ages. Following this argument, it might be in-
correct to solely concentrate on cognitive skills
and intermediate outcomes. If policies look
to improve long term sustainable life chances,
then improving test scores might as well be
useless given that cognitive skills are not that
malleable after an age threshold. Improving
character skills should be either equally or
even more beneficial to the disadvantaged in
this scenario.
III. Statement of the problem
SBM has concentrated their efforts on interme-
diate school outcomes and on student achieve-
ment, neglecting all the possible indirect out-
comes that the program might have. Moreover,
just as researchers have pointed out for the
Head Start program (Reid et al., 2001), teach-
ers are being trained to better educate the chil-
dren but not enough instruction is given to
the parents of the children. The most suc-
cessful SBM program implemented so far is
El Salvador’s EDUCO, which granted a high
degree of authority to parents and training in
school management as well as on developing
their capacity to help their children with their
homework. An in depth analysis by Jimenez
and Sawada (1999) attributes the success of
the program to the high parental participa-
tion. However, we beg to differ that the suc-
cess of the program could not have been at-
tained if parents had not been instructed on
how to help their children. Furthermore, we
don’t think that all of these early intervention
programs, such as the Perry pre-school pro-
gram and the Abecedarian Program, would
have yielded their strong and robust return
rates if parents had not participated in weekly
90 minute sessions on how to raise their chil-
dren1. In fact, it is not only about instruct-
ing parents but the frequency and importance
that is placed on this education. Fullan and
Watson (2000) review the most successful SBM
programs and find several common denomi-
nators among which is that the community
agrees unanimously that education is one of
the most important tenets of success and are
1The parent weekly training time varies per intervention, but the Perry pre-school program and the Abecedarian
had 90 minute sessions per week. See Schweinhart and Weikart (1981) and Campbell et al. (2008) for a review of the
experiments
5
6. Master Thesis • July 2015 • University Pompeu Fabra
willing to embark in the process of building
the community around education.
Mexico is one country that has adopted SBM
and decentralizing policies as a remedy to
their unequal educational system. Since 1991
to 2003, the Mexican government collaborated
with the World Bank and the Inter-American
Bank to improve teacher education and in-
crease enrolment of disadvantaged children
into schools as part of a bigger program
named CONAFE. Lopez-Acevedo and Paqueo
(2003) found that this collaboration yielded
positive results, as it increased enrolment of
indigenous children in the program, as well
as improved students test scores across the
economically disadvantaged population. In
the same line, the Mexican government orga-
nized and implemented the project Apoyo a
la Gestion Escolar (AGE). The program pro-
vides low performing schools (usually indige-
nous schools or schools located in marginal-
ized communities) with $600 dollars to the
school budget through the parents association
in quarterly payments. This can be seen as a
form of School Based Management (Patrinos
and Fasih, 2009) given that parents are now ex-
pected to get involved in school activities and
contribute to decision making. In addition to
the budgetary increase, participating parents
received a training on how to make school de-
cisions and how to help their children with
their homework. This, albeit not being a spe-
cific type of SBM, is considered a big step for
the educational landscape of Mexico consid-
ering that, generally, parents are scarcely in-
volved in school matters (Gertler et al., 2012).
The parents association is supposed to outline
a working plan of school priorities with the
teachers and principals, and plan a budget to
adhere to for the rest of the year. Parents
are allowed to allocate the budget to small
civil works and infrastructure improvements
as well as supplying the schools with the nec-
essary materials. Contrary to the Salvado-
rian EDUCO program, on which parents were
given the power to hire, monitor and dismiss
teachers, this program just allowed parents to
make budgetary decisions and plan school ac-
tivities.
However, as it is likely that these parents
are poorly educated, low income earners and
might not have that much time availability,
the training that was given to them was not
enough to successfully alter children’s family
environments. We hypothesize that skills like
conscientiousness and motivation were not in-
creased significantly, and as we’ve seen from
the literature, these are important skills that
can help children succeed in life outcomes2.
In addition to the training of the parents,
teacher’s education was not very thorough ei-
ther. Anderson (2002) mentions several com-
ponents that made one SBM reform effective:
classroom-based in service teacher training,
strengthening the capacity of the teachers as-
sociation to have constant developments, man-
agement training for head teachers and, lastly,
parental involvement and financial support at
the school level. A separate branch of research,
dedicated to measuring to what extent teacher
training and teacher quality influences student
achievement, has found similar results and
concludes that teacher experience and content
focused development are strong predictors of
student achievement(Harris and Sass, 2011).
From all of these components, AGE only has
parental involvement, financial support and
some type of development for teachers, as they
are getting feedback from the school coun-
cil. But the important strength of AGE, as ex-
pressed by the principal investigators (Gertler
et al., 2012), is that teachers and parents are
interacting much more than before, and as we
know from other SBM reviews, this has been
linked to improved student outcomes(Fullan
and Watson, 2000)
However, we question if this is enough. The
concern we’d like to raise for SBM is that
it is normally applied in low-income, dis-
advantaged rural areas where most of the
2However, we also acknowledge that, as Heckman (2013) wittily points out, research treats disadvantaged children as
those coming from poorly educated and low income families whereas they should instead pay attention to the adverseness
of the environment on which they were raised.
6
7. Master Thesis • July 2015 • University Pompeu Fabra
population is poorly educated and possibly
have adverse family environments relative to
those highly educated. Assuming this, then it
should be imperative for reformers to actually
include and reconceptualize SBM to stimulate
a more active approach by parents. What we
mean by an active approach is not to just be ac-
tive in school related activities, but to actually
train parents to know how to treat and behave
around their children to help them reach their
best potential.
The aims of the article is to see if the AGE
program (1) improved non cognitive skills and
(2) improved math test scores for the treated,
for the indigenous and for the indigenous in
the treatment group. We presume that the
parents training was not enough to produce
significant improvements on these two out-
comes. However, following the literature on
indigenous population, we do not know if
the indigenous in the treatment group ben-
efited from the program since they tend to
gain much more from these interventions than
non-indigenous(Shapiro and Trevino, 2004).
But given that parents were not thoroughly
trained, there are reasons to doubt the effec-
tiveness of the program. This last research
question is an exploratory one.
I. Design of the experiment
The World Bank, in collaboration with the
Ministry of Education of Mexico choose to
design an experiment to see if an increase in
the budget of the schools through the parents
association will increase intermediate school
outcomes and test scores. After obtaining the
complete list of all schools participating in
the AGE program, 250 schools were randomly
chosen to participate in the design. 125 of the
schools were randomly assigned to treatment
and the remaining 125 to the control group.
Having said that, both selection of schools and
assignment of the treatment complies with the
randomization assumption. Looking at the
distribution of general and indigenous school
within the treatment and control groups, the
investigators also confirmed that this distribu-
tion was relatively similar to the actual dis-
tribution of schools. The four provinces that
were eligible were Chiapas, Guerrero, Puebla
and Yucatan; they were the provinces with the
highest population of indigenous people.
So far all schools were receiving US$600
dollars as they were participating in AGE.
This new design will increase the budget
to US$1200 dollars for the selected schools
and leave the control group with the baseline
US$600 dollars; schools are subject to random
audits to make sure the money is being spent
correctly.
Just as with the initial AGE program, the par-
ents receive training on school management
as well as on how to help their children with
their homework. The frequency with which
these are conducted is around every three
weeks. From a child’s perspective, the treat-
ment they were receiving was in the form of
more involvement from their parents in school,
as well as on leisurely activities. According
to the objective of the investigators, more in-
volvement from parents in school affairs will
be reflected in more and better involvement by
the parents with their children. To clarify, the
treatment here is only an increase in US$600
dollars for the treatment group; both groups
were already receiving training for parents on
how to help with their children. The program
lasted from 2008 to 2010 with a baseline sur-
vey in 2007, with the surveys being carried out
at the end of each year.
To ensure school homogeneity between treat-
ment and control group, the investigators
compared 188 school characteristics for each
grade for each school for three years using cen-
sus data from the Ministry of Education, and
found that 91% of them were similar(Gertler
et al., 2012). This evidence strongly supports
the assumption of balance and homogeneity
between treated and control groups.
This is the first rigorously randomized experi-
ment of SBM and it complies with all assump-
tions to reach a causal conclusion of the pro-
gram. However, some limitations should be
noted. Namely that since we don’t have panel
7
8. Master Thesis • July 2015 • University Pompeu Fabra
data at the individual level, we can’t make any
definitive individual causal claims. Although
we don’t have reasons to believe that students
from 2009 are different from 2007, we do, for
example, have a different sample size, making
it difficult to compare between years.
IV. Data and methods
I. Data
For each wave student surveys were con-
ducted, as well as surveys interviewing the
president of the parent association, teachers of
every school and the principal of each school.
It should be noted that the utilized data con-
tains cross-sectional information of the stu-
dents of each school for each year, and does
not allow us to follow individual students over
separate years. A panel data analysis is there-
fore impossible. A school-level panel analy-
sis is, however, possible. Yet, since the ex-
periment fulfils the randomization procedure,
the unit homogeneity assumption, and there
was no sample attrition from the participating
schools, a simple difference between treatment
and control groups, controlling for a set of fac-
tors, will allow us to see unbiased estimates
of the treatment effect. As the treatment was
implemented in 2008, we choose 2007 as the
baseline year. The effect of the treatment will
be measured by comparing results from 2007
and 2009. The baseline dataset contains 8723
students from 250 schools. Students are be-
tween ages 9 and 12 and belong either to in-
digenous or general schools. Each student par-
ticipated in the national standardized test EN-
LACE, conducted every year in Mexico and
thus are comparable across schools. They are
not comparable across time mainly due to the
fact that the test is not the same every year and
could be more difficult in specific years.
For the 2009 dataset, 14,344 students were in-
terviewed. So far, the control group for this
experiment are those schools who are getting
the usual US$600 whereas the treatment group
is getting the usual budget, plus US$600 more
as the treatment. After 2009 the World Bank
introduced two new control groups: a pure
control, on which are the schools who are not
getting any funding whatsoever (they were
not participating in the AGE program), and
an artificial control, on which are schools who
only dedicated efforts to educate the parents
on how to help their children but without the
AGE funding. As tempting as these new con-
trols might be, they’re useless for the purpose
of this article because they are not compara-
ble to our initial treatment and control groups.
Having said that, we will restrict our analysis
to those students in the initial treatment and
control schools, which leaves us with a sam-
ple of 7,311 students.
II. Dependent variables
As we’ve been arguing so far, most educa-
tional research, be it for SBM or other pro-
gram evaluations, focuses on cognitive skills
as measured in standardized test scores. Non-
cognitive skills have been neglected so far
mainly because of two reasons: researchers
did not attribute that much importance to
these skills up until a decade ago, and its dif-
ficulty to include in surveys. Heckman and
Rubinstein (2001) state wisely that the neglect
that has hampered non cognitive skills is due
to the fact that we don’t have yet a robust and
reliable measure for it. The best instrument
we have so far is the big five questionnaire
which has been tested to be reliable across dif-
ferent contexts (Kautz et al., 2014). The big
five personality traits are openness to expe-
rience, conscientiousness, extraversion, agree-
ableness and neuroticism (termed OCEAN).
All of these facets are intended to measure
a different set of character skills. However,
it’s a long questionnaire and no consensus has
been reached on how to build a reliable short-
ened proxy. Among several attempts to do
so, the National Longitudinal Survey of Youth
included a component named the TIPI which
was analogous to the big five. It has received
much criticism due to its unreliability. In addi-
tion to its difficulty to measure, any question
related to character skills is plagued with ref-
8
9. Master Thesis • July 2015 • University Pompeu Fabra
erence bias.
When asked if a person is responsible, men-
tally, the comparison they make is relative to
another person(Kautz et al., 2014, pg. 18).
That other person might not be as responsible
and thus conclude that they are so. Psychol-
ogists have tried to find a way of removing
the reference bias by including specific tasks
within a survey (like solving acronyms) that
will measure the degree of persistence of re-
spondents. This, although very useful, still
hasn’t been applied extensively.
However, recent evidence by Hedengren and
Stratmann (2012) and Hitt and Trivitt (2013)
suggests they might have found an innovative
solution. Hedengren and Stratmann (2012) ex-
plore the power of survey response rates as
proxies of conscientiousness (one of the big
five personality traits). Completing question-
naires demands little or null intellectual effort
but demands focus and persistence especially
when they are long. The authors argue that
missing values and "don’t know" responses
have been classically treated as values miss-
ing at random, but this is actually important
information that can tell us a lot about the
subject under study. Preliminary attempts by
the authors find that survey response rates
are correlated with actual indicators of con-
scientiousness. Furthermore, Hitt and Trivitt
(2013) went on to implement this for different
datasets and found that for the NLSY of 1997,
survey response rates predict educational at-
tainment, even after controlling for cognitive
abilities and other sets of controls. They repli-
cated this for a small scale educational pro-
gram in Milwaukee, similar to most datasets
that educational researchers have at their dis-
posal, and found practically the same results.
These authors have started to give credibility
to this new proxy of conscientiousness. Fol-
lowing this argument, we will use the survey
response rate of each observation as one of
our dependent variables. The other one will
be standardized math scores. We will use
math grades given that a big proportion of
the schools are indigenous and might not be
completely fluent in Spanish. We have stud-
ied the program’s questionnaire for any other
reliable indicator of personality trait but there
wasn’t any. Several informal indicators such
as if the child likes to read were considered,
but as these are not backed up by the litera-
ture on personality or show reliability across
different studies, they were discarded.
We calculated survey response rates as all pos-
sible valid questions a subject had to answer.
Given that the questionnaire has several fil-
ters, those questions that were not supposed
to be answered have been excluded from the
computation. However, for the 2007 dataset,
some confusions with a filter led to over half
the sample answering 9 questions that were
not supposed to be answered. The filter ques-
tion was quite unclear and for the next waves
it was not changed, but better explained. The
error did not occur again in any of the other
waves, so the results for the 2009 wave are
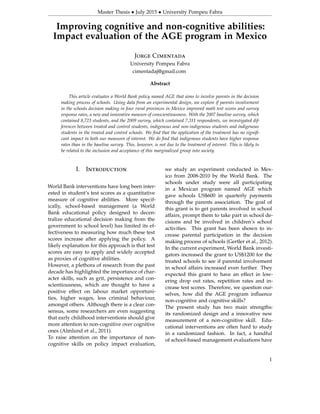
Table 1: Percentage of students who missed class by response rate quantiles
How many days did you miss class last month?
2007 2009
Response rate quantiles 0 1 2 3 4 5 0 1 2 3 4 5
Low response 65.1 17.3 9.4 4.3 2.0 1.9 67.5 14.1 8.0 3.9 3.6 3.0
2 67.4 17.2 7.4 4.1 2.0 2.0 71.3 13.0 8.3 2.3 2.3 2.8
3 69.5 16.0 7.2 3.1 1.8 2.4 70.2 14.8 7.6 3.5 1.9 2.0
High response 72.7 13.9 7.1 2.8 1.9 1.6 74.5 13.0 6.8 2.3 1.6 1.8
Total 68.8 16.1 7.8 3.6 1.9 2.0 70.8 13.7 7.7 3.0 2.4 2.4
9
10. Master Thesis • July 2015 • University Pompeu Fabra
Table 2: Child’s educational aspirations by response rate quantiles for 2007 and 2009
Children’s educational aspirations
2007 2009
Response rate quantiles High Mid Low High Mid Low
Low response 32.9 33.2 33.9 28.8 32.1 39.2
2 34.2 33.3 32.2 30.1 34.3 35.4
3 35.7 34.5 29.5 35.9 32.9 31.0
High response 39.7 33.8 26.3 38.0 31.6 30.1
Total 35.7 33.7 30.4 33.6 32.6 33.5
completely unbiased. Since we’ll be working
with the 2007 dataset, a decision was taken
to count those 9 questions as compulsory to
any subject that started to answer them, re-
gardless if passed the filter or not. If they
missed at least one of these questions, then it
was counted as missing. If the subject did not
answer any of the questions and wasn’t sup-
posed to in the filter, then we did not count
those as compulsory for them. Lastly, if they
were supposed to answer them and did not
do it, then we counted them as missing. Some
descriptives showing the validity of the proxy
are presented next.
Table 1 presents the quantiles for the survey
response rate by the frequency of school ab-
senteeism for years 2007 and 2009. For 2007,
72% of high survey respondents say they never
missed a class last month, whereas 65% in the
low response rate said the same. For 2009 the
difference is still persistent with 74% of high
survey respondents saying that they’ve never
missed class whereas 67% of lower survey re-
spondents say the same. This is in line with
previous literature, suggesting that children
who are more conscientious will go to class
more often than others (Lubbers, 2010). The
evidence for our dependent variable supports
that.
Table 2 shows how response rates relate to chil-
dren’s aspirations, and we can see that those
who are in the high quantile of response rates
tend to have higher aspirations than those in
the lower quantiles. For example, for 2007,
39.7% of high respondents would like to earn
a higher degree whereas 32.9% of low respon-
dents aspire the same. Conversely, 33.9% of
lower respondents aspire to have a degree be-
low secondary schooling, whereas 26.3% of
high respondents aspire to do so.
The results for 2009 are practically the same
and proves to be robust across time. Results
not shown here also validate the proxy, as we
find that response rates are mildly correlated
with grades (R = 0.27 for 2007 and R= 0.25 for
2009), that girls have significantly higher re-
sponse rates than boys3, that those who like to
read have significantly higher response rates
than those who don’t, indigenous children
(considered here as disadvantaged) have sig-
nificantly lower response rates than children
who aren’t indigenous, and lastly, we find that
those who have a good perception of school,
measured as if they think school will be use-
ful for the future, have significantly higher re-
sponse rates than those who repel school.
This variable has not been widely used in the
educational literature, however, the evidence
cited so far and the results from our analysis
support the notion that survey response rates
are measuring some type of conscientiousness
and responsibility of children.
The survey response rate goes from 0 to a 100
percent. The 2007 response rate has a mean
of 90.6% and a standard deviation of 12.41
whereas the 2009 dataset has a mean of 95.97%
and a standard deviation of 5.6.
Another outcome variable we consider is the
3Becker et al. (2010) found that women have, on average, more developed non-cognitive skills than men.
10
11. Master Thesis • July 2015 • University Pompeu Fabra
standardized test score, measured as the mark
they got in the last standardized math test. It
goes from a mark of 5 or less to 10. For the
2007 wave, the mean score in math was 8.2
with a standard deviation of 1.5 and in 2009
the mean grade was 7.7 with a standard devi-
ation of 1.34.
III. Control variables
Considering that the program was evaluated
under a rigorous experimental design, it is not
completely necessary to control for covariates.
However, to increase efficiency and to control
for residual random imbalance among the co-
variates, we briefly justify the use of some con-
trol variables we consider important. We have
encompassed the control variables in four cate-
gories: Socio-economic status (SES), family en-
vironment, child characteristics and classroom
characteristics.
The socio-economic status of subject is a
standard control in the sociological literature
(Caro and Cortés, 2012). It’s important to note
that the intrinsic level of persistence and grit
might differ for different levels of their socio-
economic status. However, the SES is quite
difficult to measure on this setting. There are
several reasons why having a single indica-
tor of SES would be imprecise here. First off,
no question was asked about household in-
come, as the young respondents are unlikely
to have an insight in the financial situation of
the households. In addition, all answers are
plagued by some degree of children bias as
they might not know specific details of the
household. Secondly, the sample of study is
quite homogeneous, making it difficult to use
classical measures of SES. For instance, 30%
to 50% of university degree parents are farm-
ers in both 2007 and 2009, and 63% of those
without any level of schooling whatsoever are
also farmers. Thirdly, the well-known Erik-
son and Goldthorpe (1992) class schema will
surely not capture the real prestige in these ru-
ral areas. In an early paper, Haller et al. (1972)
explored this idea in Brazil and confirmed that
job prestige perception differs greatly for rural
areas, especially in marginalized communities,
such as the provinces under study. The au-
thor suggests that to actually portray job pres-
tige in specific settings, one should study and
understand how they value different occupa-
tions. In this case, those with university de-
gree might be farmers because it’s more pres-
tigious. However, we find that implausible
given that the majority of farmers are those
with low or null education. Moreover, we find
that there is a percentage, although small, of
highly educated parents who are either occu-
pied in professional activities or are employ-
ers.
In order to resolve the problem of SES, we
will use three variables that will, theoreti-
cally speaking, capture some type of SES. To
start off, we recoded parent’s education into
three categories: low, middle and highly ed-
ucated. This variable is divided by father’s
and mother’s education since both parent’s
education might capture different things. Fa-
ther’s might be a more professional figure
since they’re almost always out in the field,
whereas mother’s education is likely to relate
to home inputs. The decision to group ed-
ucational degrees helped to assess the prob-
lem of children’s answer bias and we believe
it should diminish the chance of imprecision.
Following the work of Caro and Cortés (2012),
who managed to create a general index for the
PIRLS dataset, we created a material index us-
ing Principal Component Analysis (PCA) with
polychoric correlations. This index intends to
measure the amount of material things that
each child has in its household in order to cap-
ture at least some type of economic proxy. The
positive aspect of this proxy is that we believe
this estimate would be unbiased since children
know which material things they own. The
index encompasses the amount of cars, TV’s,
phones, washing machines and if the house
has gas and electricity. The PCA yielded an
eigenvalue of 3.96 for 2007 and 3.78 for 2009
with all factor loadings above 0.50 for both
years. Furthermore, to justify why different
variables should be estimated to capture the
complex SES found in the dataset, we com-
11
12. Master Thesis • July 2015 • University Pompeu Fabra
puted correlations between parents education
and the material index and found weak to no
correlations at all. Having higher educational
qualifications does not necessarily entail hav-
ing higher economic power in this specific set-
ting.
Lastly, to capture at least some of the impor-
tance of job prestige, we searched further for
differences between highly educated and oc-
cupations. We found that highly educated
parents had a higher share of workers as em-
ployers and professionals relative to low ed-
ucated. Highly educated women also had a
higher share of percentage working as employ-
ers and professionals. Although the differ-
ences between highly and lowly educated are
not that great, they are significant. The solu-
tion we adopted was to create dummies for
those two specific job occupations to at least
control between high and low prestige jobs.
The three variables are intended to cover three
aspects of the SES: education of the parents,
wealth of the household as measured as mate-
rial things and social prestige.
As for controls of the family environment,
we’ll use two variables. The first one is the
household structure, as living with both par-
ents could relate to having a higher persis-
tence level than living with only one of the
parents or with none. Or, it could be the
other way around, and those who live with
only one parent might be more motivated to
socially escalate upwards. The second one is
the books in the household as it is thought to
tell us something about the cultural capital of
the household (Esping-Andersen, 2008)
For child characteristics we will control for
two variables: a paid work index and gen-
der. For the work index we used PCA for
three variables that asked children the amount
of hours they dedicated to paid work in an
agricultural field, selling goods or household
chores for a different household. This vari-
able intends to capture time availability and
the possible negative effect4 of paid children’s
work on conscientiousness.
Lastly, it is also important to control for class-
room factors that might affect conscientious-
ness. In order to eliminate specific children
bias towards professors5 we calculated the
mean response for each grade in each school
for a battery of questions which evaluated the
relationship between teachers and the student.
As the calculation is made at the grade level,
then we expect to have an unbiased evalua-
tion of the professors. This variables goes
from 0 to 4 with 4 meaning there’s an excel-
lent relationship with professors6. Besides all
of these controls, I will also add dummies for
the four provinces under study since some de-
cision making, like coordination processes be-
tween schools and the government, and how
the accountability framework is organized, is
taken at the province level. These decisions
may affect our estimations as some provinces
might have better accountability than others
and child outcomes might be better. We there-
fore control for these geographical differences.
Another issue which needs to be addressed
is the listwise deletion that statistical models
perform. We have several control variables
which have a lot missing values. This means
that we will lose statistical power for our three
variables of interest (which don’t have any
missing values) and consequently lose schools
from the sample, given that the missings are a
big proportion of the total sample. The solu-
tion we adopted was that for every categorical
variable, we created a category for the missing
subjects, and for the continuous missings we
created a separate dummy that indicates if the
person is missing. This fixes the problem of
missing values and allows us to have the com-
plete sample of schools in the model.
4Paid work might be detrimental to some, but it might actually help other kids build more conscientiousness. It might
be that working boosts their responsibility and focus, depending on the job environment.
5Children might be having specific bias towards a professor but that does not mean the professor is a bad one. It could
mean that they’ve had a bad experience with them.
6See Table 7 in the appendix for all questions used.
12
13. Master Thesis • July 2015 • University Pompeu Fabra
IV. Methods
Our two dependent variables are continuous
variables, although math test scores needs
to be treated as discrete7. For the two vari-
ables, generalized linear models would be
enough to see the differences between treat-
ment and control while controlling for other
covariates. For the test score, a tobit model is
warranted to specify the censoring. To adjust
for non-independence of observations within
schools, we would use school fixed effects.
However, our school level variables, like the
treatment indicator, teacher indicator and in-
digenous indicator, will be excluded from the
model. A possible solution is to use multilevel
techniques with schools as the second level
variable to account for differences between
schools. The solution we took was to estimate
an ordinal logistic multilevel model. With
this technique we can successfully calculate
the probabilities of landing in a certain mark
while controlling for school differences.
For the survey response rate we have the same
issues with OLS, since fixed effects will omit
those level two variables. The solution we
adopted was to use a random intercept mul-
tilevel model with schools as the second level
variable. I will not emphasize on the between
or within school variance because I’m only in-
terested in the coefficients. I use multilevel to
keep into account non-independence of obser-
vations within schools.
The final model can be expressed as this:
Yim = β0 + β1Treatmentm + β2Indigenousm +
β3Treatmentm ∗ Indigenousm + β4SESim +
β5Cim + β6Sim + β7Teacherm + β9States + ϵ + δ
The subscripts denote students (i) nested
into schools (m). Treatment is an indicator for
the treatment group. Indigenous is a dummy
indicator for being an indigenous school. Beta
3 is the coefficient of an interaction between
the two. SES is a vector of variables that in-
clude: material Index, father and mother dum-
mies for their respective jobs and mother’s
and father’s educational level. C is a vector
of family environment controls which include
the amount of books in the household and
the household structure. S is another vector
of variables but they represent child character-
istics. The components inside this vector are
gender and the work index explained before.
The teacher variable represents the grade level
indicator of teachers for each class and, lastly,
States is a vector which contains the four dum-
mies representing each state. ϵ is an individ-
ual level random error term and δ is a level
two random error term.
V. Results
Table 3 shows the dependent variable survey
response rate with the inclusion of control
variables for year 2007 and 2009. We’ll be-
gin with the three models that belong to year
2007. Model 1 presents our three variables of
interest without any controls. Here we can
see that indigenous subjects have significantly
lower response rates than those who aren’t
indigenous. Treated subjects are no different
from control subjects, just as we expected, and
treated indigenous are no different than non-
treated indigenous, as the interaction between
the two is insignificant. In model 2, we in-
clude the SES controls and find that the indige-
nous coefficient actually decreased from -2.87
to -2.42 which suggests that some of the differ-
ence in response rate between indigenous and
general children was due to differences in SES.
Nevertheless, it is still significant.
7This variable should be used with caution because, although it is a continuous variable, it should be taken into
account that there’s a censoring in the bottom score since we only know that they got five or below.
13
15. Master Thesis • July 2015 • University Pompeu Fabra
The treatment indicator is still statistically
insignificant, which is what expect consider-
ing that the treatment and control groups are
to be homogeneous in the baseline. Just as in
Model 1, there is no statistically significant in-
teraction between the two. Finally, in model
3, we introduced all controls left and find that
the indigenous coefficient decreased and main-
tained its significance. Treatment is still in-
significant as well as the interaction term.
Results so far are in line with what we
would’ve expected. Treated and control units
are not statistically different in response rates.
Indigenous children have lower response rates
than non-indigenous children but it is the
same for those in the treatment and control
group. However, we’ll now move on to the
2009 wave and, if the program did have an
impact, then we should find some differences
between the groups.
Model 1 for the 2009 wave is presented with-
out controls. Here we find that those in the
treatment group are no different than those
from the control group. Nonetheless, it’s im-
portant to note that the coefficient actually
changed from negative in 2007 to positive in
2009. However, we have a big sample size and
despite that, it proves to be insignificant. The
indigenous indicator is also insignificant and
it is still negative like in 2007. However, it
is much lower than in 2007. In addition, the
insignificance can be seen as a positive thing
as we can conclude that indigenous and non-
indigenous are not significantly different any
more.
Model 2 for 2009 continues to show the same
results we get for Model 1, even after introduc-
ing SES controls. In model 3 we introduced all
controls left and we got different results. All
results are still insignificant but the coefficient
for treatment turned negative, which would
result in treated units having actually less re-
sponse rates than those in the control. It is
important to remember that response rate is a
proxy of conscientiousness, so this would ac-
tually reflect less perseverance and focus for
the treatment group. What we can conclude
so far, is that there isn’t any impact from the
program on conscientiousness on the treated,
not even on different scenarios with different
control variables. Furthermore, treated indige-
nous did not benefit more than non-treated
indigenous as the interaction term between
indigenous and treatment is always insignifi-
cant.
For the ordinal logistic multilevel model, we
estimated the probabilities of getting a certain
grade for treatment and control groups. Here
we won’t present the output of the multilevel
analysis, instead, we’ll present tables with the
probabilities. These probabilities are adjusted
for all the control variables we’ve mentioned
before.
Table 4 presents the probabilities of getting a
certain grade for treatment and control groups.
Both groups have virtually the same probabili-
ties of landing on a certain category. For exam-
ple, for the 5 or less category, they both have
a probability of 3%. On the 6th category, con-
trol group has a probability of 13% whereas
treated units have a probability of 12%. For
the remaining categories differences are also
very small.
Table 5 shows the probabilities of obtaining a
certain grade disentangled by the indigenous
indicator. Similar to the treatment indicator,
the probabilities between general and indige-
nous differ, although slightly. For the 5 or
less category, both groups have a probability
of 3%. For the 6 and 7 marks, the groups differ
Table 4: Probabilities of getting a certain mark by treatment indicator
5 or less 6 7 8 9 10
Control 0.034 0.131 0.248 0.314 0.180 0.092
Treatment 0.030 0.121 0.236 0.317 0.192 0.102
15
16. Master Thesis • July 2015 • University Pompeu Fabra
Table 5: Probabilities of getting a certain mark by indigenous and non-indigenous
5 or less 6 7 8 9 10
General 0.031 0.122 0.238 0.316 0.190 0.100
Indigenous 0.033 0.131 0.246 0.314 0.181 0.093
by a probability of 1% with indigenous having
higher probabilities of obtaining either a 6 or
7. The results are consistent for the remaining
categories and thus differences continue to be
small.
Lastly, we’ll see the probabilities of getting a
certain grade disentangled by the treatment in-
dicator and the indigenous indicator in table 6.
This is basically analogous to the interaction
term that we’ve used before.
First, the general schooling. For those units
in general schools, we find that the treatment
group has higher probabilities of getting either
a 5 or less, a 6 and 7. Nonetheless, the differ-
ences are small (between 1% and 2%). Then
for the probabilities of getting an 8, a 9 or
a 10, those in the control group have higher
chances than the treated; the differences here
are bigger, with differences of 3%. This trend
is, however, insignificant. For the indigenous,
the probabilities seem to be exactly the same
between treated and controls with some excep-
tions which are insignificant. From these re-
sults, we can conclude that treated units and
treated indigenous did not benefit more than
their comparable counterparts in the control
group.
The results we’ve seen so far show some evi-
dence of the ineffectiveness of SBM in two out-
comes: response rates and math test score. We
find that the treatment did not increase consci-
entiousness neither on the treated, indigenous
or treated indigenous. Furthermore, we find
that the differences in probabilities of getting
a certain mark for the treated, indigenous and
treated indigenous are quite small and don’t
show an improvement for those under treat-
ment. These results add further evidence to
the mixed effectiveness of SBM on student test
scores and provides new evidence on its inef-
fectiveness on conscientiousness.
VI. Conclusions
The present study focuses on the impor-
tance of non-cognitive and cognitive skills in
a World Bank policy that aims to increase
parental involvement in school’s decision mak-
ing. To our knowledge, no other study that
evaluates this type of policy has concentrated
on its influence on non-cognitive skills.
First, using the 2007 baseline survey, which
contained 8,723 students, and the 2009 survey,
which contained 7,311 students, we estimated
the effect of the policy on survey response
rates. We find that differences between treated
students and non-treated students are negligi-
ble in the first baseline survey, which was ex-
pected, but it continues to be insignificant in
the 2009 survey. Although it shouldn’t mat-
ter because of the randomized design, these
results hold even after including several sets
of control variables which look to make the
estimates more precise. We also found that in-
Table 6: Probabilities of getting a certain mark by treatment indicator and indigenous indicator
General Indigenous
5 or less 6 7 8 9 10 5 or less 6 7 8 9 10
Treatment 0.034 0.132 0.248 0.314 0.179 0.091 0.033 0.129 0.244 0.314 0.182 0.094
Control 0.028 0.111 0.225 0.320 0.203 0.111 0.034 0.131 0.247 0.314 0.180 0.092
16
17. Master Thesis • July 2015 • University Pompeu Fabra
digenous students had significantly lower re-
sponse rates than non-indigenous, which was
expected since they are considered the disad-
vantaged population here. In 2009, the results
for the indigenous were still negative but in-
significant. This suggests that they are not
significantly different from non-indigenous as
they were before. However, the interaction
term between indigenous and treatment is not
significant, so indigenous in the treatment are
no different from those in the control; it could
well be that indigenous are becoming more fo-
cused and persistent for other reasons, such
as more inclusion into school related activi-
ties and more peer acceptance8. Secondly, for
math test scores the results show no marked
differences between treated and non-treated.
Furthermore, we found that the indigenous
population and the indigenous in the treat-
ment had the same probabilities of getting cer-
tain grades as their comparable counterparts.
By and large, these findings show robust ev-
idence of the failure of school-based manage-
ment concerning non-cognitive and cognitive
abilities.
The results from this article are in line
with the findings by de Barros and Mendonca
(1998) as they also show that SBM had no im-
pact on test scores. Moreover, we relate the
failure of the program to what Jimenez and
Sawada (1999) defined as the success of El Sal-
vador’s EDUCO SBM: high degree of parental
involvement. The authors attributed the big
success of the program to the dramatic inclu-
sion of parents into the program. For our case,
results by Gertler et al. (2012) exemplify that
the program being studied did not have a dra-
matic involvement of parents, as there weren’t
significantly higher parent-teacher meetings
and council meetings. On another hand, we
find reliability in the newly developed consci-
entiousness proxy(Hitt and Trivitt, 2013) and
find that the program had no effect on it what-
soever. We are confident our results have a
valid claim given that Gertler et al. (2012) char-
acterize this randomized design as the best op-
portunity so far to estimate the causal effect of
SBM.
However, our study has some limitations. As
we don’t have panel data, and our sample size
differs per waves, we can’t make a definitive
causal claim at the individual level. Further-
more, our results are built on responses by
children which may increase measurement er-
ror, specially in control variables such as the
SES.
Further research should concentrate on vali-
dating this new non-cognitive proxy and ap-
plying it to other SBM evaluations. The ad-
vantaged of this indicator lays in the fact that
it can be calculated in virtually all surveys, so
it lends it self to be useful in old as well as new
evaluations. Furthermore, researchers should
focus on the direct impact of educating par-
ents as a means of improving cognitive and
non-cognitive skills.
Receiving a good education at home is one
of the most important assets a child can have.
Concentrating on improving the education of
parents should be an imperative topic in pol-
icy makers agenda. This research paper finds
that parental involvement in school decisions
did not help children improve math grades
and be more conscientious. We urge educa-
tional reformers to take a new look at this type
of policy and make parents more capable of
giving their children the support they deserve.
References
Almlund, M., A. L. Duckworth, J. J. Heckman,
and T. D. Kautz (2011). Personality psychol-
ogy and economics. Technical report, Na-
tional Bureau of Economic Research.
Anderson, S. E. (2002). Improving schools
through teacher development: Case studies of the
Aga Khan Foundation Projects in East Africa.
CRC Press.
Becker, G. S., W. H. Hubbard, and K. M. Mur-
phy (2010). Explaining the worldwide boom
8In fact, one of the goals of the Mexican government for the last 10 years is to incorporate the indigenous population
into the development of Mexico(Shapiro and Trevino, 2004)
17
18. Master Thesis • July 2015 • University Pompeu Fabra
in higher education of women. Journal of Hu-
man Capital 4(3), 203–241.
Bruns, B., D. Filmer, and H. A. Patrinos (2011).
Making schools work: New evidence on account-
ability reforms. World Bank Publications.
Campbell, F. A., B. H. Wasik, E. Pungello,
M. Burchinal, O. Barbarin, K. Kainz, J. J.
Sparling, and C. T. Ramey (2008). Young
adult outcomes of the abecedarian and care
early childhood educational interventions.
Early Childhood Research Quarterly 23(4), 452–
466.
Caro, D. H. and D. Cortés (2012). Measuring
family socioeconomic status: An illustration
using data from pirls 2006. IERI Monograph
Series. Issues and Methodologies in Large-Scale
Assessments 5, 9–33.
Cunha, F. and J. Heckman (2007). The tech-
nology of skill formation. Technical report,
National Bureau of Economic Research.
Cunha, F., J. J. Heckman, and S. M. Schennach
(2010). Estimating the technology of cogni-
tive and noncognitive skill formation. Econo-
metrica 78(3), 883–931.
Currie, J. (2001). Early childhood education
programs. Journal of Economic perspectives,
213–238.
de Barros, R. P. and R. Mendonca (1998). The
impact of three institutional innovations in
brazilian education. Organization matters:
Agency problems in health and education in
Latin America, 75.
Di Gropello, E. (2006). A comparative analysis
of school-based management in Central America.
Number 72. World Bank Publications.
Erikson, R. and J. H. Goldthorpe (1992). The
constant flux: A study of class mobility in indus-
trial societies. Oxford University Press, USA.
Esping-Andersen, G. (2008). Childhood invest-
ments and skill formation. International Tax
and Public Finance 15(1), 19–44.
Fullan, M. and N. Watson (2000). School-
based management: Reconceptualizing to
improve learning outcomes. School effective-
ness and school improvement 11(4), 453–473.
Gertler, P., H. A. Patrinos, and E. Rodríguez-
Oreggia (2012). Parental empowerment in
mexico: Randomized experiment of the
apoyos a la gestion escolar (age) in rural pri-
mary schools in mexico. Washington, DC:
The World Bank.
Haller, A. O., D. B. Holsinger, and H. U.
Saraiva (1972). Variations in occupational
prestige hierarchies: Brazilian data. Ameri-
can Journal of Sociology, 941–956.
Hanushek, E. A. and L. Wößmann (2007).
The role of education quality for economic
growth. World Bank Policy Research Working
Paper (4122).
Harris, D. N. and T. R. Sass (2011).
Teacher training, teacher quality and stu-
dent achievement. Journal of public eco-
nomics 95(7), 798–812.
Heckman, J. J. (2008). Schools, skills, and
synapses. Economic inquiry 46(3), 289–324.
Heckman, J. J. (2013). Giving kids a fair chance.
Mit Press.
Heckman, J. J., A. B. Krueger, and B. Friedman
(2004). Inequality in America. Mit Press Cam-
bridge, MA.
Heckman, J. J. and Y. Rubinstein (2001). The
importance of noncognitive skills: Lessons
from the ged testing program. American Eco-
nomic Review, 145–149.
Hedengren, D. and T. Stratmann (2012). The
dog that didn’t bark: What item nonre-
sponse shows about cognitive and non-
cognitive ability. Available at SSRN 2194373.
Hitt, C. and J. R. Trivitt (2013). Dont know? or
dont care? Technical report, EDRE Working
Paper.
18
19. Master Thesis • July 2015 • University Pompeu Fabra
Jimenez, E. and Y. Sawada (1999). Do
community-managed schools work? an
evaluation of el salvador’s educo program.
The world bank economic review 13(3), 415–441.
Kautz, T., J. J. Heckman, R. Diris, B. Ter Weel,
and L. Borghans (2014). Fostering and mea-
suring skills: Improving cognitive and non-
cognitive skills to promote lifetime success.
Technical report, National Bureau of Eco-
nomic Research.
King, E. M. and S. C. Guerra (2005). Education
reforms in east asia: Policy, process, and im-
pact. East Asia decentralizes: Making local gov-
ernment work 292, 179.
King, E. M. and B. Ozler (2005). Whats decen-
tralization got to do with learning? school
autonomy and student performance’. Kyoto
University: Interfaces for Advanced Economic
Analysis. DP 54, 51–60.
Leithwood, K. and T. Menzies (1998). Forms
and effects of school-based management: A
review. Educational policy 12(3), 325–346.
Lopez-Acevedo, G. and V. Paqueo (2003).
Supply-side school improvement and the
learning achievement of the poorest chil-
dren in indigenous and rural schools: the
case of pare. World Bank Policy Research
Working Paper (3172).
Ludwig, J. and D. L. Miller (2005). Does head
start improve children’s life chances? ev-
idence from a regression discontinuity de-
sign. Technical report, National Bureau of
Economic Research.
Mayer, S. E. (1997). What money can’t buy: Fam-
ily income and children’s life chances. Harvard
University Press.
OECD (2013). Strong Performers and Success-
ful Reformers in Education Lessons from PISA
2012 for the United States. OECD Publishing.
Pasi Sahlberg (2007). Education policies for
raising student learning: The finnish ap-
proach. Journal of Education Policy 22(2), 147–
171.
Patrinos, H. A. and T. Fasih (2009). Decentral-
ized decision-making in schools: The theory and
evidence on school-based management. World
Bank Publications.
Reid, M. J., C. Webster-Stratton, and T. P.
Beauchaine (2001). Parent training in head
start: A comparison of program response
among african american, asian american,
caucasian, and hispanic mothers. Prevention
Science 2(4), 209–227.
Sahlberg, P. (2007). Education policies for rais-
ing student learning: The finnish approach.
Journal of Education Policy 22(2), 147–171.
Schweinhart, L. J. and D. P. Weikart (1981).
Effects of the perry preschool program on
youths through age 15. Journal of Early Inter-
vention 4(1), 29–39.
Shapiro, J. and J. M. Trevino (2004). Compen-
satory education for disadvantaged Mexican stu-
dents: An impact evaluation using propensity
score matching, Volume 3334. World Bank
Publications.
Taylor, D. L. and C. Teddlie (1992). Restruc-
turing and the classroom: A view from a
reform district.
19
20. Master Thesis • July 2015 • University Pompeu Fabra
VII. Appendix
Table 7: Questions that compose the teacher indicator
Do your teachers worry about you
and your classmates feeling comfortable?
No Sometimes Yes(always)
Do your teachers solve your doubts in class? No Sometimes Yes(always)
Do your teachers listen to what you say? No Sometimes Yes(always)
Do your teachers always go to class? No Sometimes Yes(always)
Do your teachers start and finish class
on time?
No Sometimes Yes(always)
Do your teachers treat you justly? No Sometimes Yes(always)
Do your teachers explain the classes clearly? No Sometimes Yes(always)
Do your teachers make you copy the class
without explaining it?
No Sometimes Yes(always)
Do your teachers give you exercises and
homework to do?
No Sometimes Yes(always)
Do your teachers revise and explain the
exercises and homework in class?
No Sometimes Yes(always)
Are your teachers strict? No Sometimes Yes(always)
Are your teachers strict in class? No Sometimes Yes(always)
Do your teachers meet your parents to talk
about class performance and behaviour?
No Sometimes Yes(always)
Do your teachers support you to keep
studying?
No Sometimes Yes(always)
Do your teachers give you confidence that
you can learn whatever you want?
No Sometimes Yes(always)
Do your teachers worry about what happens
to students who miss class?
No Sometimes Yes(always)
20