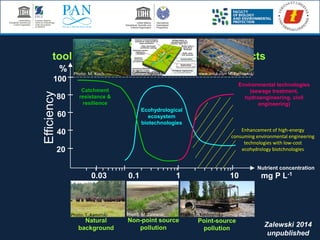
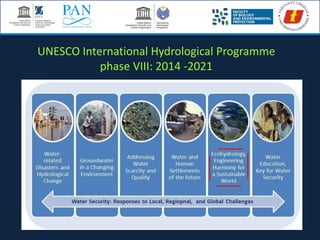
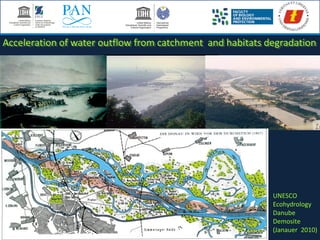
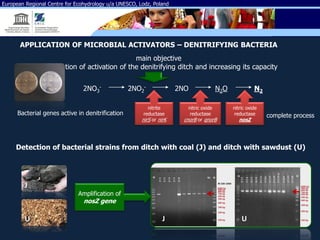
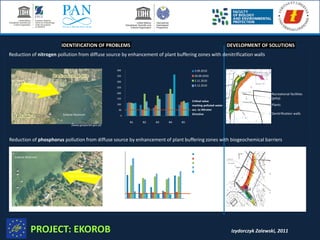
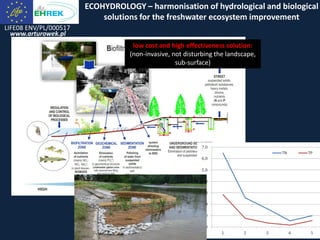
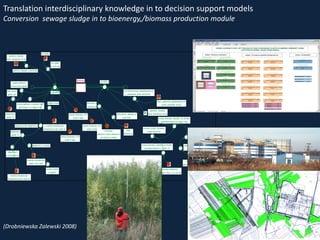
This document discusses methods for limiting eutrophication in river systems and reservoirs. It begins by noting how human activities have accelerated water outflow from catchments and degraded habitats. This reduces ecosystem productivity, resilience, and increases nutrient loads. The document then presents ecohydrological concepts and the deductive background of the theory. It discusses dual regulation of biota and hydrology and shows examples of constructed ecosystems. It also summarizes experiments on quantifying flood processes and sedimentation. Finally, it discusses the development and implementation of solutions like denitrification walls and biogeochemical barriers to reduce nutrient pollution from agricultural and recreational areas.
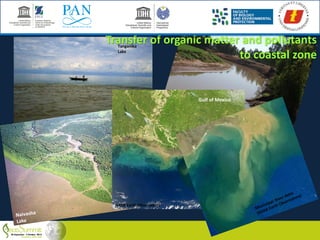
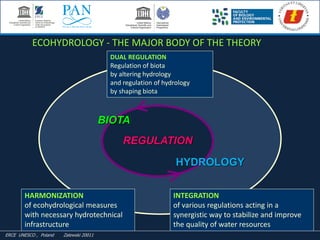
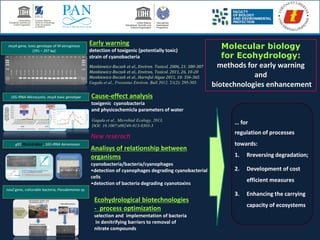
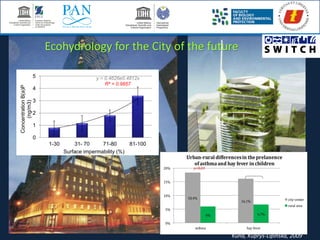
![Ecohydrological – Process - oriented thinking
Modification of water cycle due to
- Deforestation
- Unification of agricultural
landscape
- Stream channelization
- Impermeable urbanised space
- Storm water and drainage systems
Catchment’s deforestation in Ethiopia Climate change Warta River Poland
Annualevaporation[mm]
D – atmospheric water vapour deficit [hPa]
V – wind speed [ms-1]
R – solar radiation balance [Wm-2]
M = D*V*R/100
- Stream channelization
- Impermeable urbanised space
- Storm water and drainage systems
TerrestrialphaseAcquaticphase
Drying air
Drying air
Drying land
Drying river
Kędziora 2012-2014
Drought area (%) in central Poland
Meanannualdischarge[m3s-1]
WartaRiver](https://image.slidesharecdn.com/m-150817110139-lva1-app6892/85/M-zalewski-lublin-2015-final-7-320.jpg)
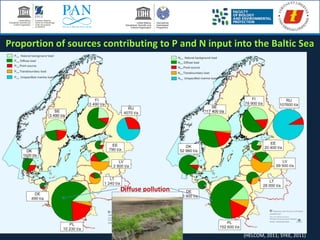
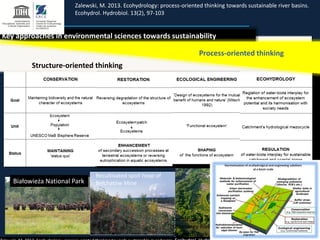
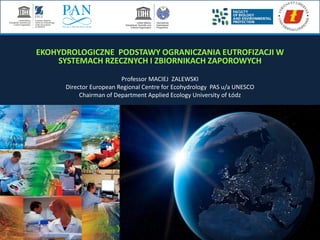
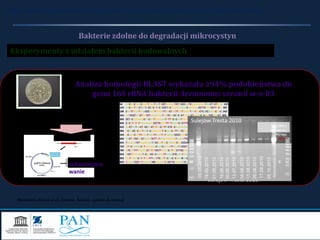
![FLOOD PROCESSES IN THE PILICA FLOODPLAIN
Digital
Terrain
Model
Quantification of flood sedimentation on the experimental floodplain
MASS OF FLOOD
SEDIMENTS
(1+2)
MASS OF
PLANTS
COMPONENT
(1)
MASS OF FINE-
GRAIN FLOOD
SEDIMENTS
(2)
PHOSPHORUS CONTENT IN
FINE-GRAIN FLOOD
SEDIMENTS
[g m-2] [g m-2] [g m-2] [mg P g s.m.
osadu-1]
[mg P m-2]
153,1 68,3 84,8 3,3 202,9
Sedimen
-tation
Kiedrzyńska E., Kiedrzyński M., Zalewski M., 2008. Ecohydrology & Hydrobiology, Vol. 8, No 2-4, 281-289.](https://image.slidesharecdn.com/m-150817110139-lva1-app6892/85/M-zalewski-lublin-2015-final-13-320.jpg)
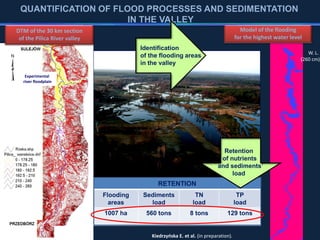
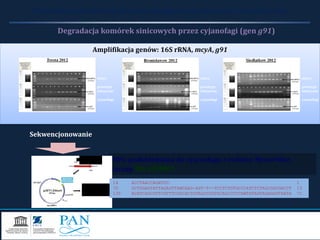
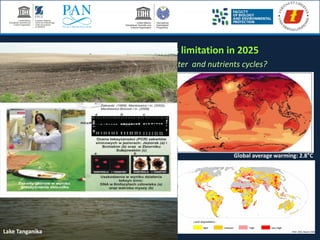
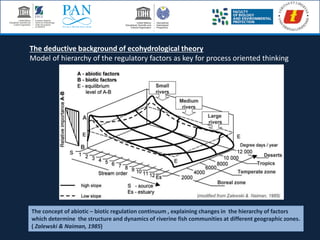
![European Regional Centre for Ecohydrology u/a UNESCO, Lodz, Poland
Biogeochemical limestone-based barriers
to enhance phosphorus reduction in buffer zone
(Izydorczyk et al. Ecohydrology & Hydrobiology 2013)
Phosphate
concentration
ingroundwater
[mgPO4/l]
przed za
0
2
4
6
8
10
12
14
Upstream
of barrier
Downstream
of barrier](https://image.slidesharecdn.com/m-150817110139-lva1-app6892/85/M-zalewski-lublin-2015-final-22-320.jpg)
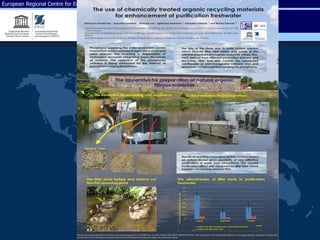
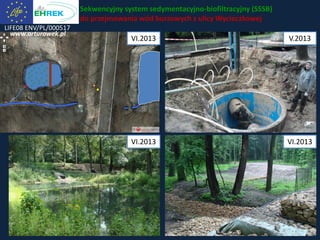
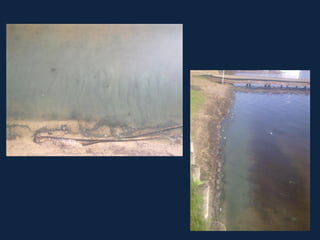
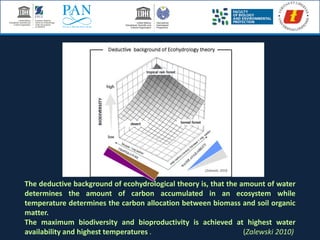
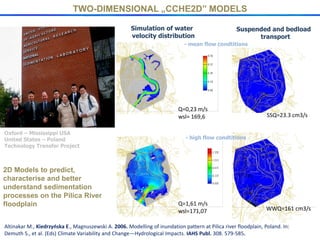
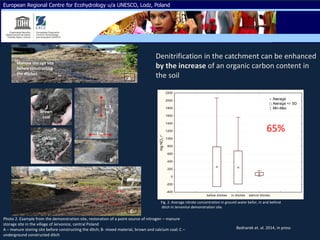
![Use of biodegradable geofibers for erosion controll
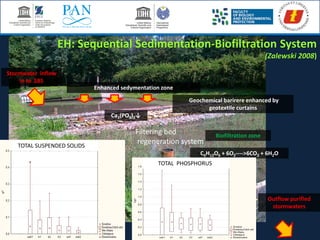
Construction of the sequentional biofiltration system for turbidity,
eutrophication and dioxin toxicity reduction in the Asella BioFarm
Park lake
Dioxin toxicity reduction in
the Asella
BioFarm Park lake
Use of sediments for
bioenergy production
Sedimentation
Stock watering site and use of manure collected at the site
as a fertilizer
Before After
0
0,5
1
1,5
2
2,5
Sediment trap Biofiter Lake
toxicity[ngTEQ/kgd.w.]
0
0,5
1
1,5
2
2,5
Inflow Lake Otflow
Toxicity[ngTEQ/kgd.w.]
toxicity limit ccording to
SQG
Zalewski, Urbaniak, Negussie 2013
The implementation of the ecohydrology
methods and systemic solutions
for reduction of sedimentation,
eutophication
and dioxin-induced toxicity
in the Asalla BioFarm
Park lake
ETHIOPIA](https://image.slidesharecdn.com/m-150817110139-lva1-app6892/85/M-zalewski-lublin-2015-final-33-320.jpg)