Download as PDF, PPTX


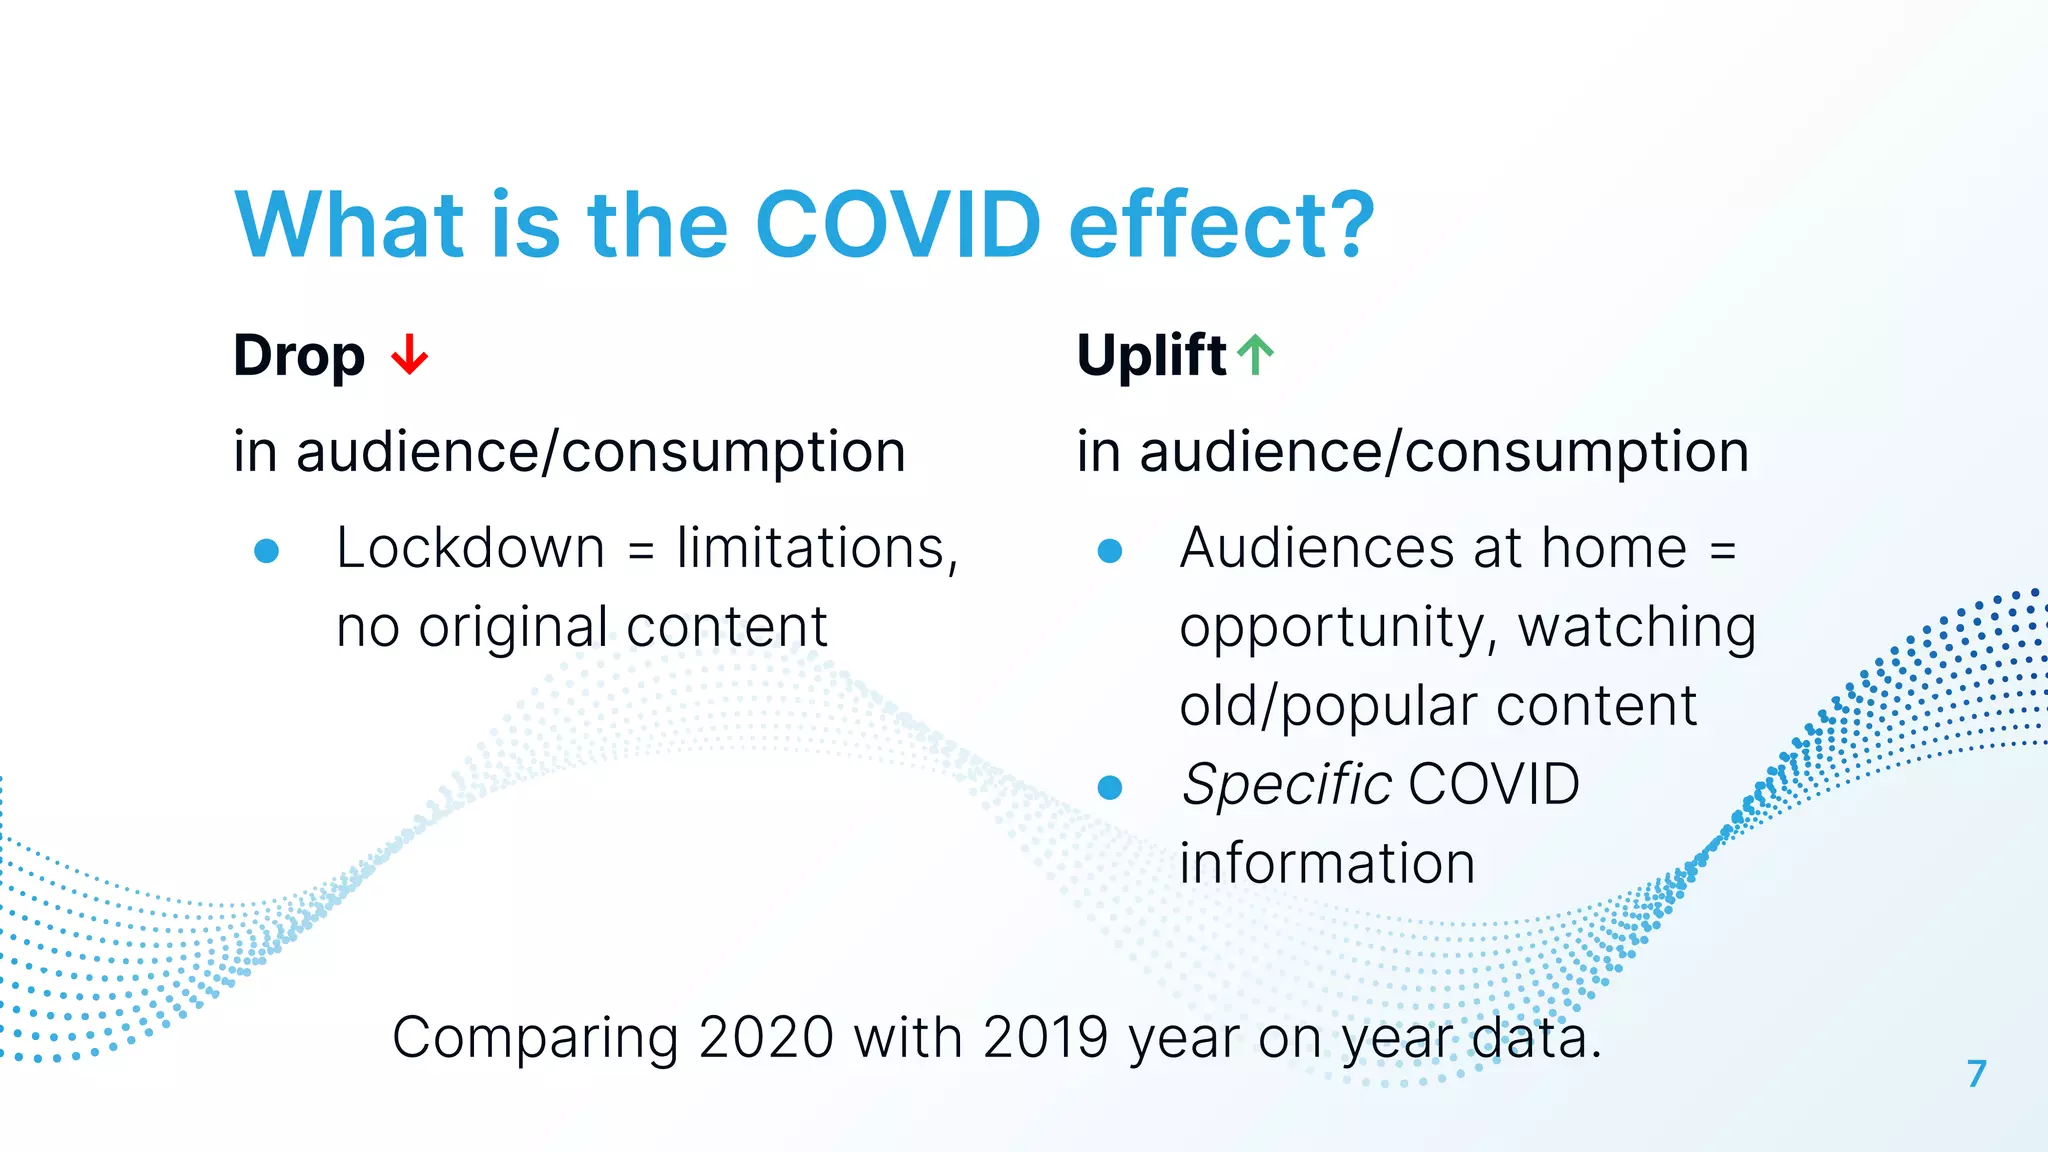


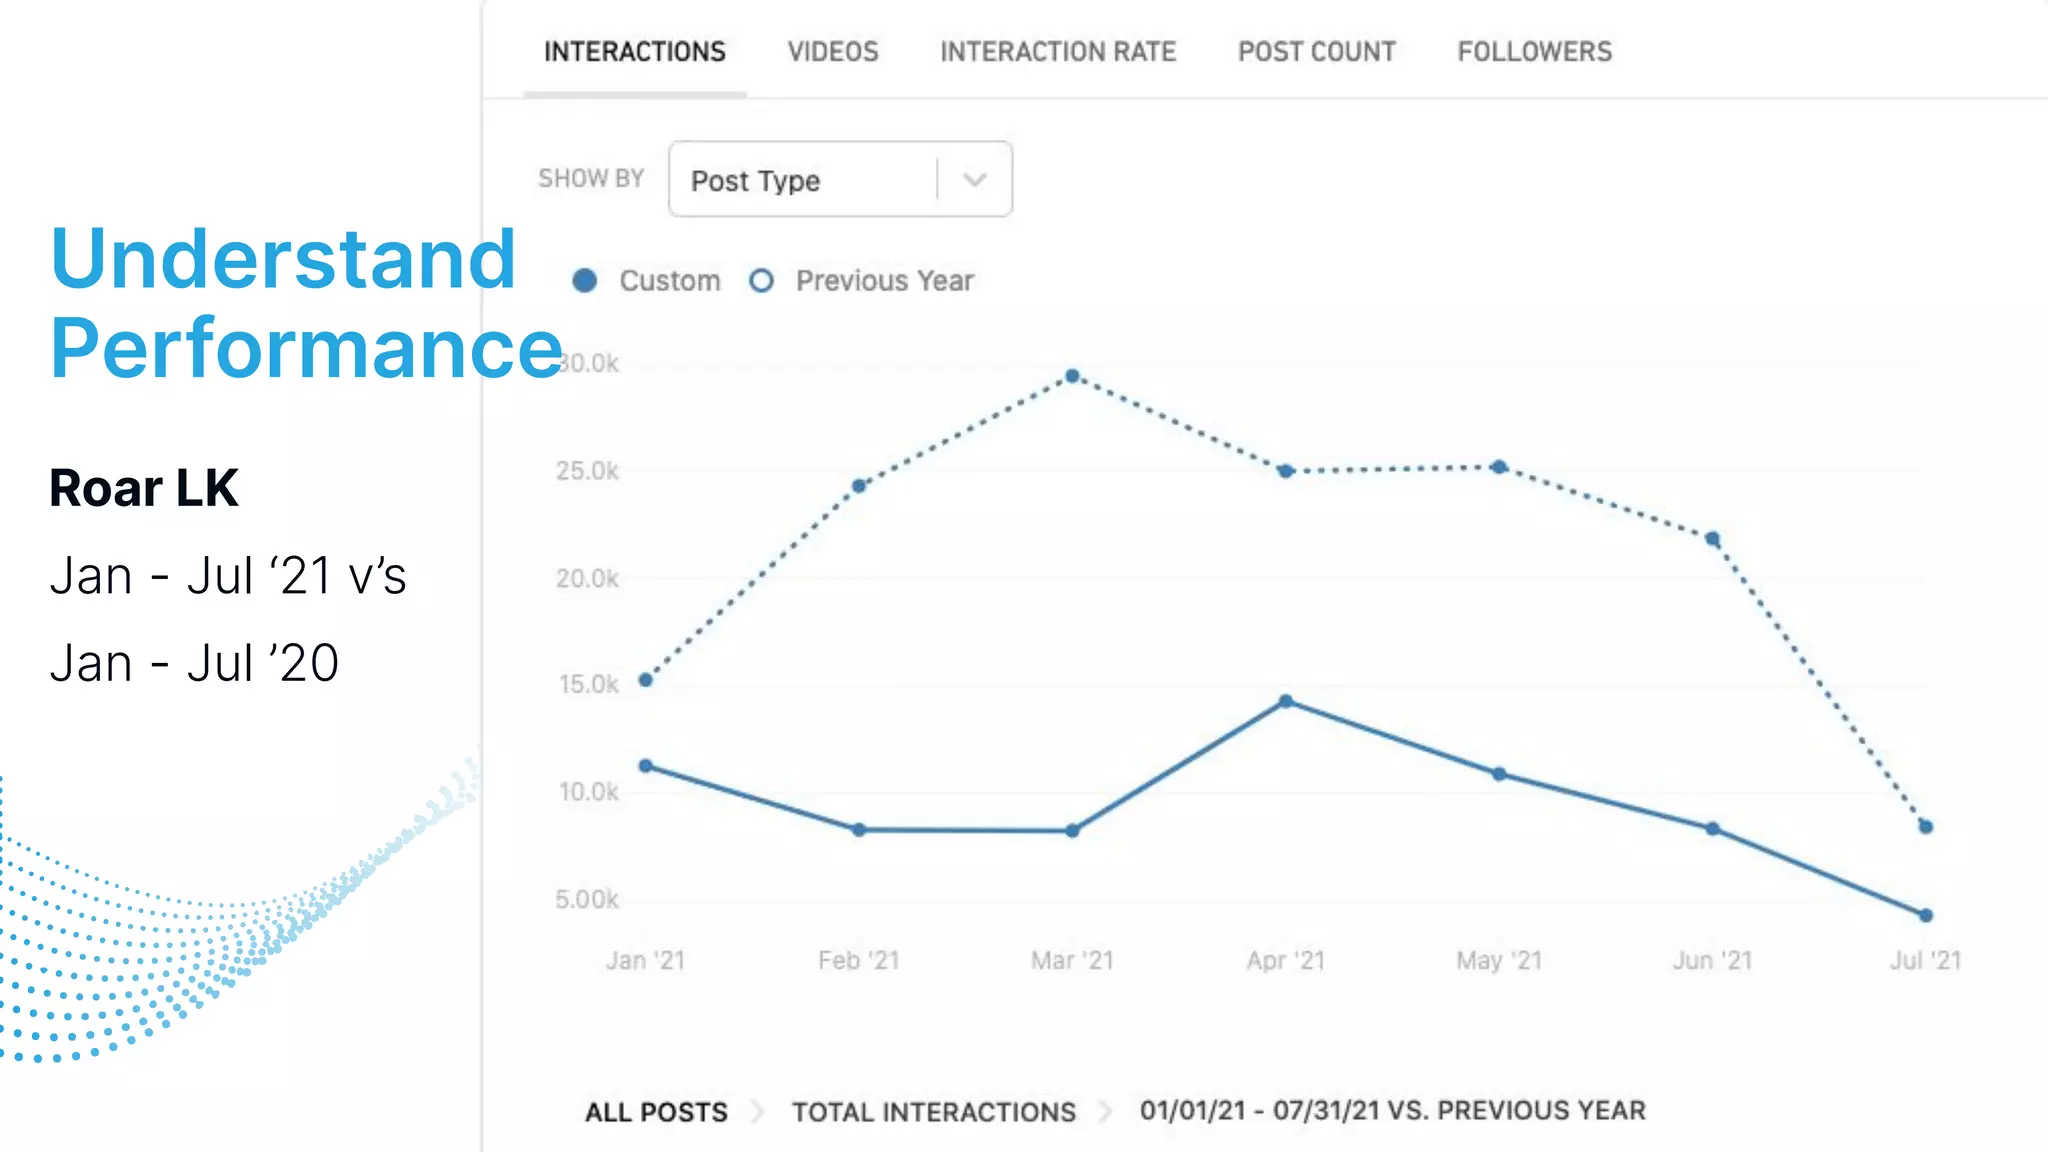
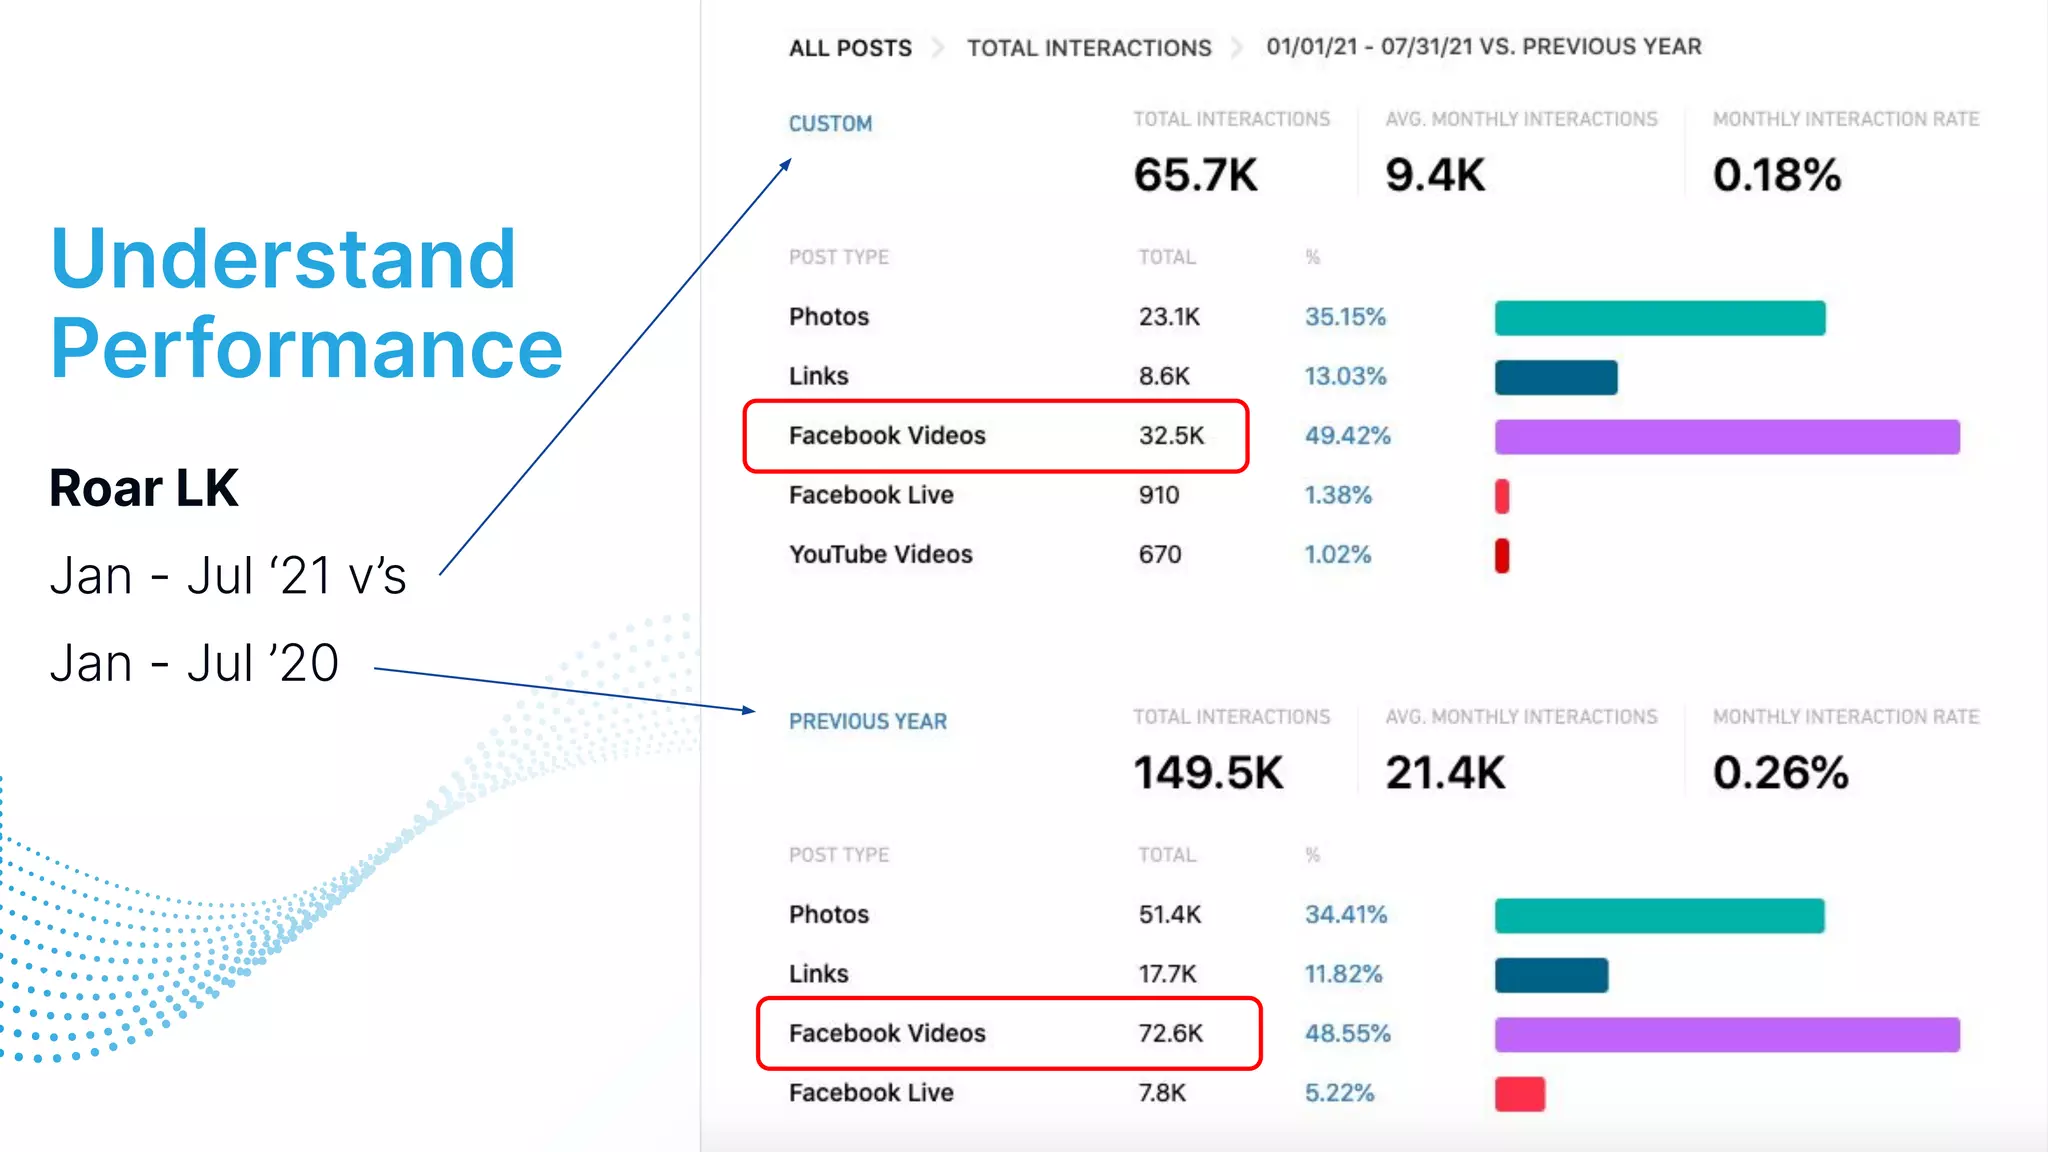


The document discusses digital strategy in the context of the COVID-19 pandemic, analyzing audience engagement metrics and consumption trends across platforms like Facebook, Instagram, and YouTube. It highlights the impact of lockdowns on content creation and audience behavior, while proposing actionable goals for increasing followers and interaction rates. The presenter shares recommendations for content strategy, including publishing frequency and types of posts to enhance engagement.


