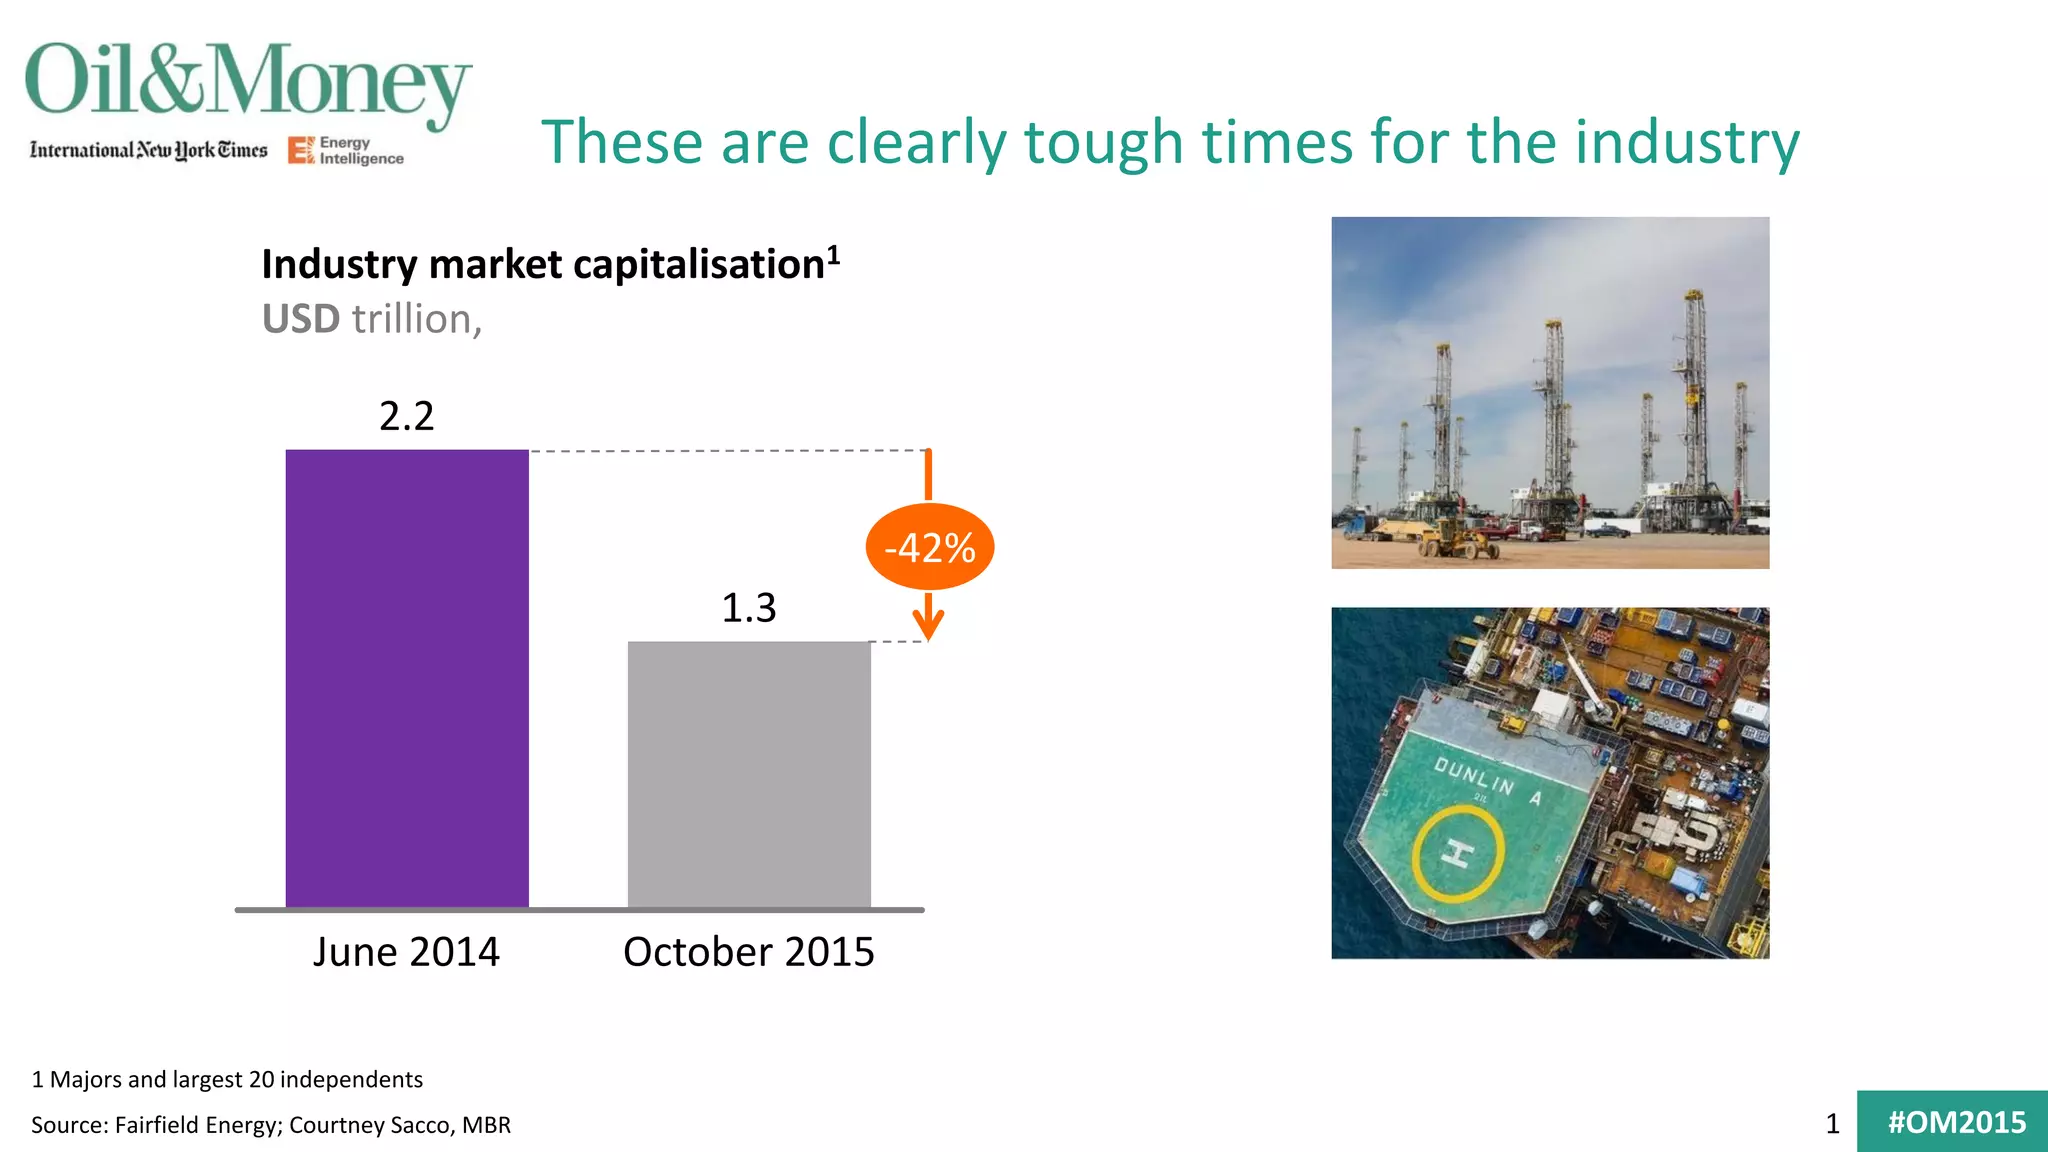
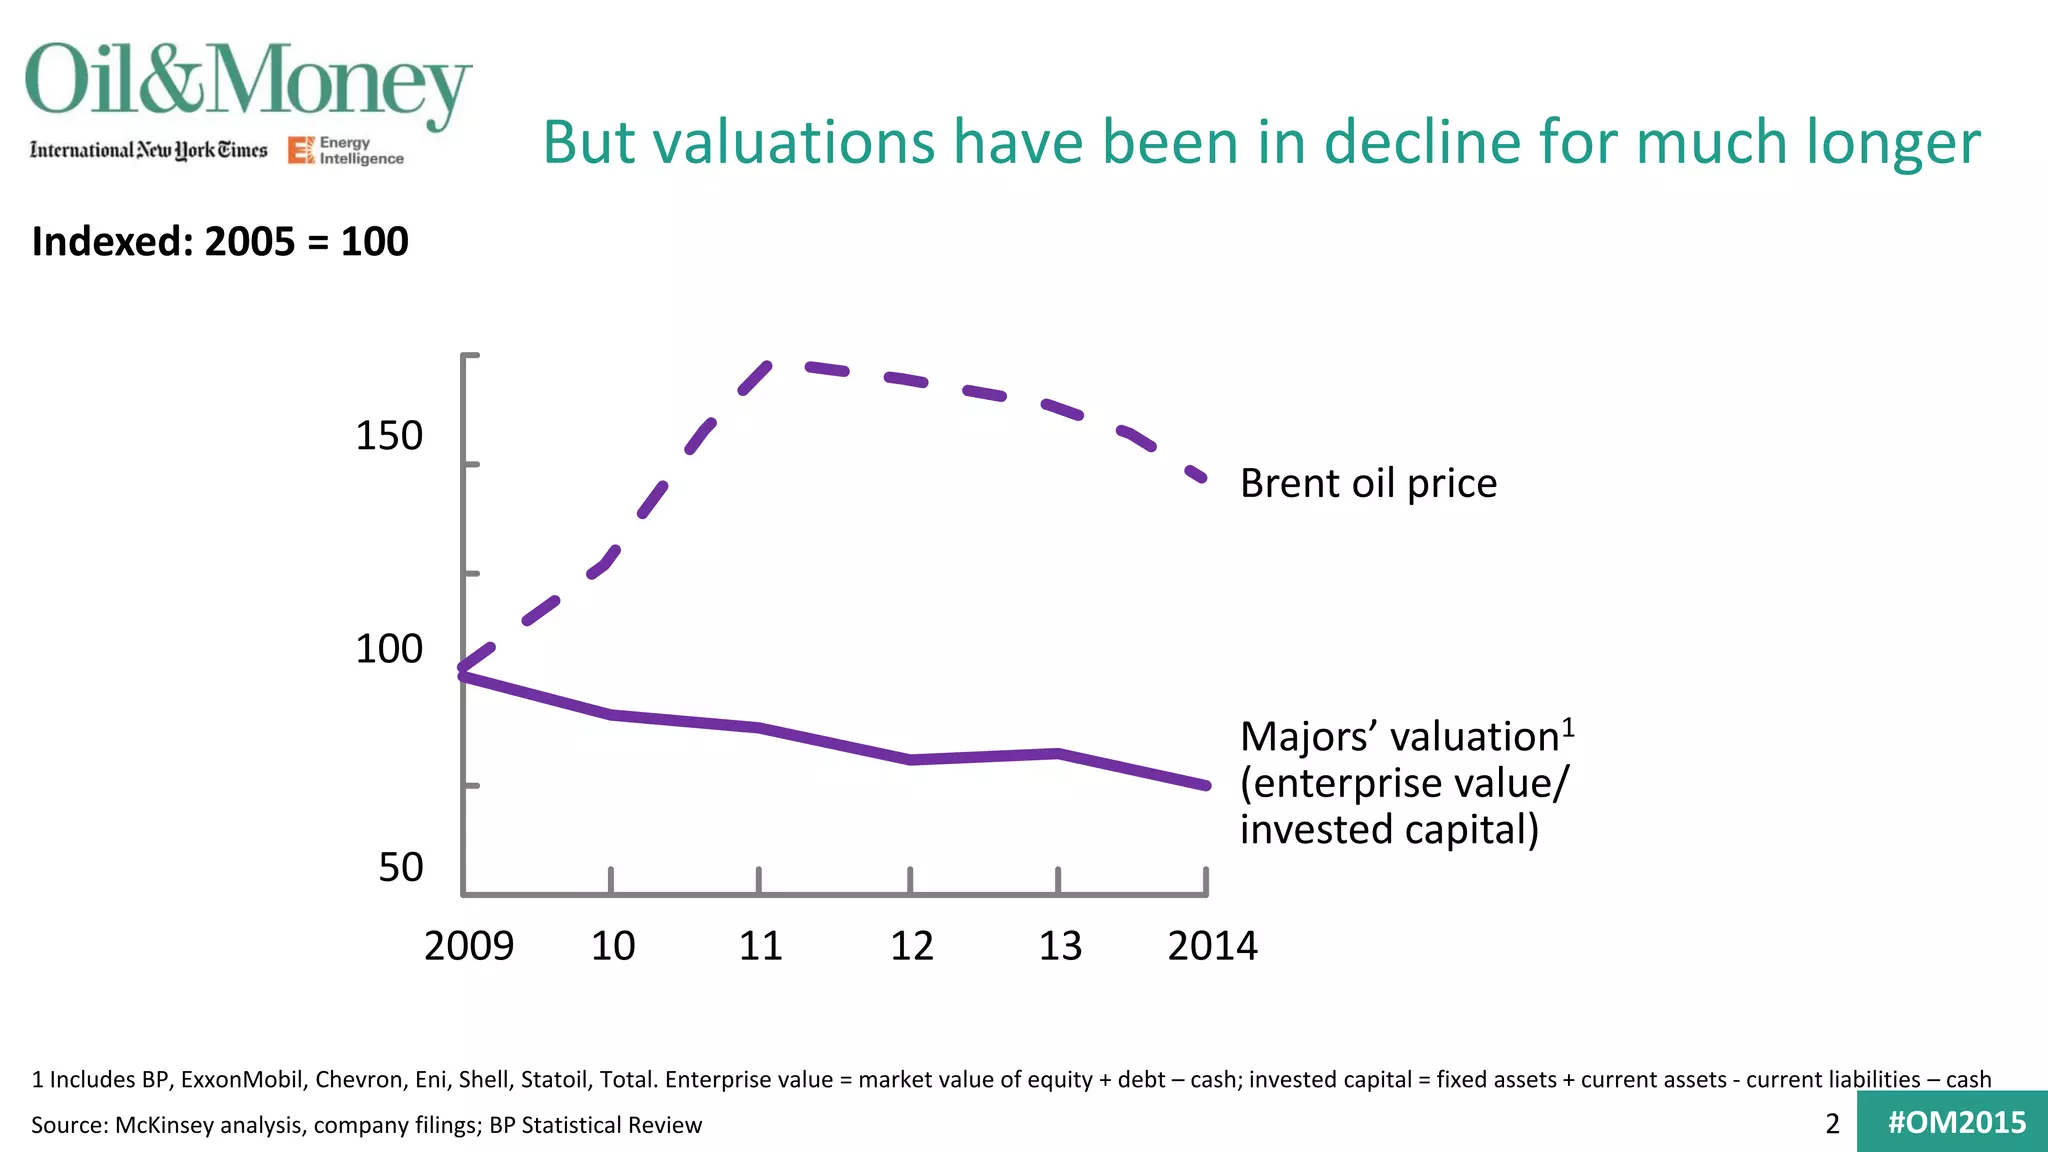
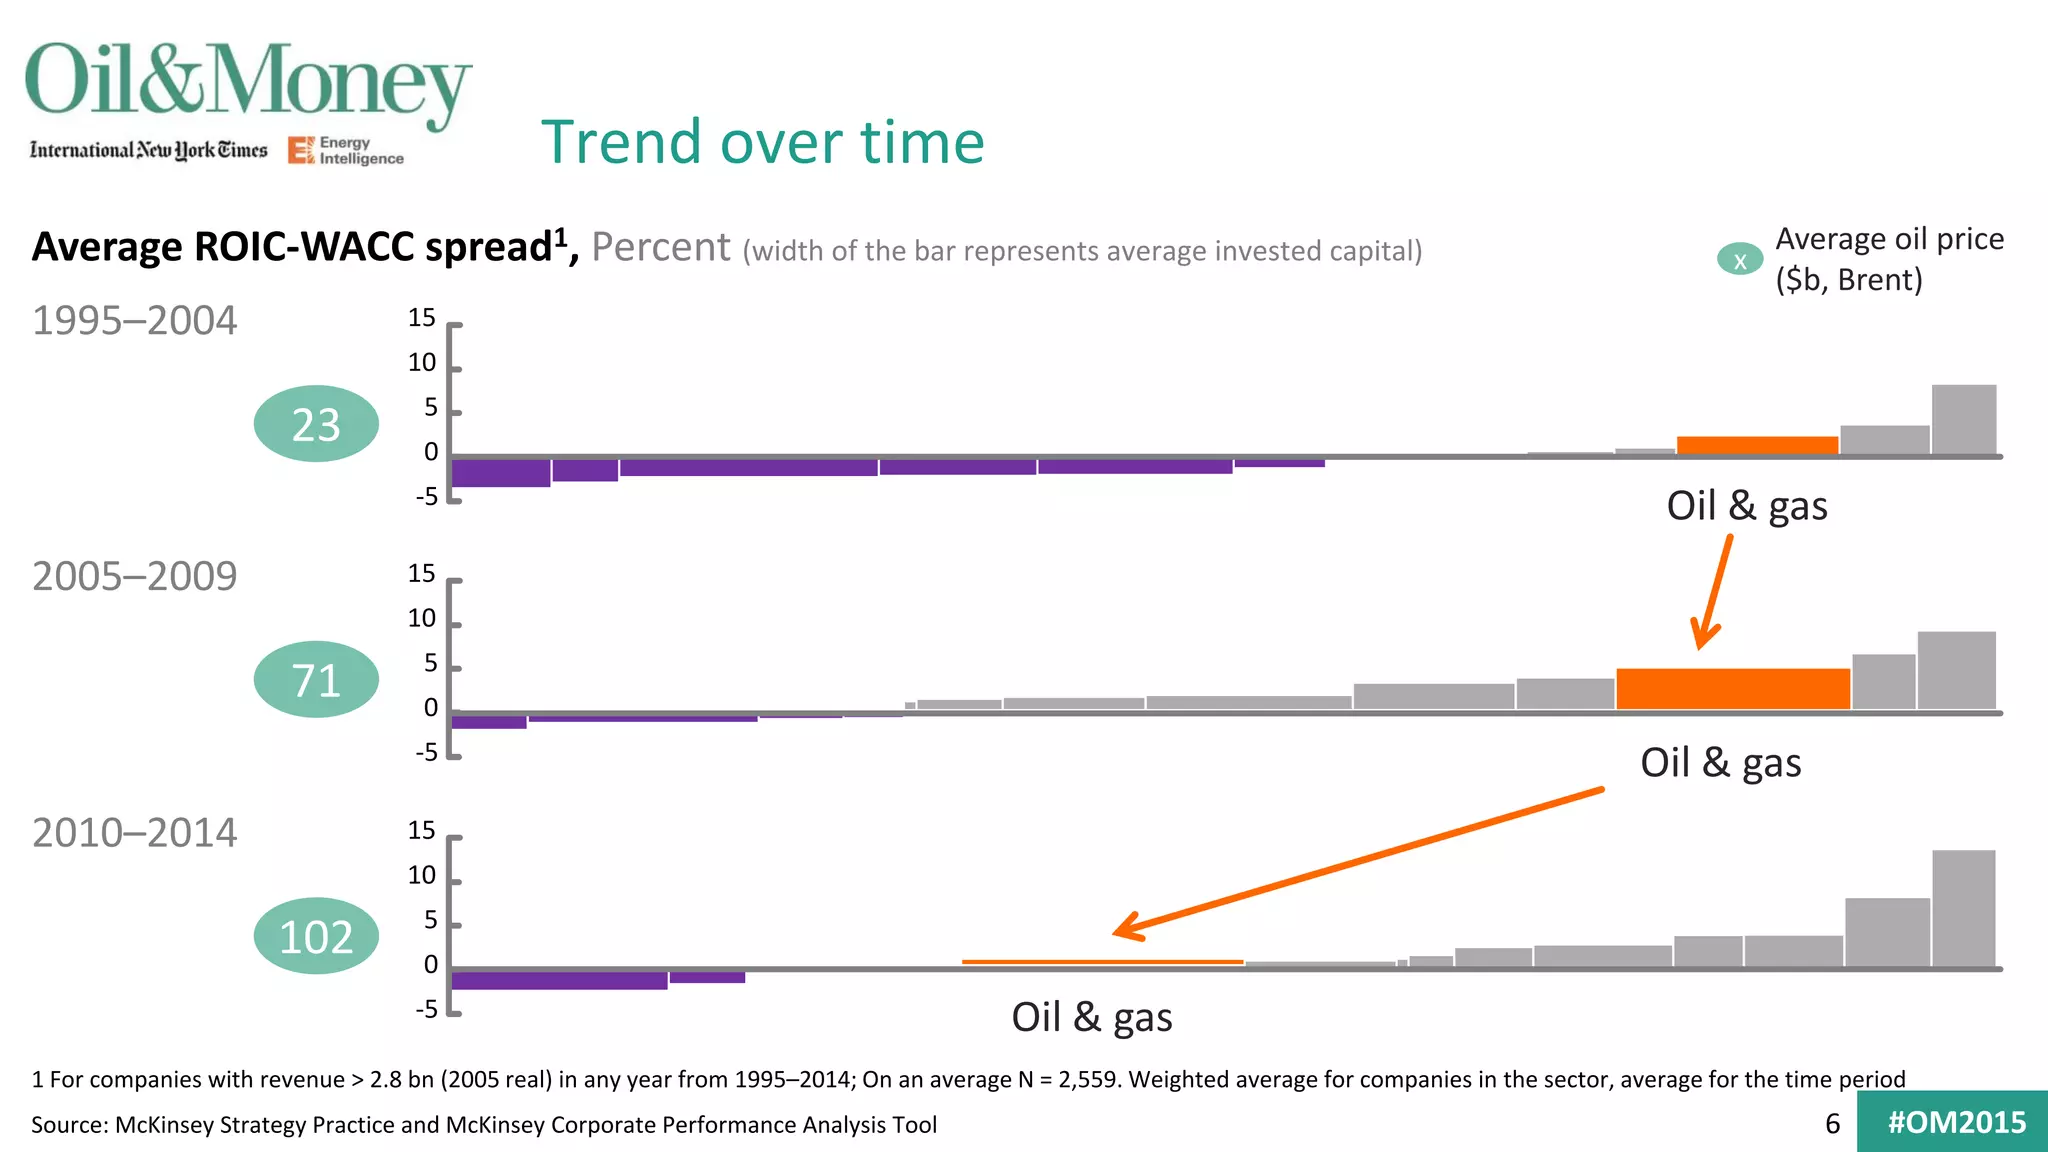
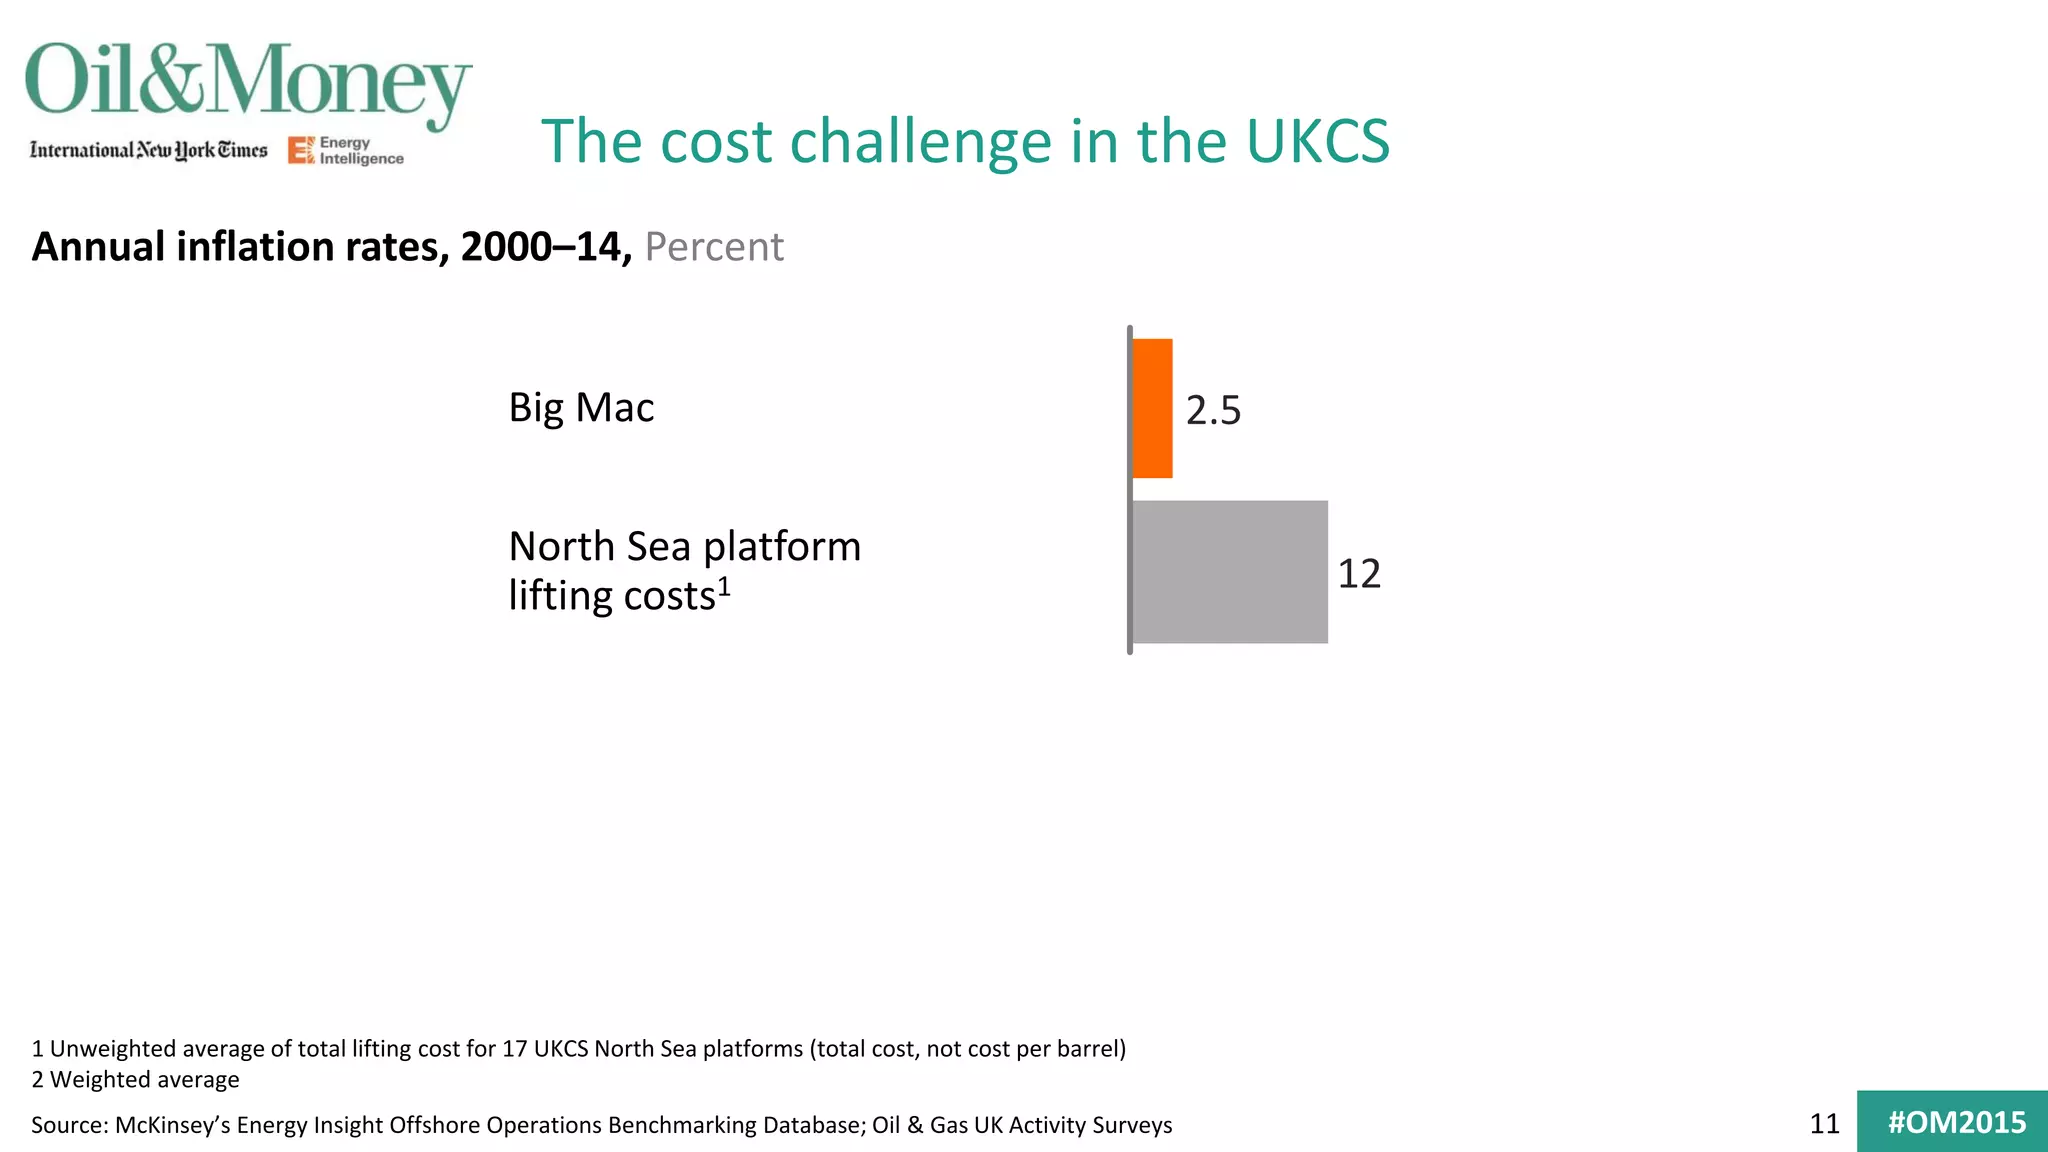
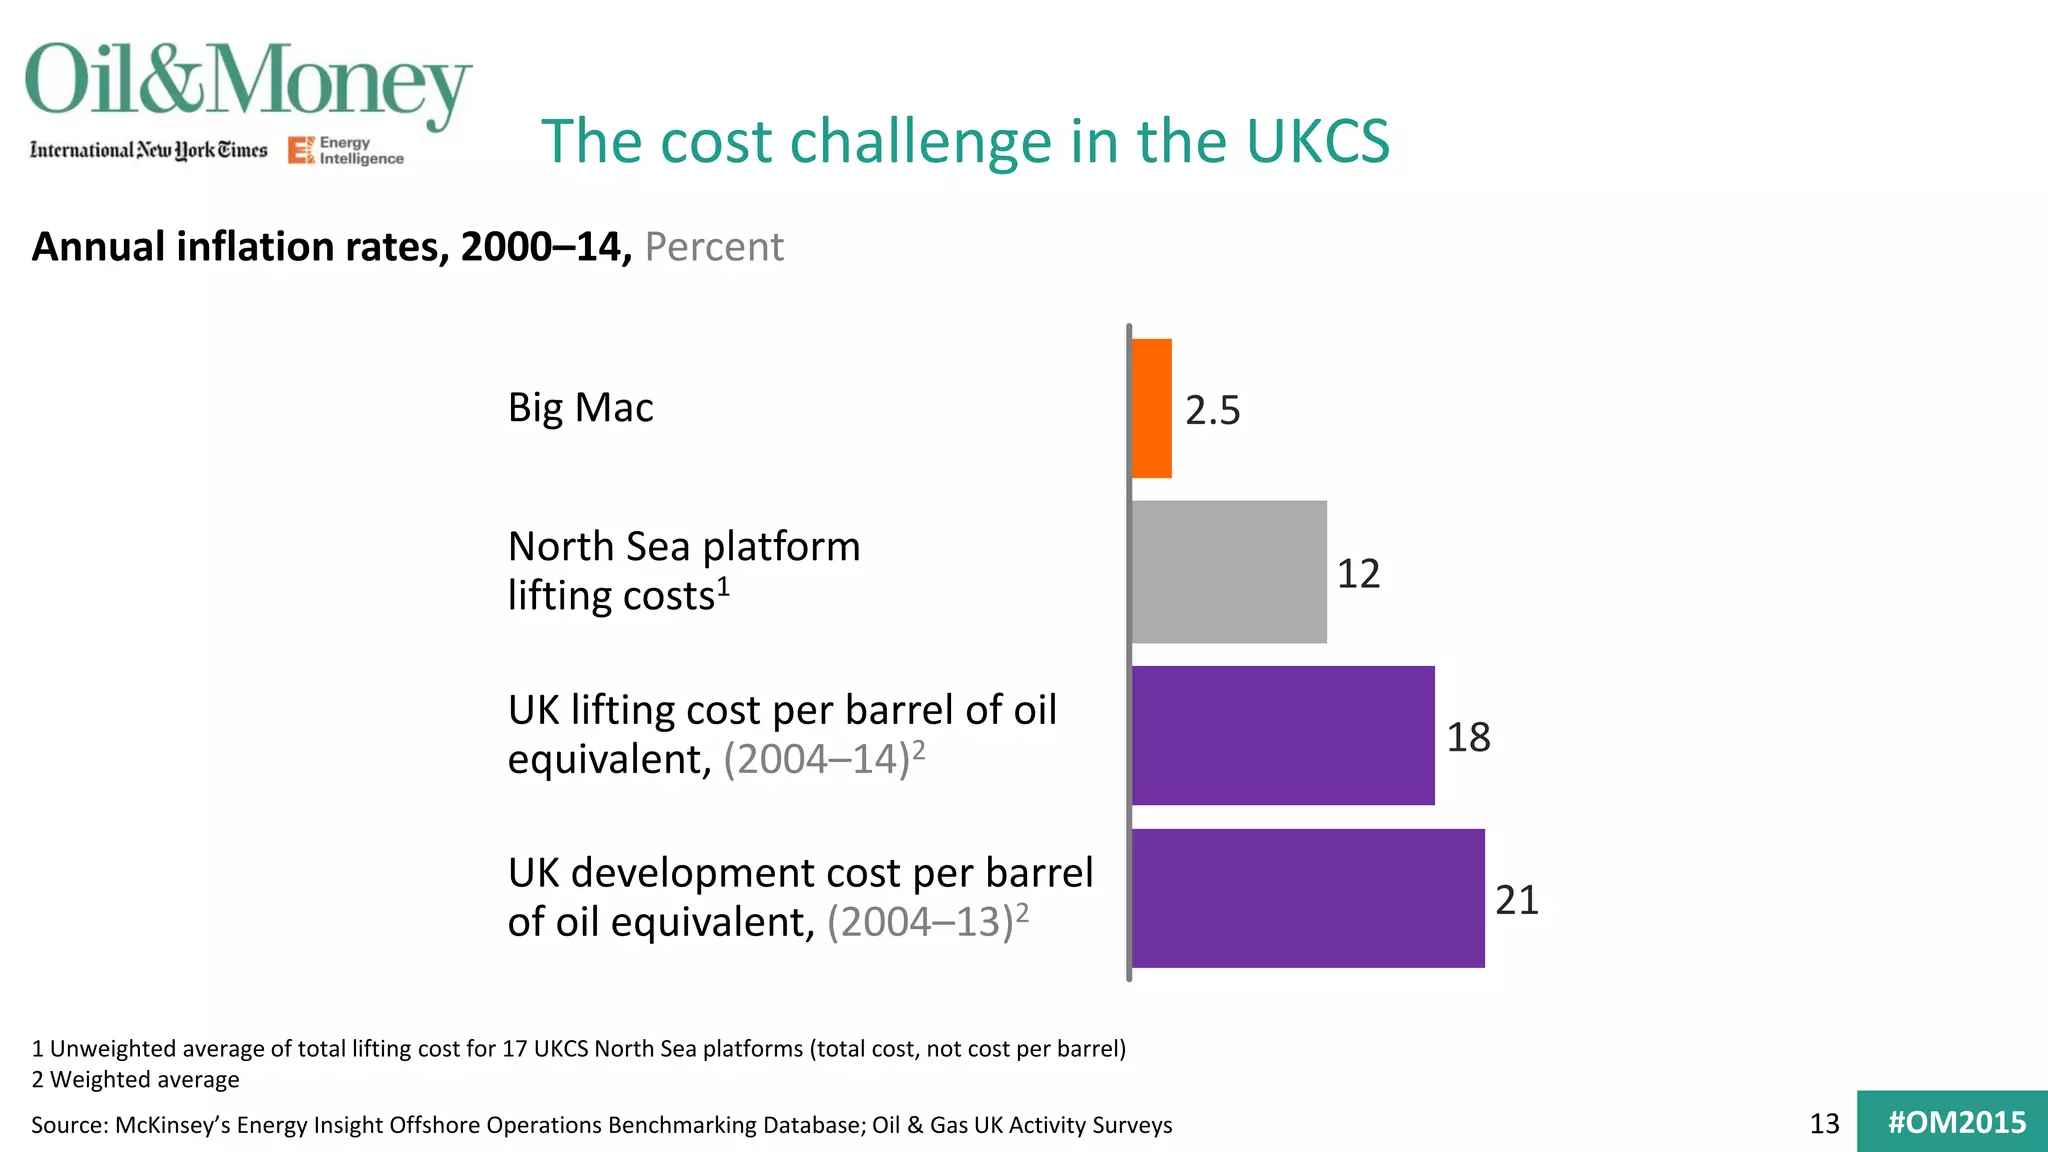
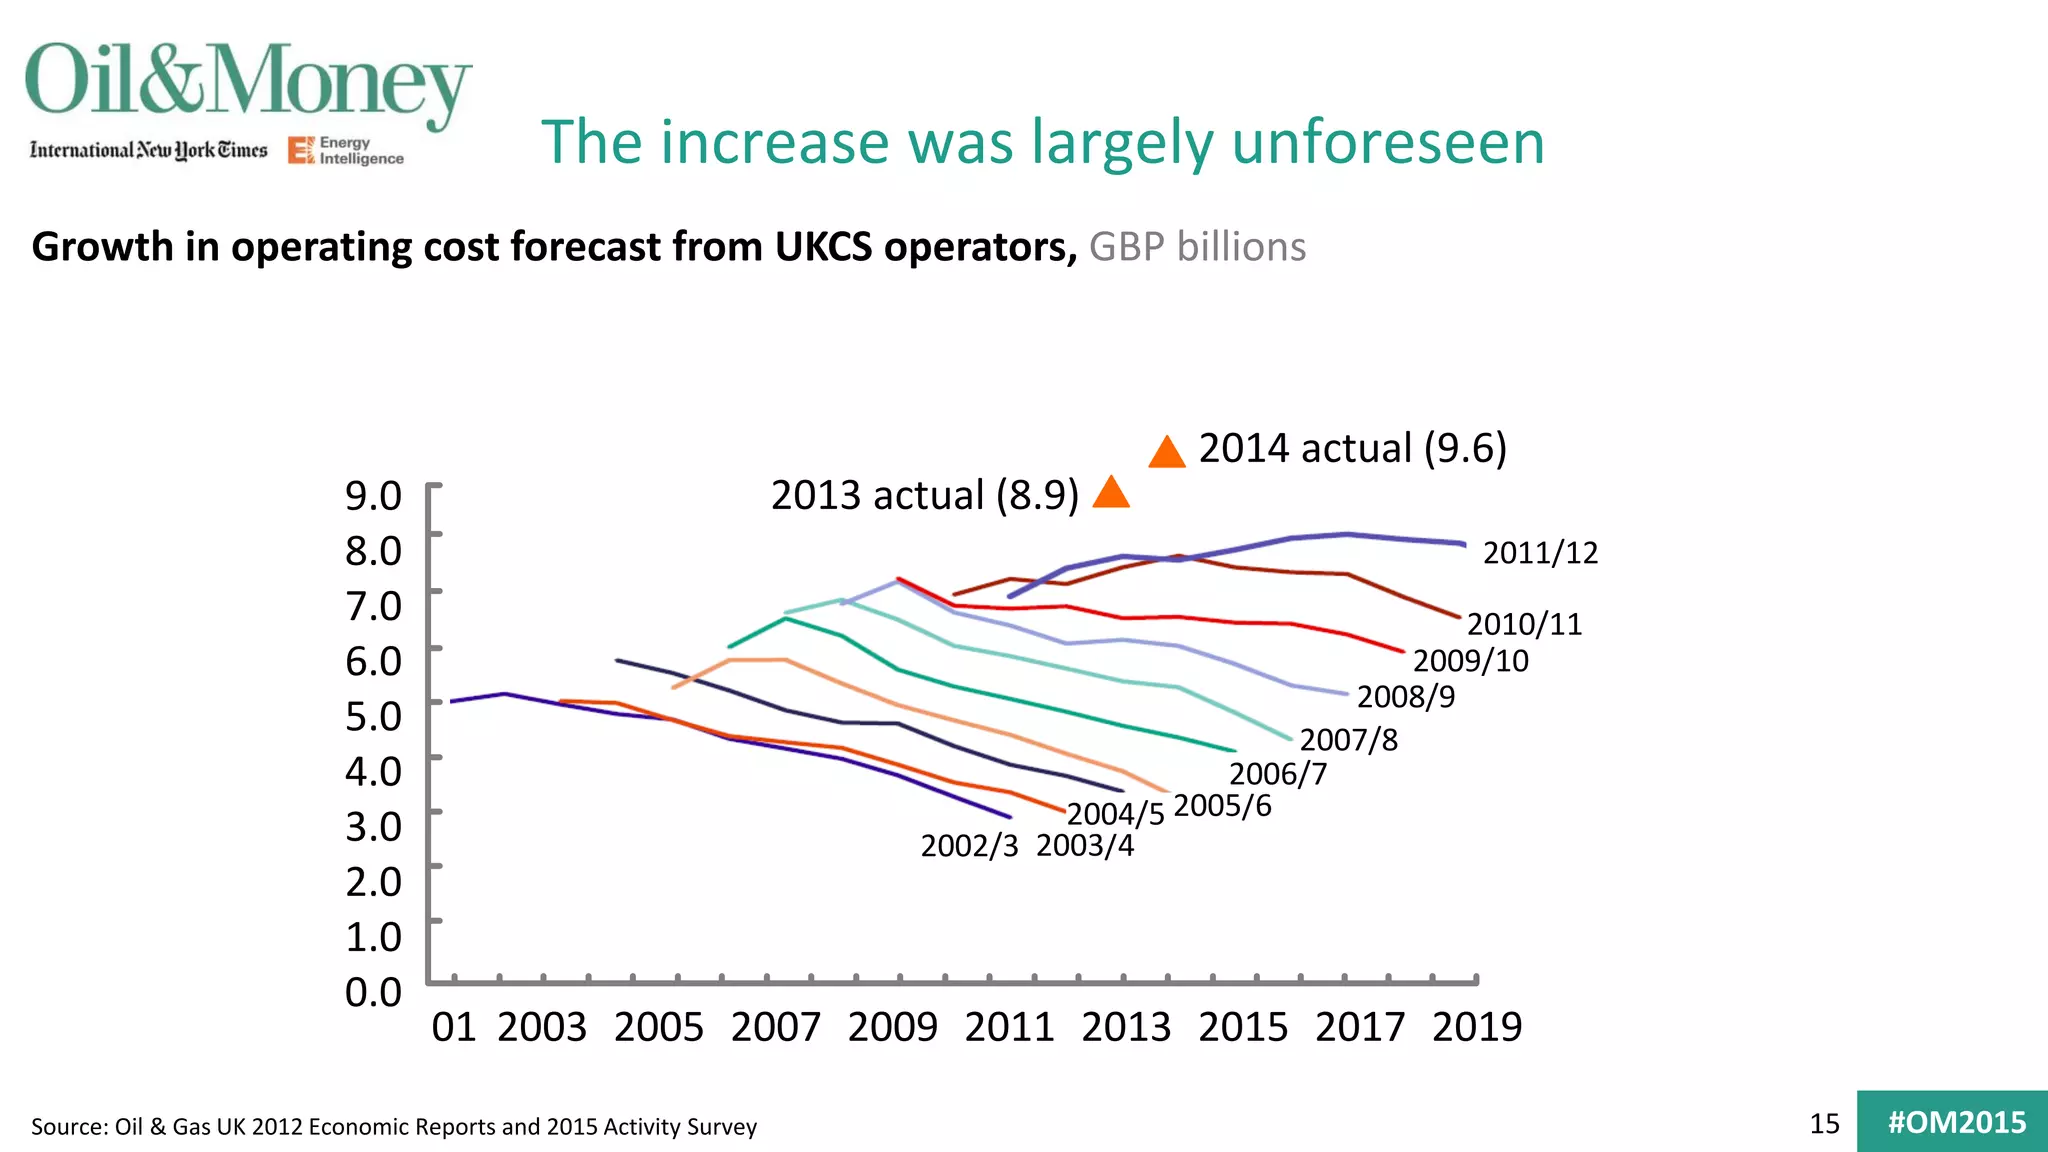
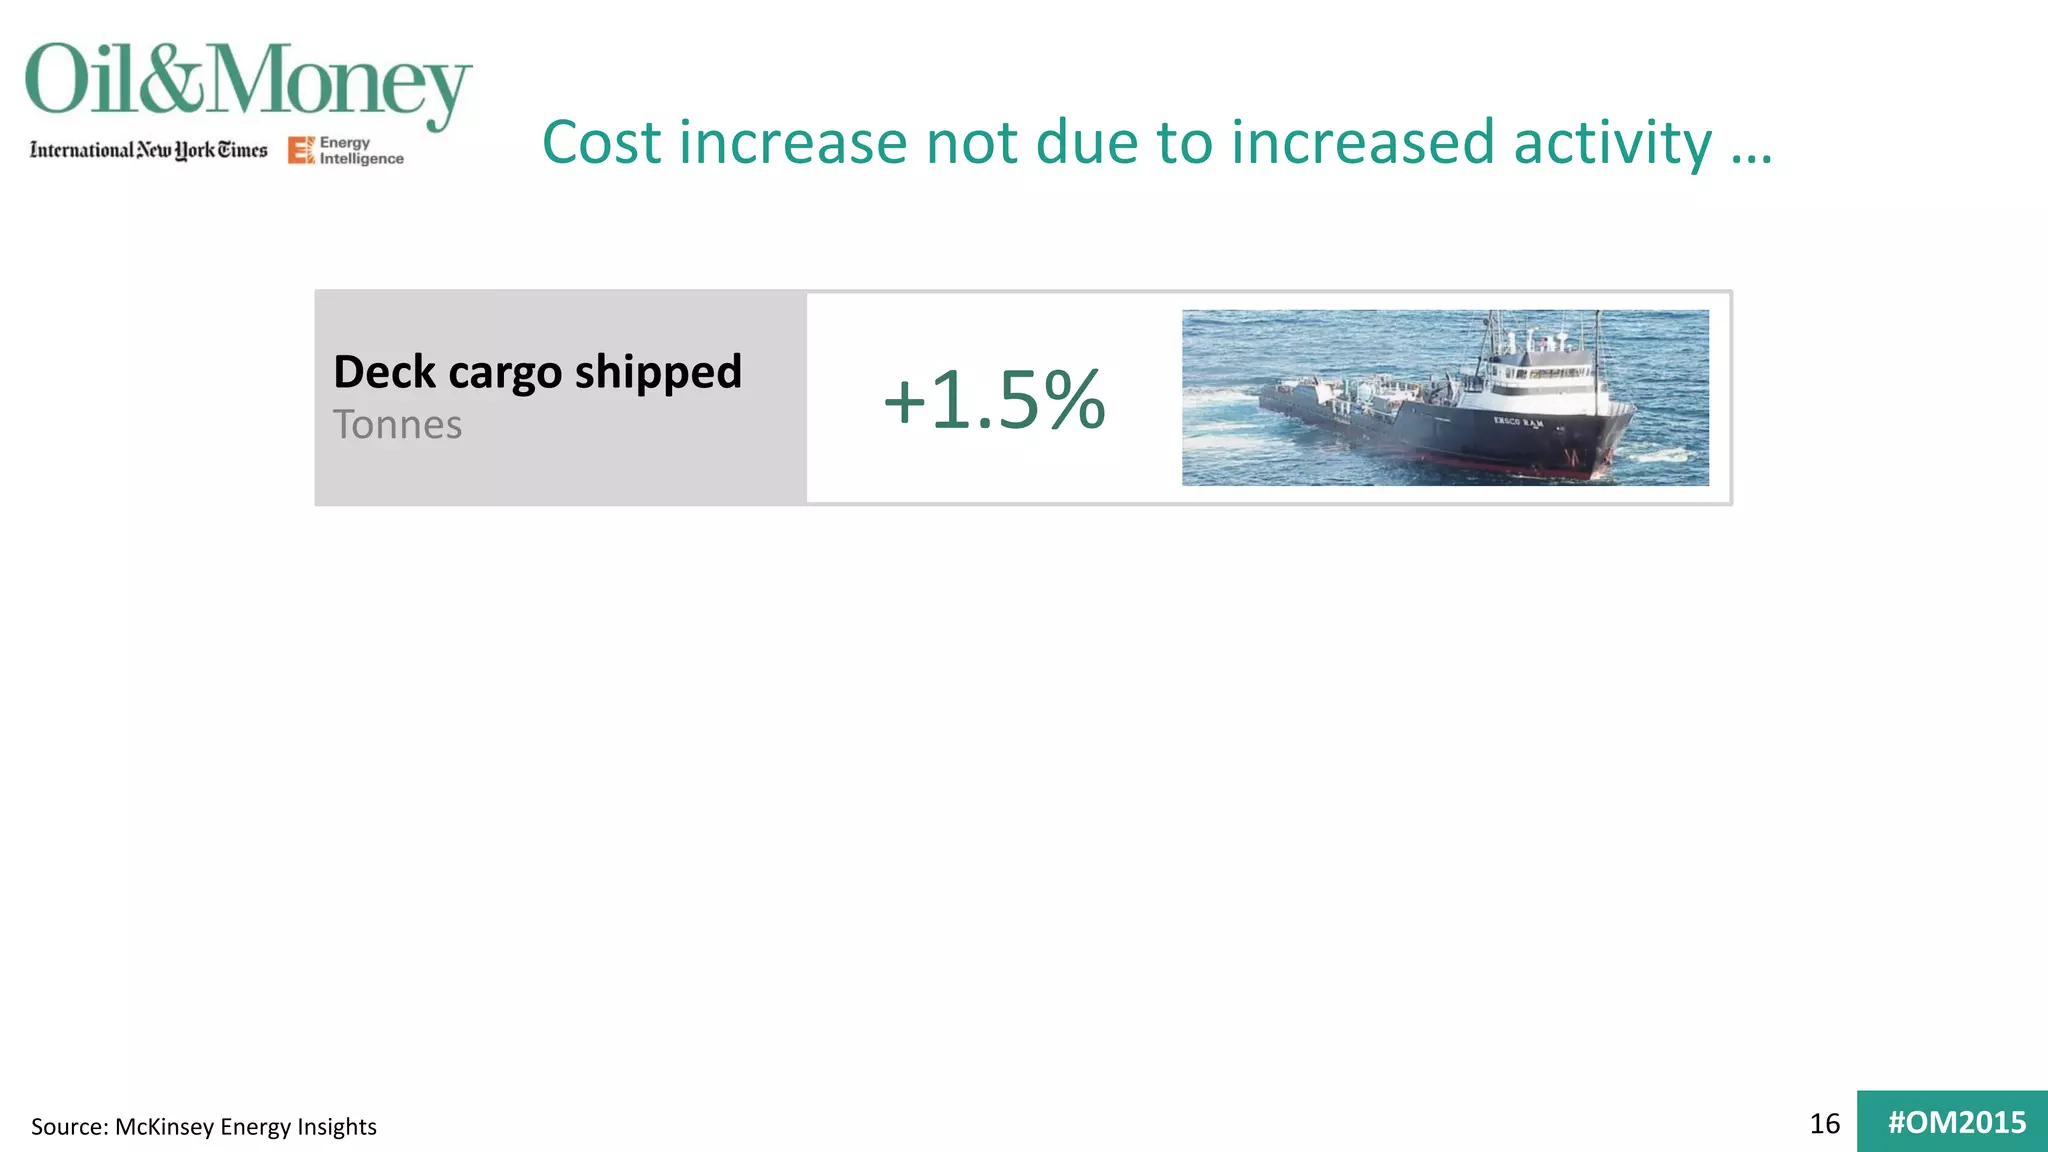
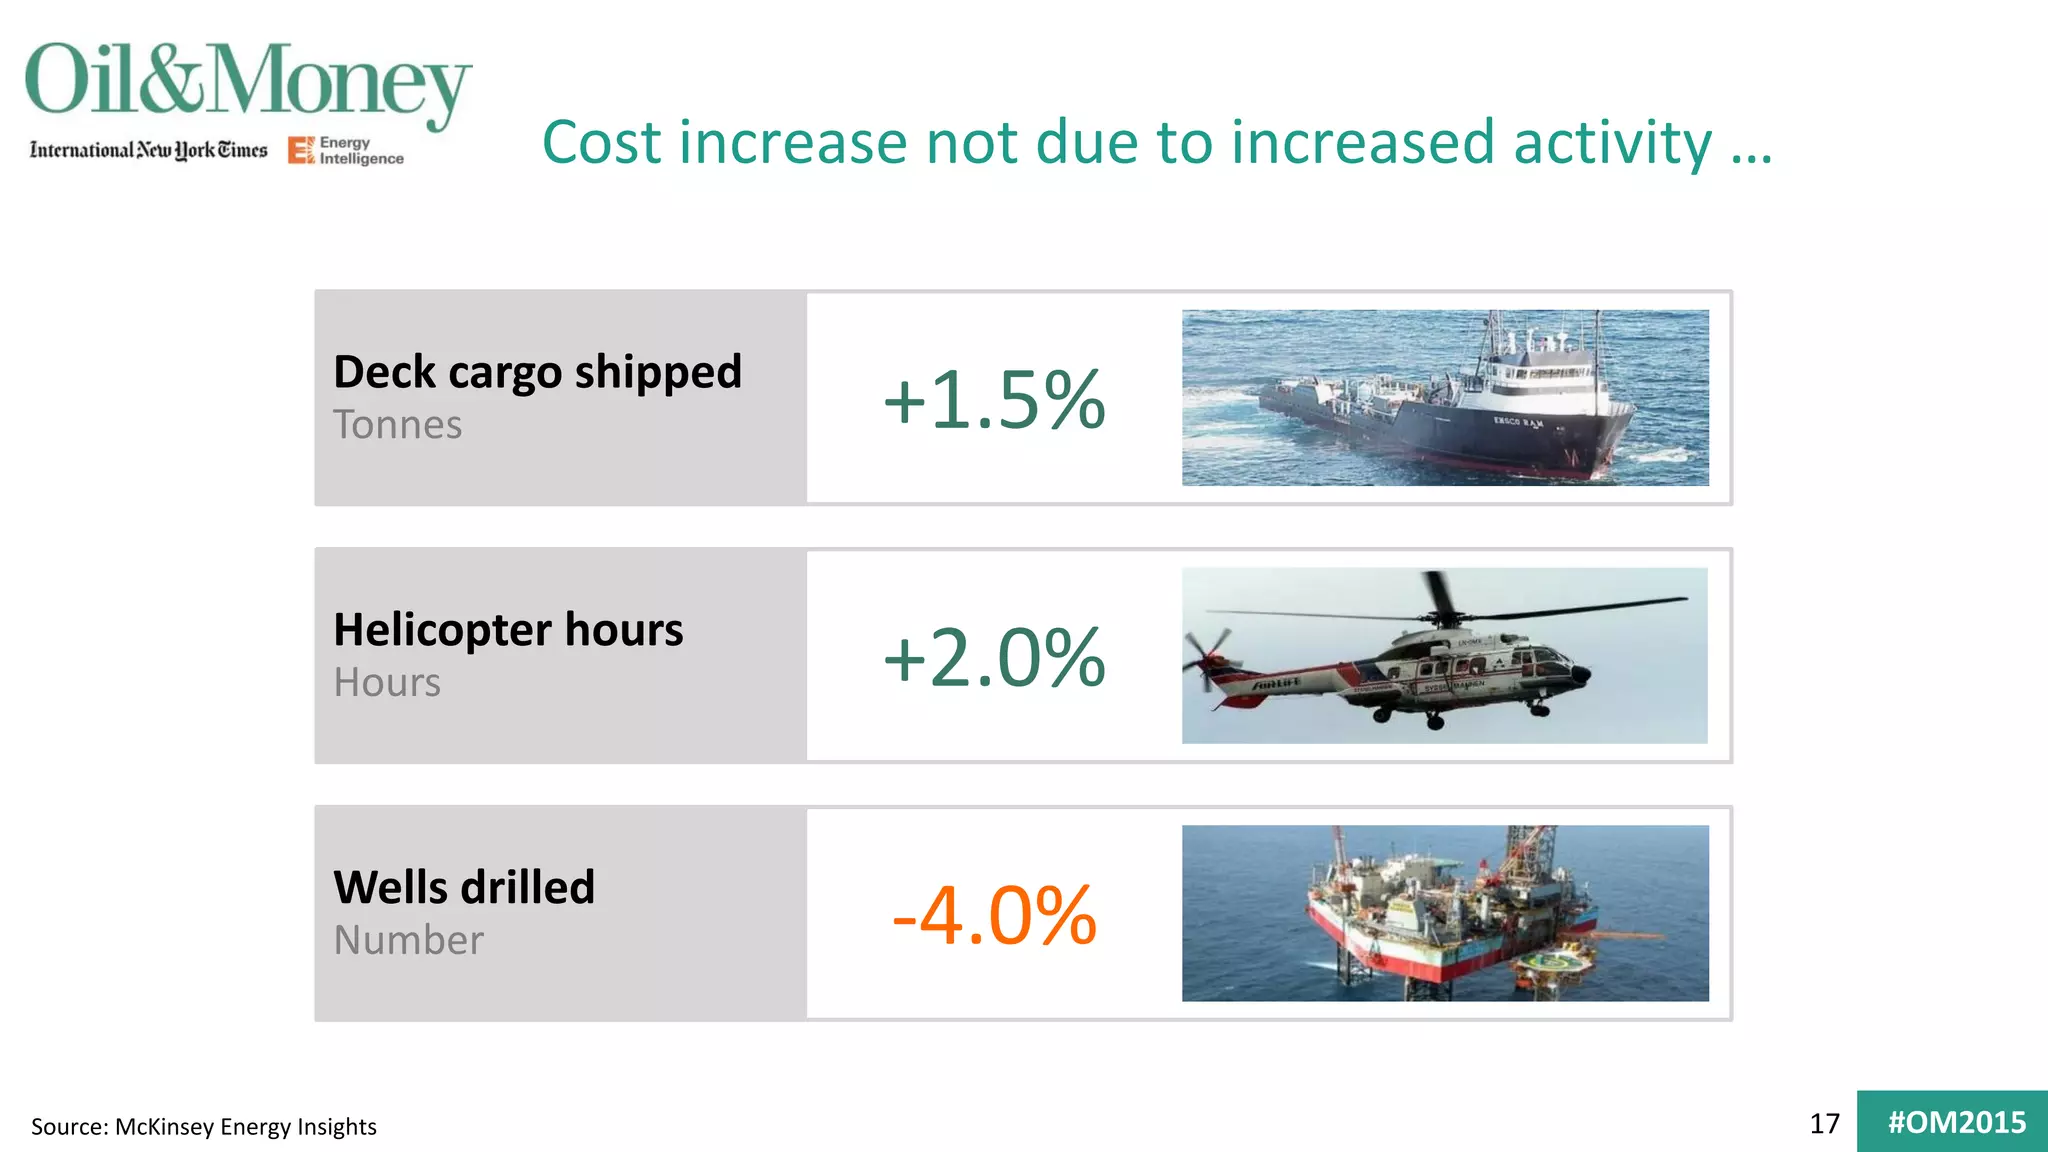
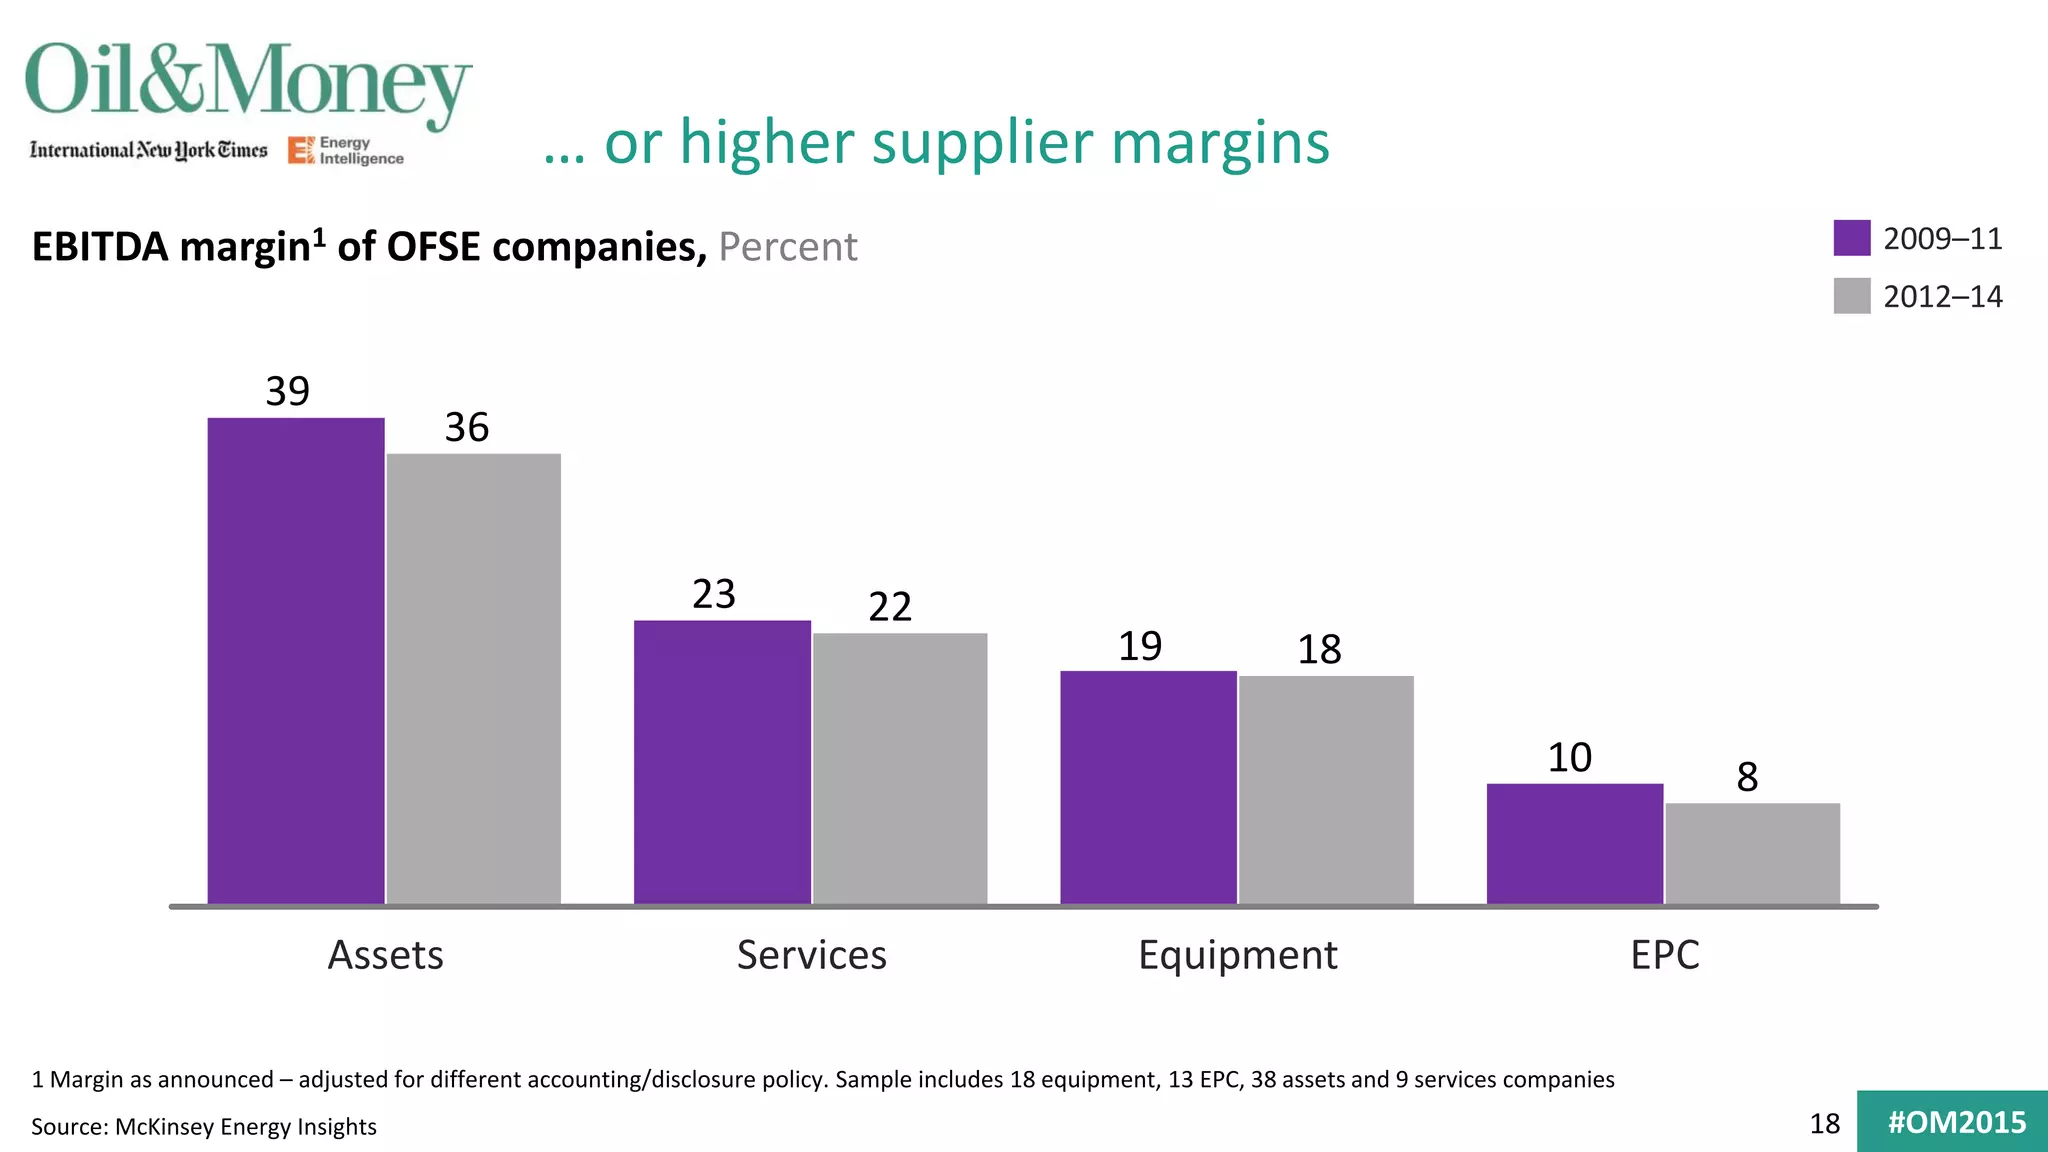
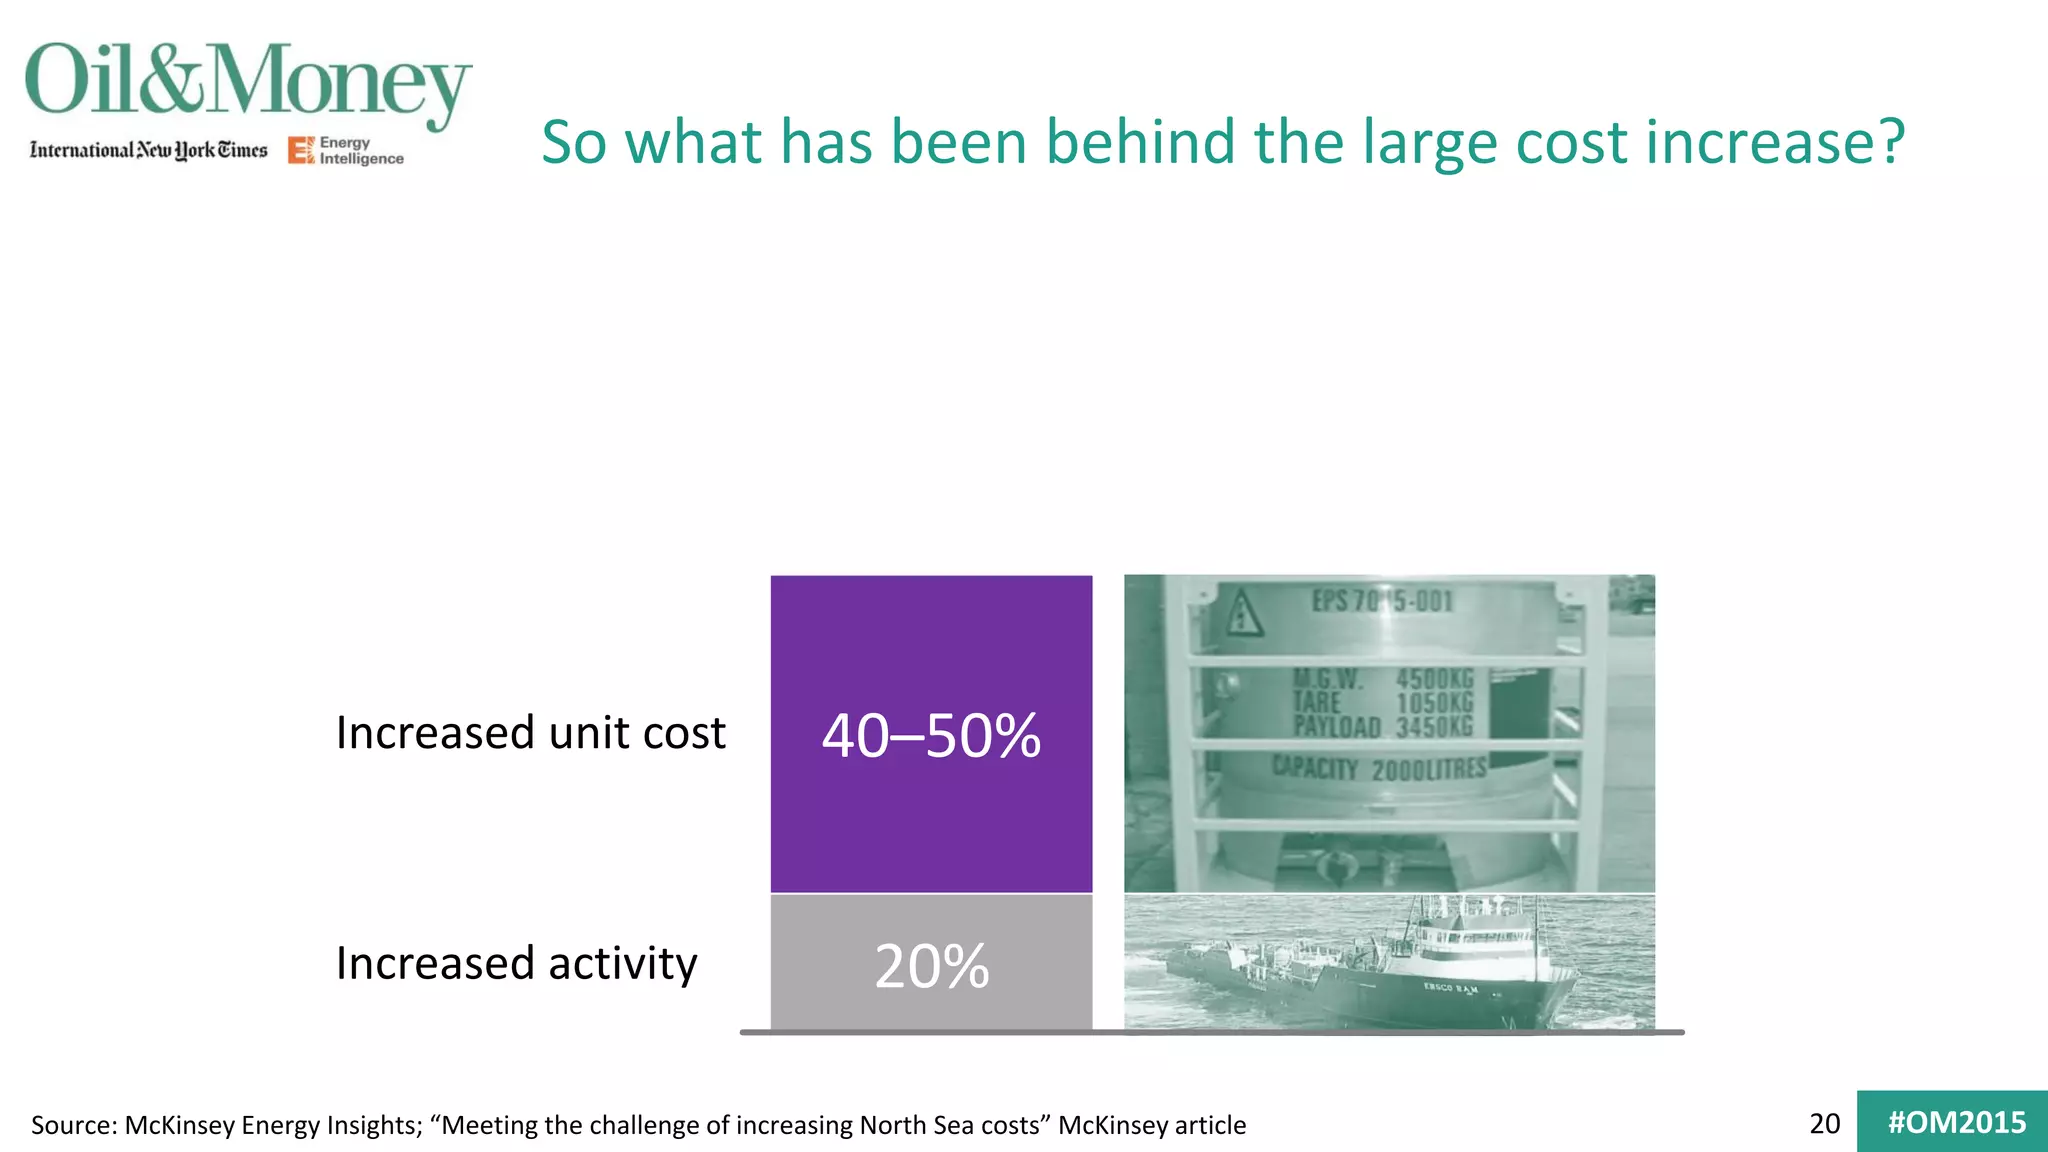
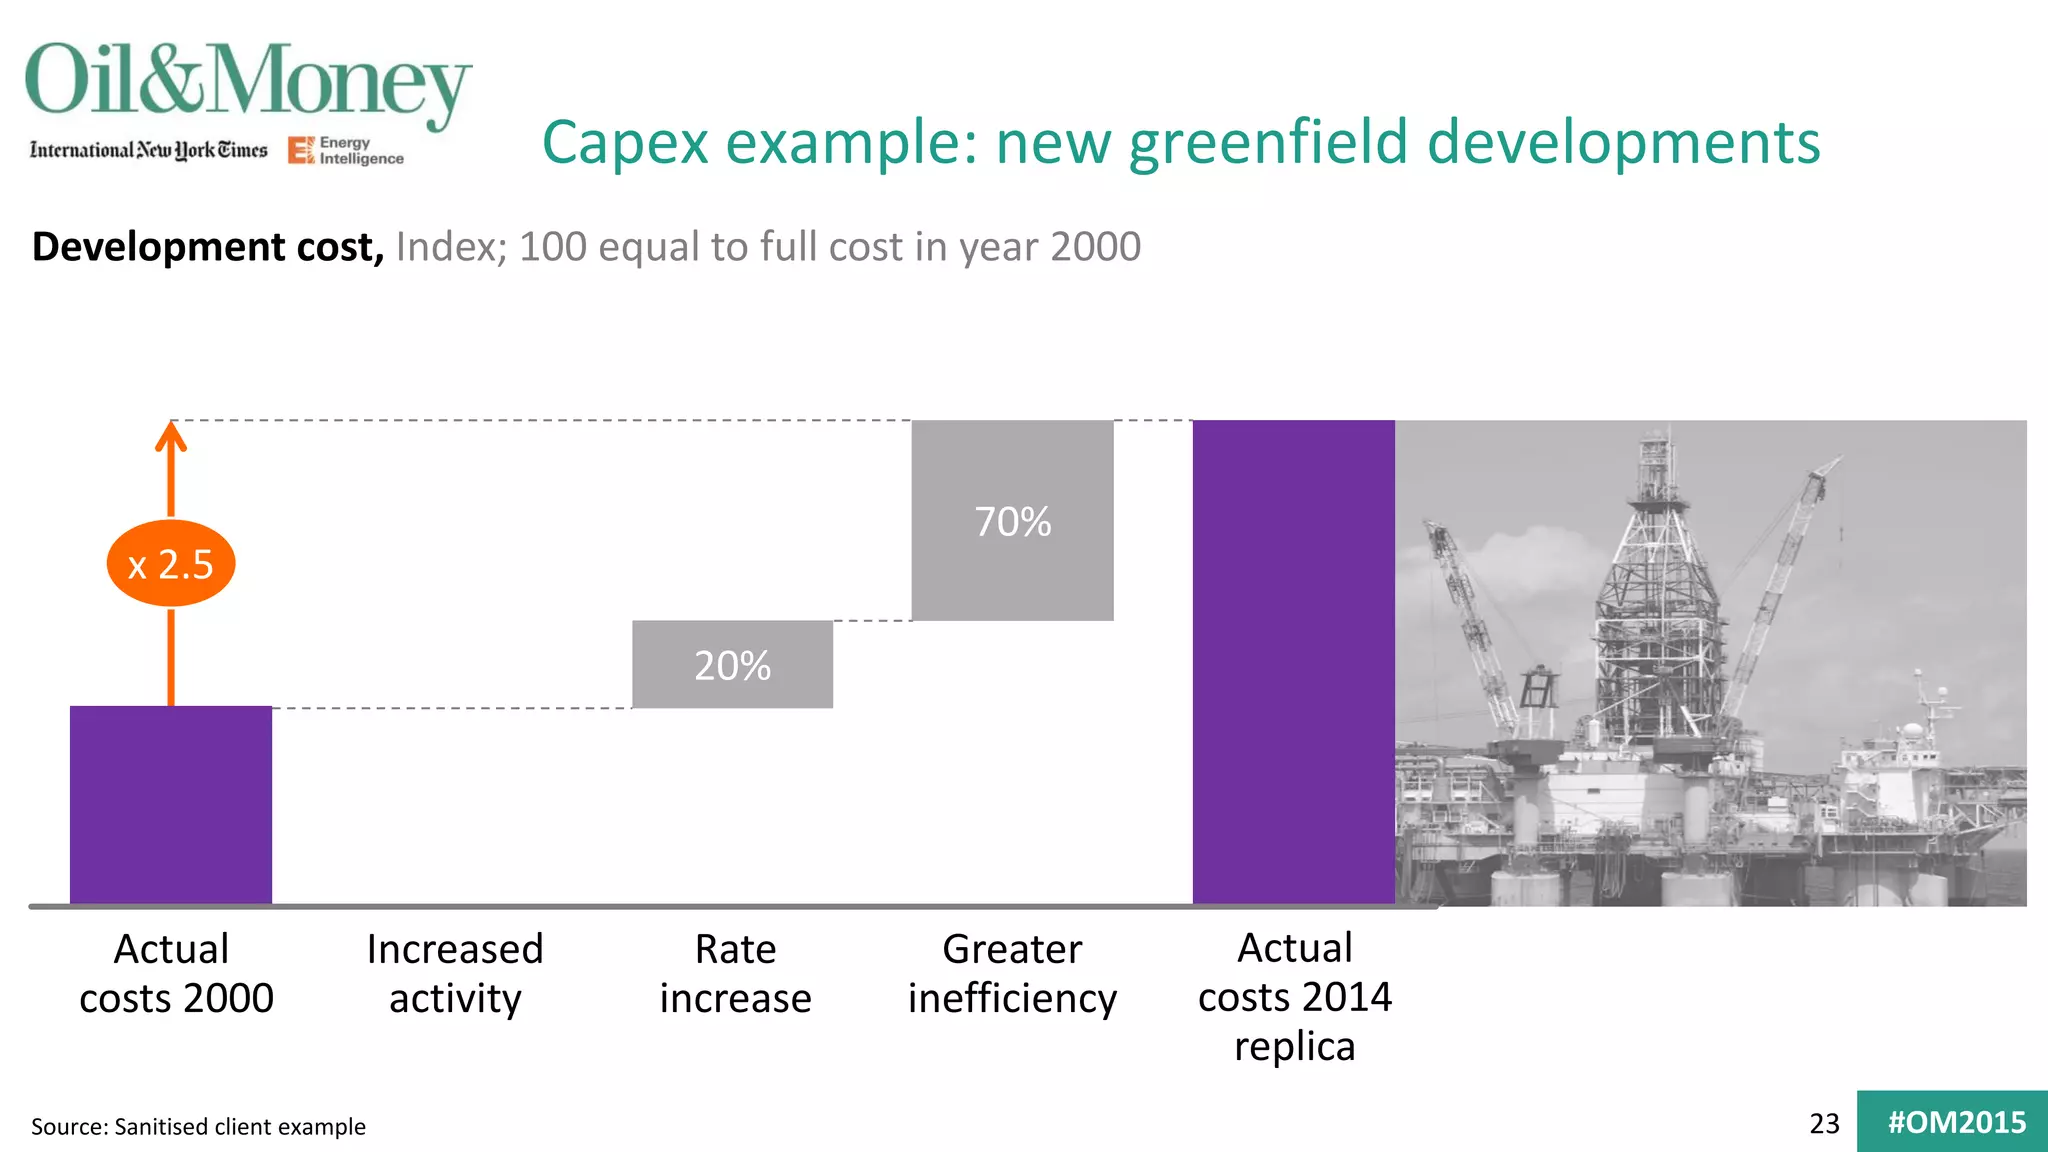
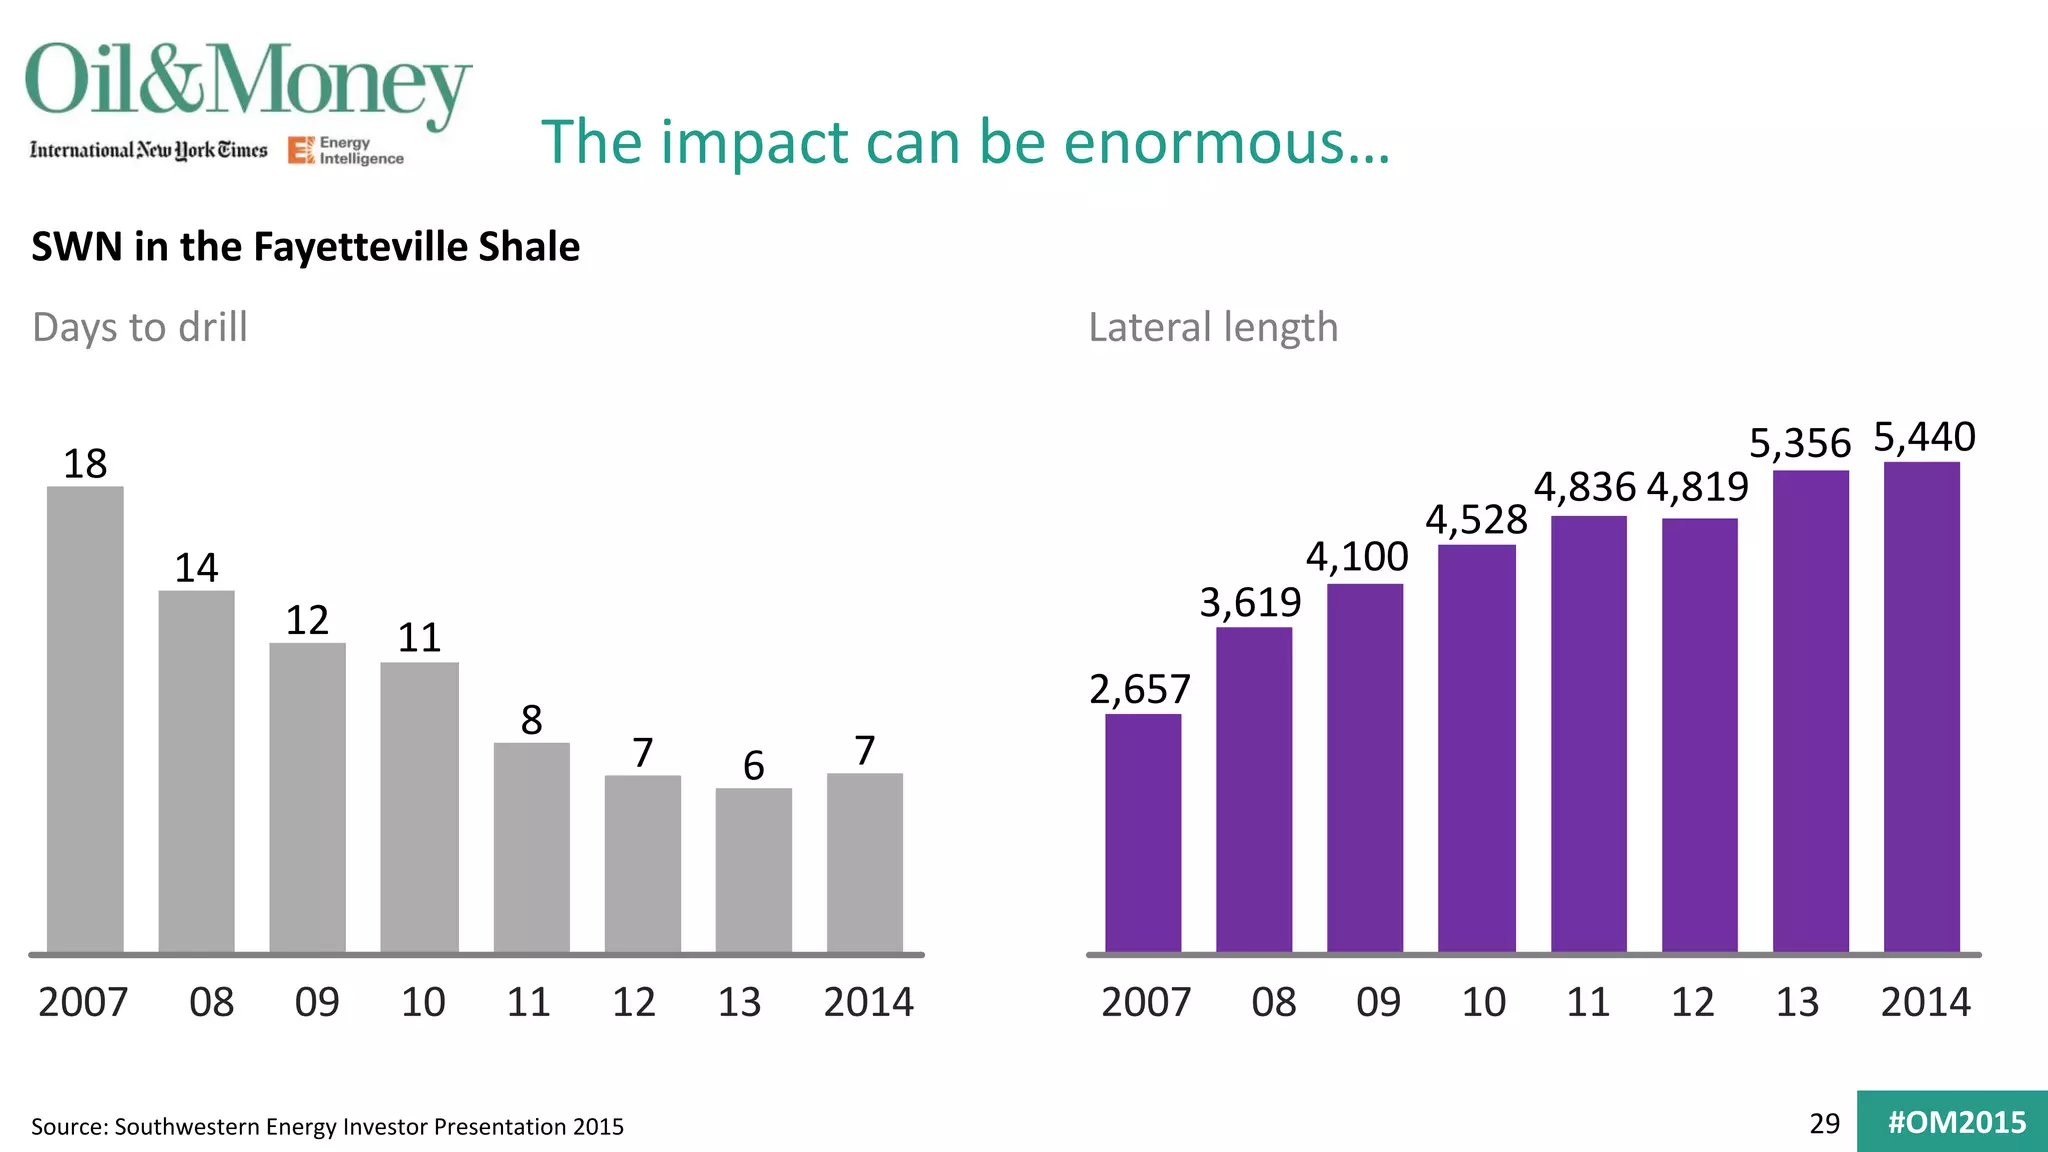
#OM2015
Responding to the downturn –
lessons from the North Sea
Oil & Money
6 October 2015, London
1 #OM2015
These are clearly tough times for the industry
Source: Fairfield Energy; Courtney Sacco, MBR
-42%
June 2014 October 2015
2.2
1.3
1 Majors and largest 20 independents
Industry market capitalisation1
USD trillion,
2 #OM2015
But valuations have been in decline for much longer
Source: McKinsey analysis, company filings; BP Statistical Review
1 Includes BP, ExxonMobil, Chevron, Eni, Shell, Statoil, Total. Enterprise value = market value of equity + debt – cash; invested capital = fixed assets + current assets - current liabilities – cash
Indexed: 2005 = 100
Majors’ valuation1
(enterprise value/
invested capital)
Brent oil price
50
150
100
1311 12102009 2014
3 #OM2015
Oil & Gas’s ‘economic power’ for last 20 years
Source: McKinsey Strategy Practice and McKinsey Corporate Performance Analysis Tool
1 For companies with revenue > 2.8 bn (2005 real) in any year from 1995–2014; On an average N = 2,559. Weighted average for companies in the sector, average for the time period
1995–2014 average ROIC-WACC spread1, Percent (width of the bar represents average invested capital)
10
5
-5
0
Trans-
portation
Utilities
Media
Materials Capital
Goods
Consumer
discretionary
Commercial &
professional
services
Retail &
wholesale
Telecom
Oil & gas
Consumer
staples
High
tech
Healthcare
and
pharma-
ceuticals
4 #OM2015
Trend over time
Source: McKinsey Strategy Practice and McKinsey Corporate Performance Analysis Tool
1 For companies with revenue > 2.8 bn (2005 real) in any year from 1995–2014; On an average N = 2,559. Weighted average for companies in the sector, average for the time period
Average ROIC-WACC spread1, Percent (width of the bar represents average invested capital) x
Average oil price
($b, Brent)
23
1995–2004 15
10
5
0
-5
Oil & gas
5 #OM2015
Trend over time
Source: McKinsey Strategy Practice and McKinsey Corporate Performance Analysis Tool
1 For companies with revenue > 2.8 bn (2005 real) in any year from 1995–2014; On an average N = 2,559. Weighted average for companies in the sector, average for the time period
Average ROIC-WACC spread1, Percent (width of the bar represents average invested capital) x
Average oil price
($b, Brent)
23
71
1995–2004
2005–2009
15
10
5
0
-5
Oil & gas
15
10
5
0
-5
Oil & gas
6 #OM2015
23
71
102
Trend over time
Source: McKinsey Strategy Practice and McKinsey Corporate Performance Analysis Tool
1 For companies with revenue > 2.8 bn (2005 real) in any year from 1995–2014; On an average N = 2,559. Weighted average for companies in the sector, average for the time period
Average ROIC-WACC spread1, Percent (width of the bar represents average invested capital)
1995–2004
2005–2009
2010–2014
15
10
5
0
-5
Oil & gas
15
10
5
0
-5
Oil & gas
15
10
5
0
-5 Oil & gas
x
Average oil price
($b, Brent)
7 #OM2015
1995–2014
Average ROIC-WACC spread1, Percent (width of the bar represents average invested capital)
Wide range within the oil & gas sector
Source: McKinsey Strategy Practice and McKinsey Corporate Performance Analysis Tool
1 For companies with revenue > 2.8 bn (2005 real) in any year from 1995–2014; On an average N = 2,559. Weighted average for companies in the sector, average for the time period
Majors
15
5
-5
10
0
NOC OFSE International
independents Downstream
and midstream North
American
Indepen-
dents
8 #OM2015
North Sea provides a unique window into this effect
Broad range of players
Hundreds of developments (50+ giant fields)
40 years technology development
9 #OM2015
GBP 2.69
10 #OM2015
The cost challenge in the UKCS
Source: McKinsey’s Energy Insight Offshore Operations Benchmarking Database; Oil & Gas UK Activity Surveys
1 Unweighted average of total lifting cost for 17 UKCS North Sea platforms (total cost, not cost per barrel)
2 Weighted average
Big Mac 2.5
Annual inflation rates, 2000–14, Percent
11 #OM2015
The cost challenge in the UKCS
Source: McKinsey’s Energy Insight Offshore Operations Benchmarking Database; Oil & Gas UK Activity Surveys
1 Unweighted average of total lifting cost for 17 UKCS North Sea platforms (total cost, not cost per barrel)
2 Weighted average
Annual inflation rates, 2000–14, Percent
Big Mac 2.5
North Sea platform
lifting costs1 12
12 #OM2015
The cost challenge in the UKCS
Source: McKinsey’s Energy Insight Offshore Operations Benchmarking Database; Oil & Gas UK Activity Surveys
1 Unweighted average of total lifting cost for 17 UKCS North Sea platforms (total cost, not cost per barrel)
2 Weighted average
Annual inflation rates, 2000–14, Percent
Big Mac 2.5
North Sea platform
lifting costs1 12
UK lifting cost per barrel of oil
equivalent, (2004–14)2 18
13 #OM2015
The cost challenge in the UKCS
Source: McKinsey’s Energy Insight Offshore Operations Benchmarking Database; Oil & Gas UK Activity Surveys
1 Unweighted average of total lifting cost for 17 UKCS North Sea platforms (total cost, not cost per barrel)
2 Weighted average
Annual inflation rates, 2000–14, Percent
Big Mac 2.5
North Sea platform
lifting costs1 12
UK lifting cost per barrel of oil
equivalent, (2004–14)2 18
UK development cost per barrel
of oil equivalent, (2004–13)2 21
14 #OM2015
GBP 13!
15 #OM2015
The increase was largely unforeseen
Growth in operating cost forecast from UKCS operators, GBP billions
Source: Oil & Gas UK 2012 Economic Reports and 2015 Activity Survey
2002/3 2003/4
2004/5
2008/9
2009/10
2011/12
2013 actual (8.9)
2014 actual (9.6)
01 2003 2005 2007 2009 2011 2013 2015 2017 2019
9.0
8.0
7.0
6.0
5.0
4.0
3.0
2.0
1.0
0.0
2010/11
2007/8
2005/6
2006/7
16 #OM2015
Cost increase not due to increased activity …
Source: McKinsey Energy Insights
Deck cargo shipped
Tonnes +1.5%
17 #OM2015
Cost increase not due to increased activity …
Source: McKinsey Energy Insights
Deck cargo shipped
Tonnes +1.5%
Helicopter hours
Hours +2.0%
Wells drilled
Number -4.0%
18 #OM2015
… or higher supplier margins
Source: McKinsey Energy Insights
1 Margin as announced – adjusted for different accounting/disclosure policy. Sample includes 18 equipment, 13 EPC, 38 assets and 9 services companies
EBITDA margin1 of OFSE companies, Percent
2012–14
2009–11
Assets EPCServices Equipment
10
19
23
39
8
18
22
36
19 #OM2015
So what has been behind the large cost increase?
Source: McKinsey Energy Insights; “Meeting the challenge of increasing North Sea costs” McKinsey article
20%Increased activity
20 #OM2015
So what has been behind the large cost increase?
Source: McKinsey Energy Insights; “Meeting the challenge of increasing North Sea costs” McKinsey article
40–50%
20%
Increased unit cost
Increased activity
21 #OM2015
So what has been behind the large cost increase?
Source: McKinsey Energy Insights; “Meeting the challenge of increasing North Sea costs” McKinsey article
40–50%
20%
30–40%Greater inefficiency
Increased unit cost
Increased activity
22 #OM2015
Opex example: integrity inspections cost
Source: Sanitised client example
Comparison of topsides integrity inspection costs per asset, GBP thousands per installation, gross
30%
20%
50%
Year 1 Greater
inefficiency
Rate
increase
Increased
activity
Year 4
x 2.9
23 #OM2015
Capex example: new greenfield developments
Development cost, Index; 100 equal to full cost in year 2000
30%
20%
70%
Actual
costs 2000
Actual
costs 2014
replica
Source: Sanitised client example
x 2.5
Greater
inefficiency
Rate
increase
Increased
activity
24 #OM2015
Something other highly
technical industries appear to have avoided
Nominal price inflation
for a new commercial airliner
Source: A2Mac1; manufacturer’s public data; Airline Monitor: McKinsey analysis
+0.2–1.5%
Nominal price inflation for a new car
+1.0%
25 #OM2015
Inspiration can come from many sources
Source: McDonalds, McKinsey Operations Practices
Standards
Training
Auditing
Workplace
organisation
26 #OM2015
Including the existing organisation
Source: McKinsey Upstream Operations Service Line
Production, Indexed
110
90
10
0
70
80
100
120
8 100 2 12 14 16 242218 204 6
+12%
Time
hours
8 100 2 12 14 16 242218 204 6
-3%
27 #OM2015
Some approaches are transformational
Source: McKinsey Oil & Gas and RTS practices
5-year cumulative FCF impact, USD billions
4.5Total
Reorganise around assets and talent
De-risk and optimize major capital project
Targeted production improvement
External spend cost reduction
Change in asset strategies
28 #OM2015
Others rely on incremental gains
7/10 golds -50%
29 #OM2015
The impact can be enormous…
SWN in the Fayetteville Shale
Source: Southwestern Energy Investor Presentation 2015
Days to drill Lateral length
08 092007 11 201410 12 13
767
8
1112
14
18
1209 11 20141310082007
4,8194,836
4,528
4,100
3,619
2,657
5,4405,356
30 #OM2015
…and rapid
Source: Recent offshore example
Offshore productivity, Earned hours per POB
13
1515
11
16
7
6
9
10
2014
ave.
Week
5
Week
1
April Week
4
Mar Week
3
Feb Week
2
Start of
program
end April
31 #OM2015
Initiatives like this are starting to have an effect
Source: Oil & Gas UK
UKCS Opex, GBP billions, fields onstream
7.5
8.8
9.6
8.9
2013 2014 2015F 2016F
-22%
32 #OM2015
Recap

Lunch Hosted by McKinsey & Company

  • 1.
    #OM2015 Responding to thedownturn – lessons from the North Sea Oil & Money 6 October 2015, London
  • 2.
    1 #OM2015 These areclearly tough times for the industry Source: Fairfield Energy; Courtney Sacco, MBR -42% June 2014 October 2015 2.2 1.3 1 Majors and largest 20 independents Industry market capitalisation1 USD trillion,
  • 3.
    2 #OM2015 But valuationshave been in decline for much longer Source: McKinsey analysis, company filings; BP Statistical Review 1 Includes BP, ExxonMobil, Chevron, Eni, Shell, Statoil, Total. Enterprise value = market value of equity + debt – cash; invested capital = fixed assets + current assets - current liabilities – cash Indexed: 2005 = 100 Majors’ valuation1 (enterprise value/ invested capital) Brent oil price 50 150 100 1311 12102009 2014
  • 4.
    3 #OM2015 Oil &Gas’s ‘economic power’ for last 20 years Source: McKinsey Strategy Practice and McKinsey Corporate Performance Analysis Tool 1 For companies with revenue > 2.8 bn (2005 real) in any year from 1995–2014; On an average N = 2,559. Weighted average for companies in the sector, average for the time period 1995–2014 average ROIC-WACC spread1, Percent (width of the bar represents average invested capital) 10 5 -5 0 Trans- portation Utilities Media Materials Capital Goods Consumer discretionary Commercial & professional services Retail & wholesale Telecom Oil & gas Consumer staples High tech Healthcare and pharma- ceuticals
  • 5.
    4 #OM2015 Trend overtime Source: McKinsey Strategy Practice and McKinsey Corporate Performance Analysis Tool 1 For companies with revenue > 2.8 bn (2005 real) in any year from 1995–2014; On an average N = 2,559. Weighted average for companies in the sector, average for the time period Average ROIC-WACC spread1, Percent (width of the bar represents average invested capital) x Average oil price ($b, Brent) 23 1995–2004 15 10 5 0 -5 Oil & gas
  • 6.
    5 #OM2015 Trend overtime Source: McKinsey Strategy Practice and McKinsey Corporate Performance Analysis Tool 1 For companies with revenue > 2.8 bn (2005 real) in any year from 1995–2014; On an average N = 2,559. Weighted average for companies in the sector, average for the time period Average ROIC-WACC spread1, Percent (width of the bar represents average invested capital) x Average oil price ($b, Brent) 23 71 1995–2004 2005–2009 15 10 5 0 -5 Oil & gas 15 10 5 0 -5 Oil & gas
  • 7.
    6 #OM2015 23 71 102 Trend overtime Source: McKinsey Strategy Practice and McKinsey Corporate Performance Analysis Tool 1 For companies with revenue > 2.8 bn (2005 real) in any year from 1995–2014; On an average N = 2,559. Weighted average for companies in the sector, average for the time period Average ROIC-WACC spread1, Percent (width of the bar represents average invested capital) 1995–2004 2005–2009 2010–2014 15 10 5 0 -5 Oil & gas 15 10 5 0 -5 Oil & gas 15 10 5 0 -5 Oil & gas x Average oil price ($b, Brent)
  • 8.
    7 #OM2015 1995–2014 Average ROIC-WACCspread1, Percent (width of the bar represents average invested capital) Wide range within the oil & gas sector Source: McKinsey Strategy Practice and McKinsey Corporate Performance Analysis Tool 1 For companies with revenue > 2.8 bn (2005 real) in any year from 1995–2014; On an average N = 2,559. Weighted average for companies in the sector, average for the time period Majors 15 5 -5 10 0 NOC OFSE International independents Downstream and midstream North American Indepen- dents
  • 9.
    8 #OM2015 North Seaprovides a unique window into this effect Broad range of players Hundreds of developments (50+ giant fields) 40 years technology development
  • 10.
  • 11.
    10 #OM2015 The costchallenge in the UKCS Source: McKinsey’s Energy Insight Offshore Operations Benchmarking Database; Oil & Gas UK Activity Surveys 1 Unweighted average of total lifting cost for 17 UKCS North Sea platforms (total cost, not cost per barrel) 2 Weighted average Big Mac 2.5 Annual inflation rates, 2000–14, Percent
  • 12.
    11 #OM2015 The costchallenge in the UKCS Source: McKinsey’s Energy Insight Offshore Operations Benchmarking Database; Oil & Gas UK Activity Surveys 1 Unweighted average of total lifting cost for 17 UKCS North Sea platforms (total cost, not cost per barrel) 2 Weighted average Annual inflation rates, 2000–14, Percent Big Mac 2.5 North Sea platform lifting costs1 12
  • 13.
    12 #OM2015 The costchallenge in the UKCS Source: McKinsey’s Energy Insight Offshore Operations Benchmarking Database; Oil & Gas UK Activity Surveys 1 Unweighted average of total lifting cost for 17 UKCS North Sea platforms (total cost, not cost per barrel) 2 Weighted average Annual inflation rates, 2000–14, Percent Big Mac 2.5 North Sea platform lifting costs1 12 UK lifting cost per barrel of oil equivalent, (2004–14)2 18
  • 14.
    13 #OM2015 The costchallenge in the UKCS Source: McKinsey’s Energy Insight Offshore Operations Benchmarking Database; Oil & Gas UK Activity Surveys 1 Unweighted average of total lifting cost for 17 UKCS North Sea platforms (total cost, not cost per barrel) 2 Weighted average Annual inflation rates, 2000–14, Percent Big Mac 2.5 North Sea platform lifting costs1 12 UK lifting cost per barrel of oil equivalent, (2004–14)2 18 UK development cost per barrel of oil equivalent, (2004–13)2 21
  • 15.
  • 16.
    15 #OM2015 The increasewas largely unforeseen Growth in operating cost forecast from UKCS operators, GBP billions Source: Oil & Gas UK 2012 Economic Reports and 2015 Activity Survey 2002/3 2003/4 2004/5 2008/9 2009/10 2011/12 2013 actual (8.9) 2014 actual (9.6) 01 2003 2005 2007 2009 2011 2013 2015 2017 2019 9.0 8.0 7.0 6.0 5.0 4.0 3.0 2.0 1.0 0.0 2010/11 2007/8 2005/6 2006/7
  • 17.
    16 #OM2015 Cost increasenot due to increased activity … Source: McKinsey Energy Insights Deck cargo shipped Tonnes +1.5%
  • 18.
    17 #OM2015 Cost increasenot due to increased activity … Source: McKinsey Energy Insights Deck cargo shipped Tonnes +1.5% Helicopter hours Hours +2.0% Wells drilled Number -4.0%
  • 19.
    18 #OM2015 … orhigher supplier margins Source: McKinsey Energy Insights 1 Margin as announced – adjusted for different accounting/disclosure policy. Sample includes 18 equipment, 13 EPC, 38 assets and 9 services companies EBITDA margin1 of OFSE companies, Percent 2012–14 2009–11 Assets EPCServices Equipment 10 19 23 39 8 18 22 36
  • 20.
    19 #OM2015 So whathas been behind the large cost increase? Source: McKinsey Energy Insights; “Meeting the challenge of increasing North Sea costs” McKinsey article 20%Increased activity
  • 21.
    20 #OM2015 So whathas been behind the large cost increase? Source: McKinsey Energy Insights; “Meeting the challenge of increasing North Sea costs” McKinsey article 40–50% 20% Increased unit cost Increased activity
  • 22.
    21 #OM2015 So whathas been behind the large cost increase? Source: McKinsey Energy Insights; “Meeting the challenge of increasing North Sea costs” McKinsey article 40–50% 20% 30–40%Greater inefficiency Increased unit cost Increased activity
  • 23.
    22 #OM2015 Opex example:integrity inspections cost Source: Sanitised client example Comparison of topsides integrity inspection costs per asset, GBP thousands per installation, gross 30% 20% 50% Year 1 Greater inefficiency Rate increase Increased activity Year 4 x 2.9
  • 24.
    23 #OM2015 Capex example:new greenfield developments Development cost, Index; 100 equal to full cost in year 2000 30% 20% 70% Actual costs 2000 Actual costs 2014 replica Source: Sanitised client example x 2.5 Greater inefficiency Rate increase Increased activity
  • 25.
    24 #OM2015 Something otherhighly technical industries appear to have avoided Nominal price inflation for a new commercial airliner Source: A2Mac1; manufacturer’s public data; Airline Monitor: McKinsey analysis +0.2–1.5% Nominal price inflation for a new car +1.0%
  • 26.
    25 #OM2015 Inspiration cancome from many sources Source: McDonalds, McKinsey Operations Practices Standards Training Auditing Workplace organisation
  • 27.
    26 #OM2015 Including theexisting organisation Source: McKinsey Upstream Operations Service Line Production, Indexed 110 90 10 0 70 80 100 120 8 100 2 12 14 16 242218 204 6 +12% Time hours 8 100 2 12 14 16 242218 204 6 -3%
  • 28.
    27 #OM2015 Some approachesare transformational Source: McKinsey Oil & Gas and RTS practices 5-year cumulative FCF impact, USD billions 4.5Total Reorganise around assets and talent De-risk and optimize major capital project Targeted production improvement External spend cost reduction Change in asset strategies
  • 29.
    28 #OM2015 Others relyon incremental gains 7/10 golds -50%
  • 30.
    29 #OM2015 The impactcan be enormous… SWN in the Fayetteville Shale Source: Southwestern Energy Investor Presentation 2015 Days to drill Lateral length 08 092007 11 201410 12 13 767 8 1112 14 18 1209 11 20141310082007 4,8194,836 4,528 4,100 3,619 2,657 5,4405,356
  • 31.
    30 #OM2015 …and rapid Source:Recent offshore example Offshore productivity, Earned hours per POB 13 1515 11 16 7 6 9 10 2014 ave. Week 5 Week 1 April Week 4 Mar Week 3 Feb Week 2 Start of program end April
  • 32.
    31 #OM2015 Initiatives likethis are starting to have an effect Source: Oil & Gas UK UKCS Opex, GBP billions, fields onstream 7.5 8.8 9.6 8.9 2013 2014 2015F 2016F -22%
  • 33.