This document introduces the American Association of State Highway and Transportation Officials (AASHTO) Load and Resistance Factor Design (LRFD) Bridge Design Specifications. It provides background on the development of bridge design standards in the US, from the original 1931 AASHO standard to the current 2002 edition. It notes a 1987 review found gaps and inconsistencies in the standard, and recommended adopting an LRFD philosophy which considers variability in loads and structural resistance, as other countries had done. AASHTO then developed this new LRFD Specifications as an alternative to the existing Standard Specifications, giving bridge engineers a choice of design standards.


![3-106 AASHTO LRFD BRIDGE DESIGN SPECIFICATIONS, SEVENTH EDITION, 2014
within the soil mass in accordance with Article 3.11.3.
Appropriate drainage provisions shall be provided to
prevent hydrostatic and seepage forces from developing
behind the wall in accordance with the provisions of
Section 11. In no case shall highly plastic clay be used for
backfill.
of lateral earth pressures assuming the most unfavorable
conditions. See Article C3.11.1 for additional guidance on
estimating earth pressures in fine-grained soils. If possible,
cohesive or other fine-grained soils should be avoided as
backfill.
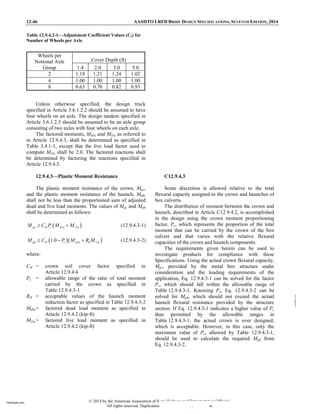
3.11.5.3—Active Lateral Earth Pressure
Coefficient, ka
Values for the coefficient of active lateral earth
pressure may be taken as:
2
2
( )
sin
[sin sin( )]
f
a
k
φ
= (3.11.5.3-1)
in which:
2
sin sin
1
sin sin
f f
( + ) ( )
= +
( ) ( + )
φ φ
(3.11.5.3-2)
where:
= friction angle between fill and wall taken as
specified in Table 3.11.5.3-1 (degrees)
β = angle of fill to the horizontal as shown in
Figure 3.11.5.3-1 (degrees)
= angle of back face of wall to the horizontal as
shown in Figure 3.11.5.3-1 (degrees)
φ f = effective angle of internal friction (degrees)
For conditions that deviate from those described in
Figure 3.11.5.3-1, the active pressure maybe calculated by
using a trial procedure based on wedge theory using the
Culmann method (e.g., see Terzaghi et al., 1996).
C3.11.5.3
The values of ka by Eq. 3.11.5.3-1 are based on the
Coulomb earth pressure theories. The Coulomb theory is
necessary for design of retaining walls for which the back
face of the wall interferes with the development of the full
sliding surfaces in the backfill soil assumed in Rankine
theory (Figure C3.11.5.3-1 and Article C3.11.5.8). Either
Coulomb or Rankine wedge theory may be used for long
heeled cantilever walls shown in Figure C3.11.5.3-1a. In
general, Coulomb wedge theory applies for gravity,
semigravityand prefabricated modular walls with relatively
steep back faces, and concrete cantilever walls with short
heels.
For the cantilever wall in Figure C3.11.5.3-1b, the
earth pressure is applied to a plane extending vertically up
from the heel of the wall base, and the weight of soil to the
left of the vertical plane is considered as part of the wall
weight.
The differences between the Coulomb theorycurrently
specified, and the Rankine theory specified in the past is
illustrated in Figure C3.11.5.3-1. The Rankine theoryis the
basis of the equivalent fluid method of Article 3.11.5.5.
Silt and lean clayshould not be used for backfillwhere
free-draining granular materials are available. When using
poorly draining silts or cohesive soils, extreme caution is
advised in the determination of lateral earth pressures
assuming the most unfavorable conditions. Consideration
must be given for the development of pore water pressure
within the soil mass in accordance with Article 3.11.3.
Appropriate drainage provisions should be provided to
prevent hydrostatic and seepage forces from developing
behind the wall in accordance with the provisions in
Section 11. In no case should highlyplastic claybe used for
backfill.
© 2014 by the American Association of State Highway and Transportation Officials.
All rights reserved. Duplication is a violation of applicable law.
TeraPaper.com
TeraPaper.com](https://image.slidesharecdn.com/coll-240321070357-42f5531c/85/LRFD-Bridge-Design-Specifications-AASHTO-2014-pdf-163-320.jpg)


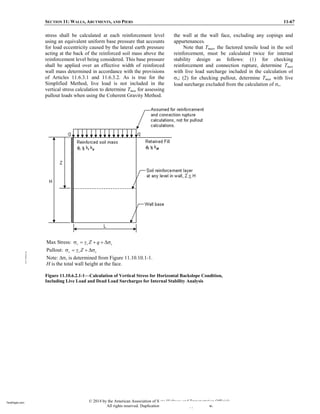
![SECTION 3: LOADS AND LOAD FACTORS 3-127
ks = coefficient of earth pressure due to surcharge
qs = uniform surcharge applied to the upper surface of
the active earth wedge (ksf)
For active earth pressure conditions, ks shall be taken
as ka, and for at-rest conditions, ks shall be taken as ko.
Otherwise, intermediate values appropriate for the type of
backfill and amount of wall movement may be used.
Wall movement needed to mobilize extreme active and
passive pressures for various types of backfill can be found
in Table C3.11.1-1.
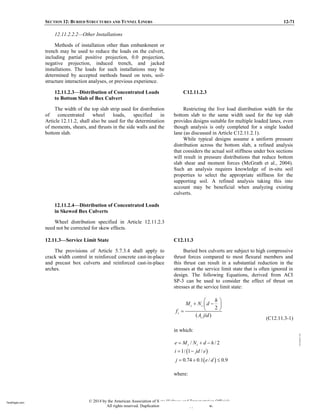
3.11.6.2—Point, Line, and Strip Loads (ES):
Walls Restrained from Movement
The hori ontal pressure, Δph in ksf, on a wall resulting
from a uniformly loaded strip parallel to the wall
may be taken as:
2
[ sin cos ( 2 )]
ph
p
= +
∆ (3.11.6.2-1)
where:
p = uniform load intensity on strip parallel to wall
(ksf)
= angle specified in Figure 3.11.6.2-1 (rad)
= angle specified in Figure 3.11.6.2-1 (rad)
Figure 3.11.6.2-1—Horizontal Pressure on Wall Caused by
a Uniformly Loaded Strip
The horizontal pressure, Δph in ksf, on a wall resulting
from a point load may be taken as:
2
2 3
1 2
3
ph
R
P ZX
R Z
R R
∆ = (3.11.6.2-2)
C3.11.6.2
Eqs. 3.11.6.2-2, 3.11.6.2-3, 3.11.6.2-4, and 3.11.6.2-5
are based on the assumption that the wall does not move,
i.e., walls which have a high degree of structural
rigidity or restrained at the top combined with an inability
to slide in response to applied loads. For flexible
walls, this assumption can be very conservative.
Additional guidance regarding the ability of walls to move
is provided in Article C3.11.1.
© 2014 by the American Association of State Highway and Transportation Officials.
All rights reserved. Duplication is a violation of applicable law.
TeraPaper.com
TeraPaper.com](https://image.slidesharecdn.com/coll-240321070357-42f5531c/85/LRFD-Bridge-Design-Specifications-AASHTO-2014-pdf-184-320.jpg)