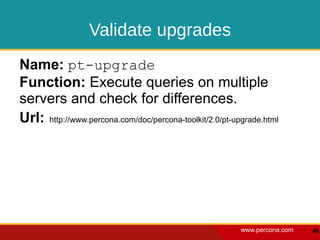
Download as PDF, PPTX


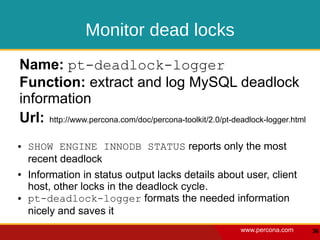
![Taking inventory
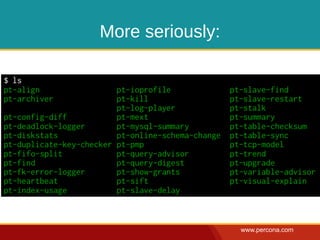
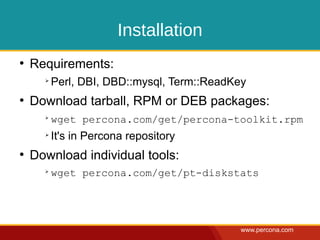
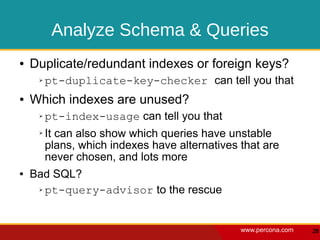
$ wget percona.com/get/pt-summary
$ chmod +x pt-summary
$ ./pt-summary
# Percona Toolkit System Summary Report ######################
Date | 2012-02-02 12:25:18 UTC (local TZ: EET +0200)
Hostname | db01
Uptime | 42 days, 16:14, 1 user, load average: 1.15, 1.22, 1.08
System | HP; ProLiant DL580 G7; vNot Specified (Rack Mount Chassis)
Service Tag | FOSDEM2012
Platform | Linux
Release | CentOS release 6.1 (Final)
Kernel | 2.6.32-131.21.1.el6.x86_64
Architecture | CPU = 64-bit, OS = 64-bit
Threading | NPTL 2.12
Compiler | GNU CC version 4.4.5 20110214 (Red Hat 4.4.5-6).
SELinux | Disabled
Virtualized | No virtualization detected
# Processor ##################################################
Processors | physical = 4, cores = 40, virtual = 80, hyperthreading = yes
Speeds | 80x2397.393
Models | 80xIntel(R) Xeon(R) CPU E7- 4870 @ 2.40GHz
[ Further output omitted ]
www.percona.com 14](https://image.slidesharecdn.com/loadays-managingmysqlwithperconatoolkit-120401161958-phpapp02/85/Loadays-managing-my-sql-with-percona-toolkit-14-320.jpg)
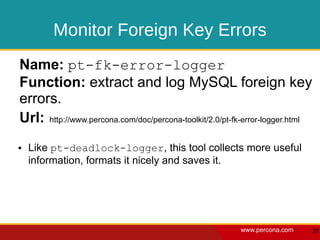
![Taking inventory (cont.)
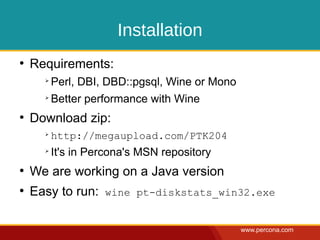
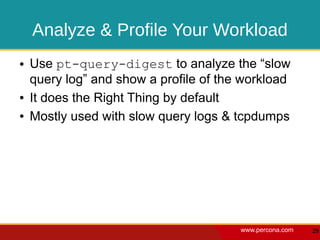
$ wget percona.com/get/pt-mysql-summary
$ chmod +x pt-mysql-summary
$ ./pt-mysql-summary
# Percona Toolkit MySQL Summary Report #######################
System time | 2012-02-02 12:24:37 UTC (local TZ: EET +0200)
# Instances ##################################################
Port Data Directory Socket
===== ========================== ======
/mysql
# Report On Port 3306 ########################################
User | root@localhost
Time | 2012-02-02 14:24:38 (EET)
Hostname | db01
Version | 5.5.18-55-log Percona
Built On | Linux x86_64
Started | 2011-12-26 21:09 (up 37+17:15:35)
Databases | 6
Datadir | /mysql/
Processes | 10 connected, 4 running
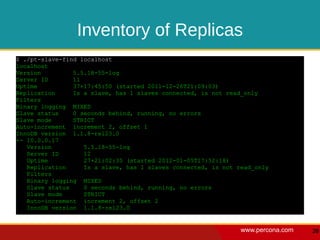
Replication | Is a slave, has 1 slaves connected
Pidfile | /mysql/mysqld.pid (exists)
[ Further output omitted ]
www.percona.com 18](https://image.slidesharecdn.com/loadays-managingmysqlwithperconatoolkit-120401161958-phpapp02/85/Loadays-managing-my-sql-with-percona-toolkit-18-320.jpg)
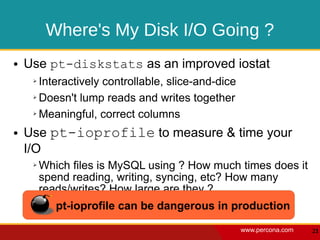
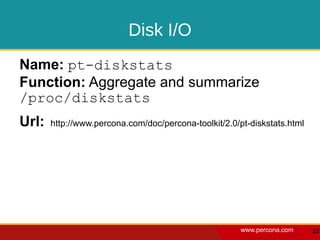
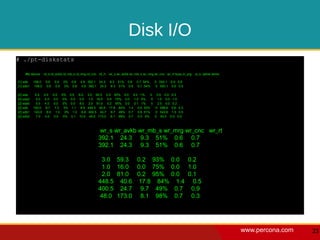
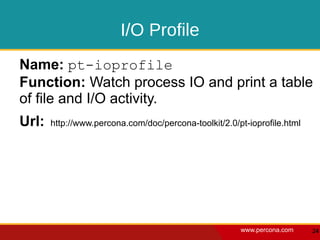
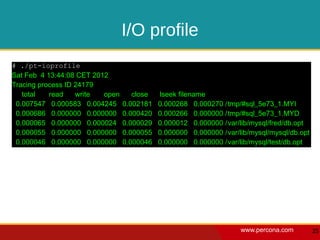


Percona Toolkit includes tools for monitoring and optimizing MySQL performance. Pt-diskstats summarizes disk I/O statistics from /proc/diskstats in an interactive table, showing read and write rates, sizes, and other metrics for each disk or partition. Pt-ioprofile measures I/O usage to identify which files MySQL is accessing and how it spends time reading, writing, and syncing data. These tools help administrators understand where disk I/O is going and identify opportunities to optimize storage usage.


![[CB20] Vulnerabilities of Machine Learning Infrastructure by Sergey Gordeychik](https://cdn.slidesharecdn.com/ss_thumbnails/sergeygordeychikcb20-210112133639-thumbnail.jpg?width=640&height=640&fit=bounds)