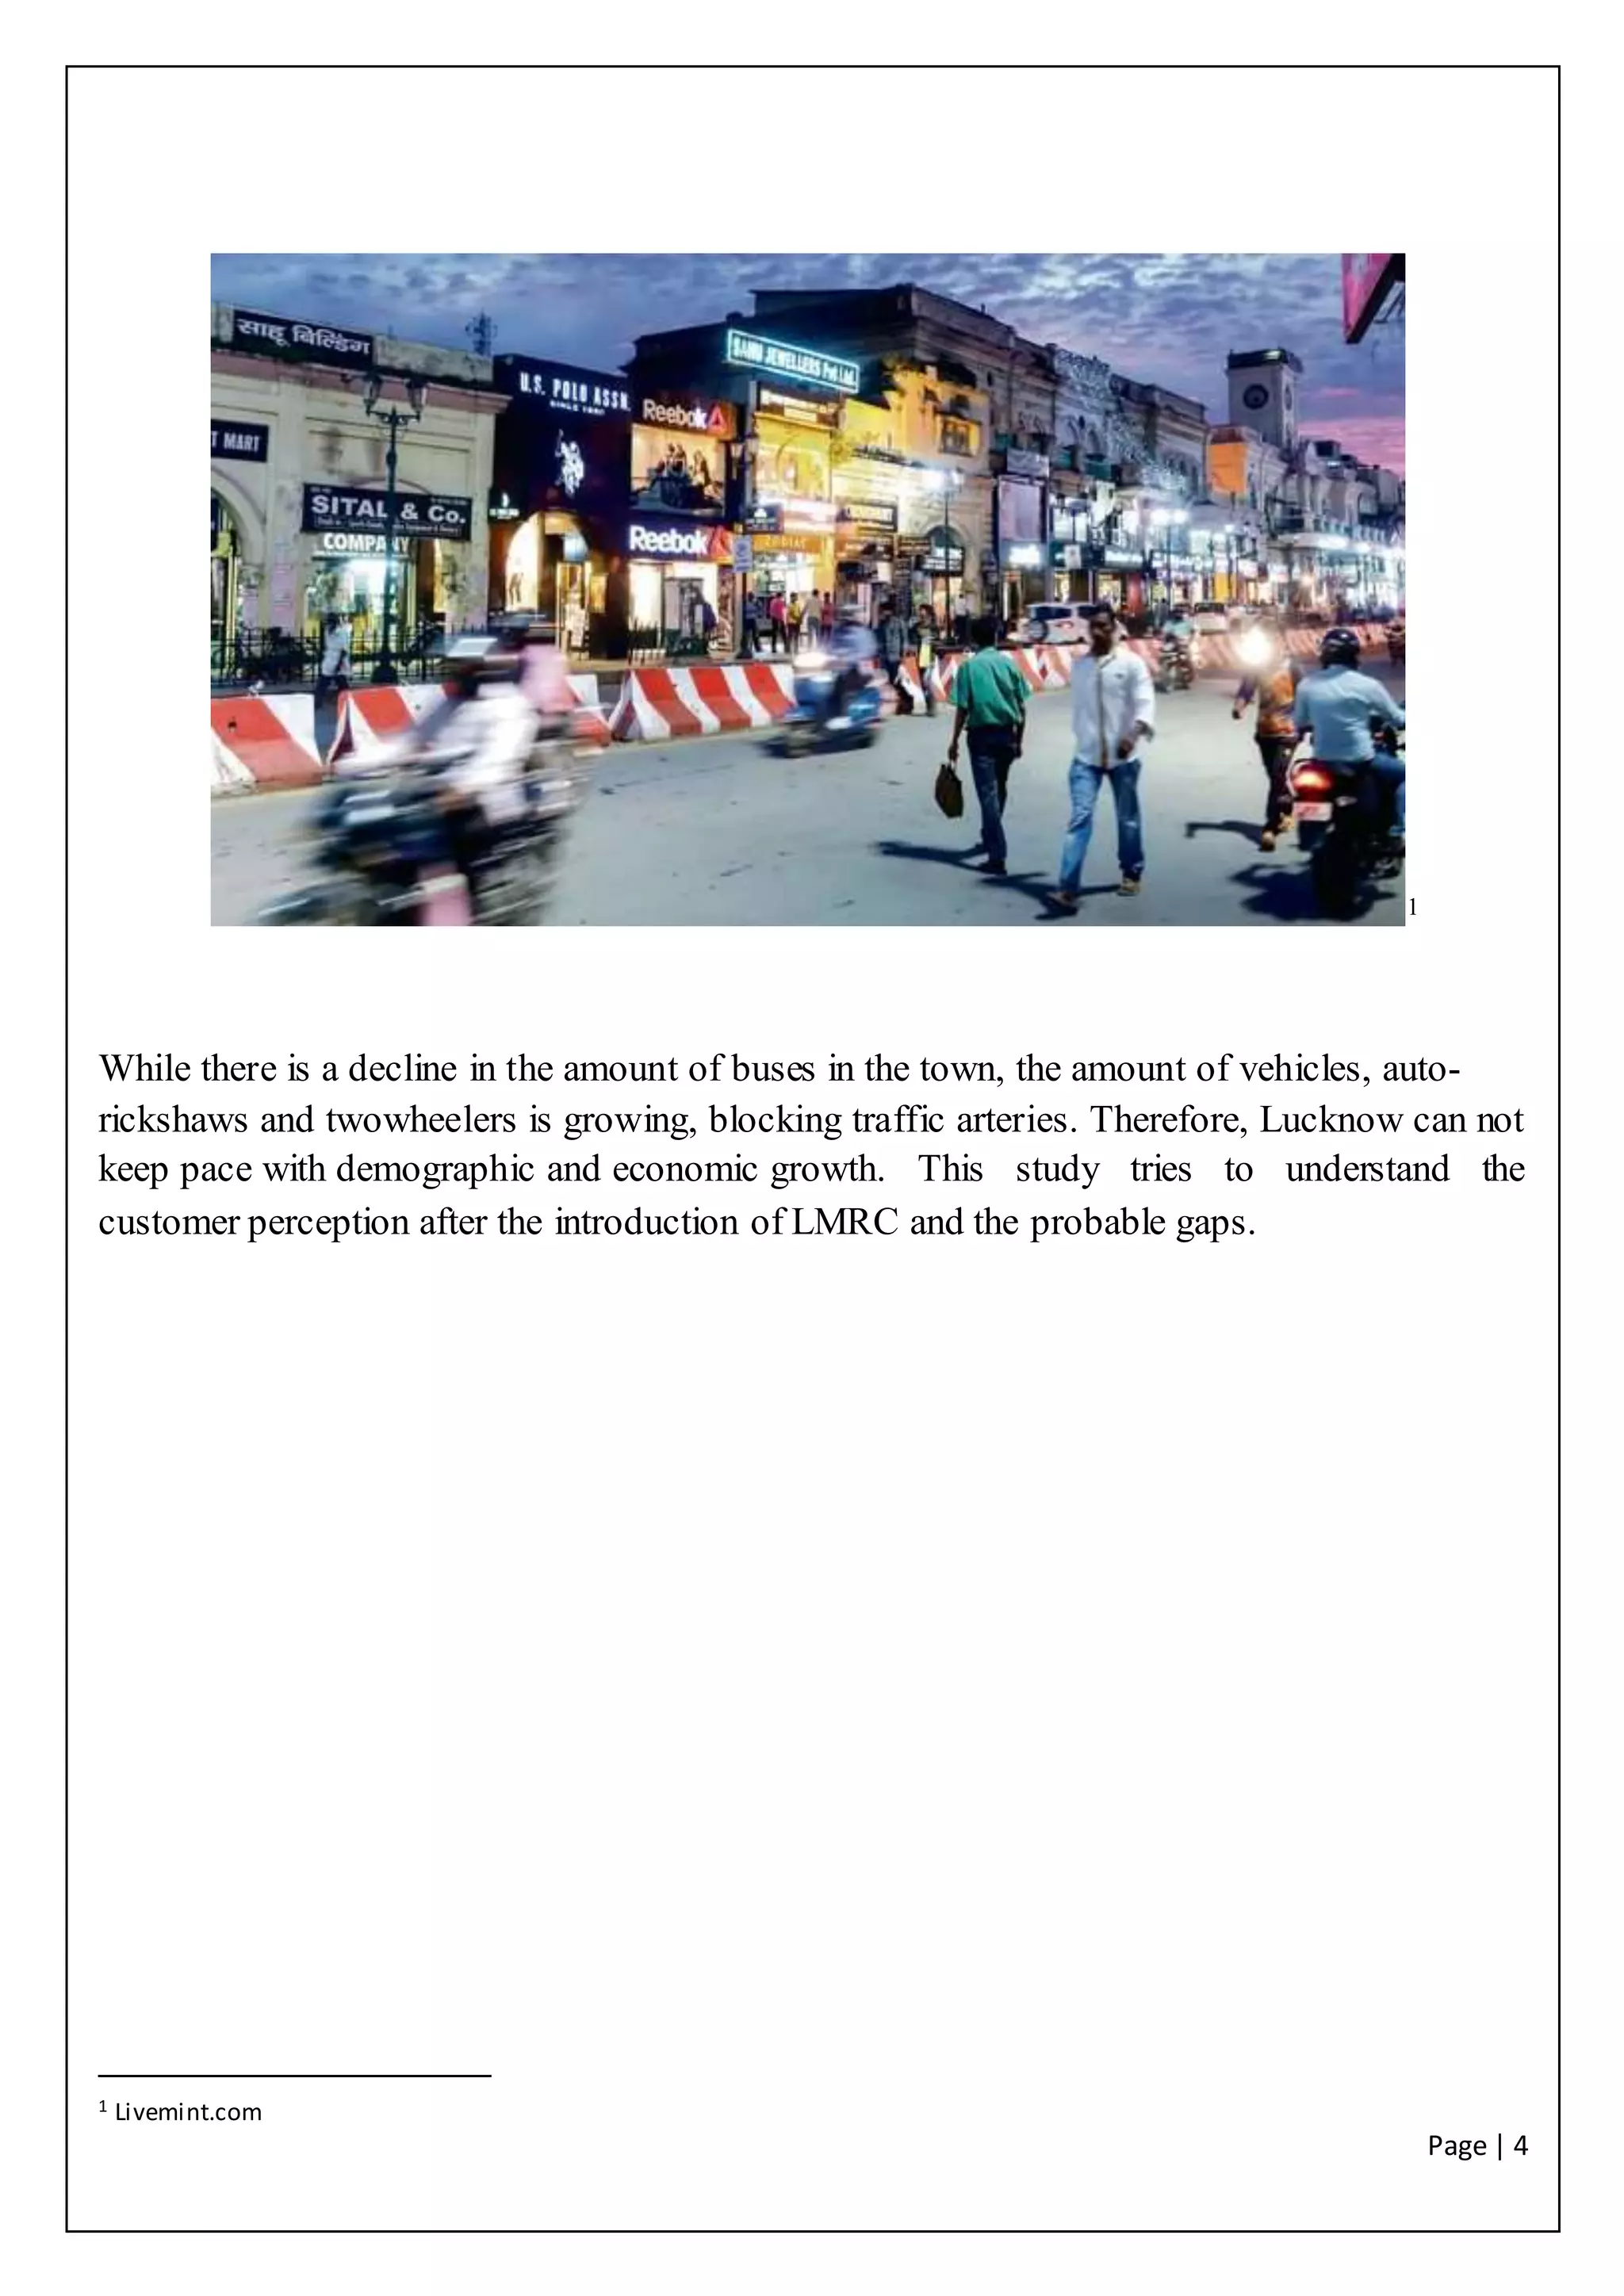
2. Page | 2
PREFACE
A significant metropolitan city, Lucknow City has witnessed increasing pressure on its
transport infrastructure. Over the past two decades, the City has seen tremendous population
growth. Covering 310 sq. area. The government capital has 14.24 lakh cars and is
experiencing an annual increase of 10-15% in the population of cars.
Due to congestion and pollution, the town is gasping for breath and the lack of any
appropriate mode of public transport on many of the paths has created a feeling of desperatio
n among the inhabitants.
The Lucknow Metro Rail Project is a ray of hope in and around the city for individuals and
the environment. The project seeks to provide Lucknow's residents and tourists with a world-
class Mass Rapid Transit System that is convenient, sage, quick and reliable, but also cost-
effective and environmentally friendly.
The study is aimed at understanding and predicting the effect the Metro Rail Service will
have on Lucknow City's transportation scheme.
We surveyed a number of individuals at important traffic places where Metro Stations were
suggested by the government. This research's Respondents / Customers are the daily
commuters facing the city's dismal traffic circumstances.
This is an unstructured problem and we learned about people's consciousness and responses
to the Metro project and how they feel that the Metro service would impact Lucknow City's
general transportation system.
3. Page | 3
INTRODUCTION
The quality and amount of infrastructure supplied are quite often controlled by economic
growth and spatial development. While insufficient transportation facilities cause congestion,
important socio-economic costs to society lead from delays and dangers. The key to
scheduled growth is to provide and maintain an ideal level of infrastructure. India is going
through a phase of urbanization. Lucknow is well recognized for its cultural and intellectual
traditions as well as its current status as a core of service industry, education and research.
As a major cultural and commercial centre, Lucknow continues to develop and attract big
numbers of individuals to the town. It is the biggest town in the state of Uttar Pradesh, India
and the second biggest town in the north.
Over the past two decades, the City has seen tremendous population growth. According to th
e 2011 India census, the Lucknow Urban Agglomeration population was 29 lakhs. Lucknow
Metropolitan Area's population was over 50 lakhs.
The fast development of the town and the related urban sprawl has accentuated the lack of de
mand supply in the midst of the restricted transport infrastructure arising in financial and
social externalities.
Covering 310 sq. area. Km, the capital of the country had 14.24 lakh vehicles, 80% of which
were twowheelers and 14% cars. The share of government transport in the town is only 10%.
Around 94 percent of the registered cars in the city are private ownership.
For the size of a city like Lucknow, the supply of city busses being only 6 per every lakh per
son is inadequate. The benchmark ranges from 70 to 80 buses per lakh resident in India's urb
an area. The number of autorickshaws is 4,343 (as in 2014) and the number of tempo taxis is
2,534 (as in 2014).
In addition, the amount of vehicles hitting the Lucknow highways is growing by an average
of 10-15 percent each year, while two-wheelers are rising by 8-10 percent as many
individuals choose two-wheelers rather than four-wheelers to escape traffic. The traffic load
on Lucknow Roads alone improved by 52.21% in 2006-08, much greater than the domestic
average of 20%.
4. Page | 4
1
While there is a decline in the amount of buses in the town, the amount of vehicles, auto-
rickshaws and twowheelers is growing, blocking traffic arteries. Therefore, Lucknow can not
keep pace with demographic and economic growth. This study tries to understand the
customer perception after the introduction of LMRC and the probable gaps.
1 Livemint.com
5. Page | 5
PRESENT TRAFFIC SITUATION
As stated previously, the city's share of government transport is only 10%. Around 94
percent of the registered cars in the city are private ownership. For the size of a city like
Lucknow, the supply of city busses being only 6 per every lakh person is inadequate. The
benchmark ranges from 70 to 80 buses per lakh resident in India's urban area. The number of
auto-rickshaws is around 4,343.
In addition, the number of vehicles hitting the Lucknow highways increases by an average of
10percent each year, while twowheelers increase by an average of 8 percent each year2
.
3
In addition, many SUVs are sold in town each year and permits are readily given. These
SUVs occupy much of the highway while moving, causing frequent jams, and secondly, they
are often driven at elevated speeds.
Inadequate and defective planning is an even larger issue. Old planning has led to chaos and
traffic jams as the town has centralized all job centers and political and commercial hubs.
One can discover the opening of both residential and commercial units at the same location.
2 https://uppolice.gov.in/frmUnitOfficials.aspx?traffic
3 Patrika .com
6. Page | 6
LMRC AS A SAVIOUR
One of the main problems to be addressed here was improvising on a reliable public transpor
t system; above all, focusing on a mass transportation system that would be environmental
friendly; addressing the increasing requirements of city travel to maintain the increasing
financial activity. Against this background of a growing amount of road and congestion and
airpollution cars, the Lucknow Development Authority (LDA) ordered the Delhi Metro Rail
Corporation (DMRC) to prepare a detailed Mass Rapid Transit System (MRTS) Project Rep
ort for Lucknow City and the Lucknow Metro Rail Project was suggested by the Uttar
Pradesh government in 2008.
4
4Source: LMRC website
8. Page | 8
As of 2019 January the number of Metro riders has come down significantly by more than
42% since the launch of Lucknow’s showpiece MRTS.
6
The present statement suggests that LMRC is in a loss making scenario. As pre-conceived
that profitability has a direct linkage to customer preference for the service, the researcher
has only concentrated on the reasons behind the lack of effectiveness of LMRC service on
the minds of the daily commuters and why there is the lack of usage. Researcher wants to
understand the reason behind such figures.
6 TOI report, May 2019
9. Page | 9
RESEARCH METHODOLOGY
This part deals with the research design, the tools used and the scientific investigation
beyond the study. It discusses the sampling techniques used for collection and investigation
of data. The research adopted Descriptive Research Design with non-probabilistic sampling
design conducted from 100 commuters in various stations. Data was collected from primary
as well as secondary sources
Sampling Area:
Lucknow City
SelectionofConsumer:
100 commuters were selected randomly who visited the stations at different times.
Method of Enquiry and data collection:
The study is based on primary data. Well-structured interview was conducted for sample
survey at the store for collection of primary data. Details of demographic characteristics,
attitude, belief and perception towards the metro services was inculcated in the
questionnaire.
StatisticalTools Used:
Few statistical tools were used to convert the research findings into concrete results that are
listed below.
(1)Frequency, Percentage.
(2)Principal Component Analysis
10. Page | 10
Questionnaire on LMRC
Q1. Age:
i) 14-18
ii) 18-30
iii) 30-40
iv) Above 40
Q2. Gender:
i) Male
ii) Female
Q3. Read the questions carefully and tick on the appropriate choice:
S.
No.
Particulars Strongly
Agree
Agree Neutral Disagree Strongly
Disagree
1. Adequate feeder bus services are
available
2. Connectivity to major places
3. Frequency is sufficient
4. Reduces overall travel time
5. Economical
6. Smart card facility is available
7. Separate coaches for women
8. LMRC provides easy parking
facility
9. Seats are reserved for handicaps,
and senior citizens
10. Friendly Staff
11. Maintains good standard of
cleanliness at station
12. Timely information of delays and
breakdowns
13. Display screen in the coaches
provide correct information
14. Proper mobile network inside the
coaches
11. Page | 11
KMO AND BARTLETT’S TEST:
The KMO test suggests a value of 0.640 which is greater than 0.50 and so we can proceed
with the test, and significance value of 0.00 so the data adequacy test has passed and we can
go on with the analysis.
Kaiser-Meyer-Olkin Measure of Sampling Adequacy. 0.640
Bartlett's Test of
Sphericity
Approx. Chi-Square 252.642
df 91
Sig. 0.000
TOTAL VARIANCE EXPLAINED: The cumulative variance was 68.074 which states that
68% of the total consumer preference can be explained by these 6 factors, where factor 1
contributed the maximum variance of 21% and also from the descriptive statistics table we
find that the mean value is highest at 3.97 so people think that adequate feeder bus service is
not available.
Rotated Component Matrix
Component
1 2 3 4 5 6
Feeder_Bus_Services .612
Major_Places_Connectivity .712
Sufficient_Frequency .848
Travel_time_Reduction .841
Economical .898
Smart_Card_Available
Seperate_women_coaches
Parking_facility .829
Reserved_seats .640
Friendly_Staff
Cleanliness .868
Timely_info_Delays .833
Info_display_inside_coaches
Mobile_Network_inside_coach .678
12. Page | 12
The scree plot suggests that there is a sharp bend on Component Number 2 at Eigen value above 1 and this
contributes to the largest variance from factor 1.
Factor1 has heavy loading on Travel time reduction renamed as “FasterCommute”.
Factor 2 has heavy loading on feeder bus service, parking facility and mobile network
inside coachrenamed as “ExtendedServices”.
Factor 3 has heavy loading on major places connectivity and sufficient frequency
renamed as “Convenience”.
Factor4 has heavy loading on reserved seat and cleanliness and can be renamed as
“Basic Services”.
Factor5 has heavy loading on Economical and can be termed as “Value for Money”.
Factor 6 has heavy loading on Timely Information of delays and breakdowns, which
can be renamed as “Communication”.
13. Page | 13
CONCLUSION AND RECOMMENDATION:
From the descriptive statistics table we find that the mean value is highest at 3.97 so
people think that adequate feeder bus service is not available. Also, parking facility
and mobile network inside coach a part of extended service are wanted by the
commuters. In the scorching heat months of May June we thus see a plunge in people
opting metro services who generally prefer radio cabs at that time.
Commuters are finding travelling through Lucknow Metro less economical and want
revised ticket fare.
Major areas like Gomti Nagar, Aminabad, Ashiyana are still left to be connected by
the LMRC.
People are also stressing on connectivity to major places and frequency. LMRC is
already working for extension of Vasant Kunj- Charbagh line though the frequency at
night time may be increased.