Downloaded 12 times
![Labor Market Information/LMI: How to Demystify Labor Market & Economic Statistics Tuesday, June 29, 2010 Presentation by Gary Crossley to the IAWP 97 th Educational Conference 2Work www.LovetoWork.org [email_address] Phone -- 843/452-4121](https://image.slidesharecdn.com/lmidemystify62910-12781325512034-phpapp01/85/Lmi-Demystify62910-1-320.jpg)


![Labor Market Information/LMI: How to Demystify Labor Market & Economic Statistics Questions and State Sharing 2Work www.LovetoWork.org [email_address] Phone -- 843/452-4121](https://image.slidesharecdn.com/lmidemystify62910-12781325512034-phpapp01/85/Lmi-Demystify62910-50-320.jpg)

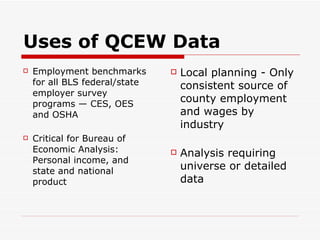
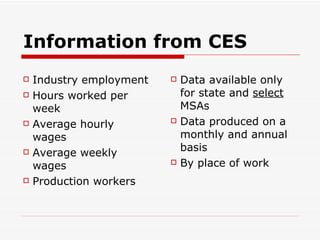
The document presents a detailed overview of Labor Market Information (LMI), focusing on various statistics and programs from the Bureau of Labor Statistics, including the Quarterly Census of Employment and Wages, Current Employment Statistics, and Local Area Unemployment Statistics. It addresses the methods and sources of data collection, the significance of understanding labor market trends, and the importance of communication between data providers and users. Additionally, it highlights the impact of LMI on economic assessment and policy-making, emphasizing collaborative efforts to enhance workforce information dissemination.


