- LITASCO SA presentation on international oil market and oil trading trends
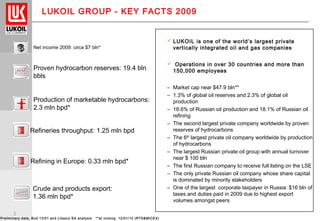
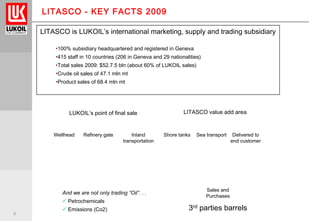
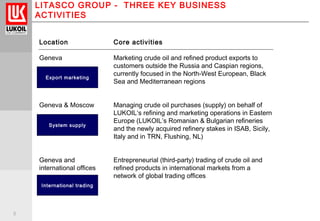
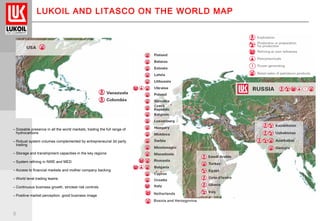
- LITASCO is LUKOIL's international marketing, supply, and trading subsidiary based in Geneva
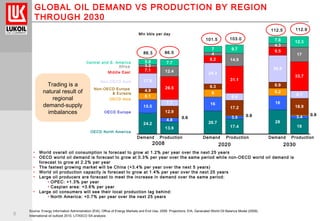
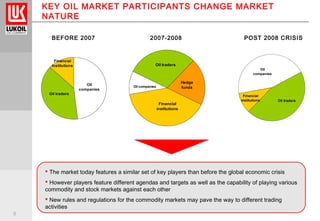
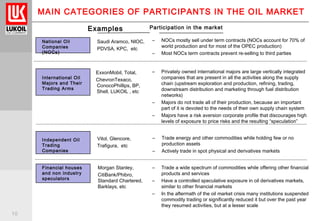
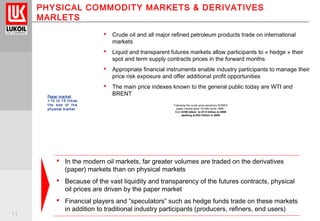
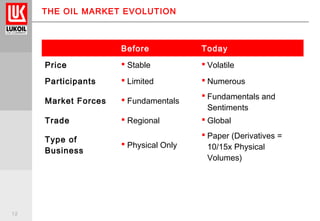
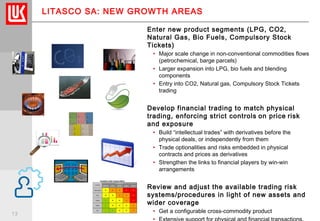
- The presentation covers LITASCO and LUKOIL's operations, the roles of various participants in the oil market, and how the market has evolved from predominantly physical trading to also including significant paper or derivatives trading