Listed European real estate: solid return prospects continue
•
1 like•268 views

The 3 dedicated listed European real estate managers of Degroof Petercam Asset Management look into the return prospects for this asset class.

Recommended
More Related Content
What's hot
What's hot (20)
Similar to Listed European real estate: solid return prospects continue
Similar to Listed European real estate: solid return prospects continue (20)
More from Jurgen Vluijmans
More from Jurgen Vluijmans (14)
Recently uploaded
Recently uploaded (20)
Listed European real estate: solid return prospects continue
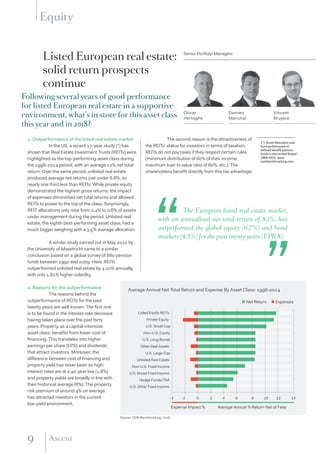
- 1. 9 Ascent9 Ascent 1. Outperformance of the listed real estate market In the US, a recent 17-year study (*) has shown that Real Estate Investment Trusts (REITs) were highlighted as the top-performing asset class during the 1998-2014 period, with an average 12% net total return. Over the same period, unlisted real estate produced average net returns just under 8.6%, so nearly one third less than REITs. While private equity demonstrated the highest gross returns, the impact of expenses diminished net total returns and allowed REITs to power to the top of the class. Surprisingly, REIT allocations only rose from 0.4% to 0.6% of assets under management during the period. Unlisted real estate, the eighth best-performing asset class, had a much bigger weighing with a 3.5% average allocation. A similar study carried out in May 2012 by the University of Maastricht came to a similar conclusion based on a global survey of 880 pension funds between 1990 and 2009. Here, REITs outperformed unlisted real estate by 4.20% annually, with only 1.81% higher volatility. 2. Reasons for the outperformance The reasons behind the outperformance of REITs for the past twenty years are well known. The first one is to be found in the interest-rate decrease having taken place over the past forty years. Property, as a capital-intensive asset class, benefits from lower cost of financing. This translates into higher earnings per share (EPS) and dividends that attract investors. Moreover, the difference between cost of financing and property yield has never been so high: interest rates are at a 40-year low (1.8%) and property yields are broadly in line with their historical average (6%). The property risk premium of around 4% on average has attracted investors in the current low-yield environment. The second reason is the attractiveness of the REITs' status for investors in terms of taxation. REITs do not pay taxes if they respect certain rules (minimum distribution of 80% of their income, maximum loan to value ratio of 60%, etc.). The shareholders benefit directly from this tax advantage. Listed European real estate: solid return prospects continue Following several years of good performance for listed European real estate in a supportive environment, what’s in store for this asset class this year and in 2018? Olivier Hertoghe Damien Marichal Vincent Bruyère Equity Senior Portfolio Managers Listed Equity REITs Private Equity U.S. Small Cap Non-U.S. Equity U.S. Long Bonds Other Real Assets U.S. Large Cap Unlisted Real Estate Non-U.S. Fixed Income U.S. Broad Fixed Income Hedge Funds/TAA U.S. Other Fixed Income Expense Impact % Average Annual % Return Net of Fees -4 -2 0 2 4 6 8 10 12 14 Net Return Expenses Source: CEM Benchmarking. 2016 Average Annual Net Total Return and Expense By Asset Class: 1998-2014 The European listed real estate market, with an annualised net total return of 8.1%, has outperformed the global equity (6.7%) and bond markets (4.5%) for the past twenty years (EPRA). (*) “Asset Allocation and fund performance of defined benefit pension funds in the United States”, 1998-2014. www. cembenchmarking.com “ “
- 2. 10 Ascent Equity Yet another reason comes from the capacity of managers of real estate companies to add value by buying undermanaged buildings with great potential, and then repositioning and selling them at a much lower cap rate. An example here is cheap and under- occupied assets with rents lower than the market that are outdated but also well located. The best managers are able to refurbish and reposition the buildings, attract new tenants, increase rents offer new services and a new experience to clients. They then take their profit by selling at a high price to low-yield requirement investors. This operational leverage has usually been combined with lowering the cost of financing on the liabilities side of the balance sheet. 3. Where does the listed real estate sector stand today? Macro level Macro sentiment is dominating the view and here Europe still has to deal with its political divisions and structural challenges. These continue to weigh on longer-term economic growth. Also, monetary stimulus is losing its effect but is set to continue this year. In this connection, 2017 could be a year of transition. Valuation The listed sector is in much better shape than during the crisis of 2008: many companies have changed their management team, improved their governance, cleaned up their balance sheet and optimised their portfolios. The underlying asset valuations do not appear overly stretched at this point of the cycle, but earnings need to improve to defend the market level. The European listed real estate sector is currently trading at a 10% discount compared to the expected net asset value for December 2018. The UK is trading at an even higher discount, reflecting a more near-term turn in the cycle. The 10% net asset value (NAV) premium for the continent has come down to 1% over 2016, and it may even move lower towards the end of the cycle. Companies are defensive in their valuation of portfolios, and we therefore think that net asset values should go up. Overall, the sector still offers high single-digit total return expectations (dividend yield of circa 4% and annual NAV growth of around 3%). The property yield risk premium remains high and increased further over 2016. It should provide a cushion to absorb a potential rise in interest rates. Moreover, part of the sector should still see good support for earnings growth attributable to the possibility of refinancing debt at lower rates. The real estate sector no longer has the lowest cost of capital, and after years of re-rating the outlook for the cost of capital will be the main focus in 2017. Also, markets might once again become volatile due to upcoming elections, and this may offer good entry points. Another important element to bear in mind is the reduction of leverage, which reduces the inherent risk of the sector. Weighted average loan-to- value ratio in Europe is now at 41%, down from 55% during the crisis in 2007. Certain more leveraged firms, such as the Nordic property companies, may find it challenging to deal with potential yield expansion given their relatively high starting loan-to- value ratio. Nevertheless, the vast majority of the sector appears to be in good shape and could handle a scenario whereby capital values turn negative. 0 2 4 6 8 10 12 14 16 18 Q1 1979 Q1 1984 Q1 1989 Q1 1994 Q1 1999 Q1 2004 Q1 2009 Q1 2014 CBRE average property yield (UK) UK Gilts 10Y yield Source: Thomson Reuters Datastream - DPAM Figure 7: Property yields still comfortably above bond yields
- 3. 11 Ascent11 Ascent 4. Conclusions Over the past few years the listed European property sector has benefited from the tailwinds of a continued fall in the cost of capital. This has pushed up NAVs through yield shift, creating room for substantial interest cost savings by refinancing debt ahead of schedule and masking the cost to NAV of this with yield shift. It has allowed for accretive external growth by way of new equity issues and cheap new debt to finance acquisitions. Most of the sector used this support wisely to de-lever balance sheets, extend debt maturities and rationalise portfolios by getting rid of non-core assets. As a result the sector is generally in healthy shape and 2016 results were quite good. Surveyors are still defensive and cautious in valuing the assets, and net asset values should remain strong. If long-term interest rates start to move upwards it will be more challenging for real estate companies, but listed property companies appear well prepared to face such a potential scenario. After several years of strong absolute and relative performance, listed real estate took a break in 2016 following Brexit in June and the rise in bond yields in Q3 2016. Following a steep relative correction and given prevailing solid fundamentals, we believe we can be constructive again regarding the sector going forward, with high single-digit returns for the next two years. 5. DPAM listed European Real Estate fund managers’ team Our real estate fund managers’ team has demonstrated its capacity to continuously outperform the sector over the past seventeen years. In 2016, the European and eurozone funds we manage were once again among the best performers in Europe, compared both to benchmarks and to peers. We continue to look for investments with a good risk return, and continue to focus on quality for its low cost of capital and accretive acquisition potential. We look for strong balance sheets, average long lease duration and strong tenants. Moreover, we still find pockets of above-average growth in cash flow and NAV and favour such companies as long as we trust the management and see that the implementation of their strategy is according to plan. In a moving interest rate environment, we are convinced that our main criterion of looking for companies generating healthy growth in cash flow per share continues to be the right one. This criterion should result in attractive total shareholder returns, being dividend yield + NAV growth (%).