Downloaded 11 times
![Final Linked Media Layer and Evaluation D2.7
3 Content annotation evaluation
For content annotation, the following systems were subject to evaluation:
– Recognyze is a jointly developed system between several universities (Chur, WU, Modul) and
the webLyzard company. Recognyze uses a set of SPARQL profiles, dictionaries, disambiguation
algorithms and Linked Data dumps of well-known knowledge bases.
– Entity Expansion is a service that aims to return a ranked list of entities that fully describe a
newscast and its context. This list of entities come from the transcript of the seed video as well as
from relevant documents retrieved using the Google Custom Search Engine.
– THD entity annotation tool is an unsupervised entity discovery and classification system, which
uses a purpose-built Linked Hypernyms Dataset to provide extended type coverage in addition to
DBpedia and YAGO knowledge bases. For THD, we report the results of its named entity detection
(spotting), linking and salience computation components. The type quality in the THD’s Linked
Hypernyms Dataset is evaluated separately.
3.1 Recognyze evaluation
Modul University has replaced STI International in the consortium. Recognyze is a Named Entity Res-
olution tool [55], jointly developed between several universities (Modul University, HTW Chur, Vienna
University of Economics and Business) and the webLyzard company. Since Modul joined the consor-
tium we decided to also evaluate Recognyze in this package even though it was not initially part of the
plan.
Recognyze uses a set of SPARQL profiles, dictionaries, disambiguation algorithms and Linked Data
dumps of well-known knowledge bases (DBpedia, Geonames, etc.) in order to perform disambiguation,
ranking and linking of the named entities found in a text. It was initially developed for German and
English NER tasks with a focus on the main entity types (Person, Location, Organisation), but it is
currently extended to support multiple languages (including French, Russian, Arabic, Chinese, etc.) and
additional entity types (Event, Product, Works of Art, etc.). In order to extend it for a new language, a
user has to provide new knowledge base dumps and dictionaries for that language, and in some special
cases, new disambiguation algorithms.
We have decided to evaluate Recognyze on RBB content (chapers extracted from live news), as
due to the regionality of the content (news from Berlin-Brandenburg area focused on floods, highways,
immigration, local derbys, local administration, or LGBT rights), the frequent use of shortened names
for entities instead of the official names, and the language differences between the written German from
newspapers or blogs and the German spoken in televion shows, the RBB content is much harder to
disambiguate than the news media articles taken from newspapers or press agencies. Due to the way
Recognyze was built, the insights obtained from such evaluations can be used to create much better
lexicons or profiles, and these will be addressed in a future publication. We have not performed this
evaluation in order to replace the established LinkedTV approach, but rather to examine if we can bring
some improvements to it.
3.1.1 RBB annotated corpus
For evaluating our NER tool we have decided to create a larger corpus from subtitles extracted from news
video chapters. The RBB corpus contains 80 documents that represent anonymized subtitles extracted
from the RBB news show Abendschau (daily news show broadcasted between 19:30 and 20:00 CET).
We have extracted the subtitles from several hundreds of video fragments from the RBB index1
and created a corpus by importing them into GATE. We have used two annotators that were asked to
manually annotate the videos and provide the following information: surface forms, entity types, German
DBpedia links for the entities wherever this was possible (as expected, not all entities were present in
the German version of DBpedia). An expert was involved in assessing the quality of the agreement for
typing and linking. All the documents contain at least one entity, but not necessarily any links, as there
are at least several situations where even though the entities were quite clear for the annotators, they
were not able to find any good links for them in the German version of DBpedia. The average duration
of the clips was 132.45 seconds. The documents contained an average of 5.66 links available in the
1http://data.linkedtv.eu/solr/#/RBBindex
© LinkedTV Consortium, 2015 9/69](https://image.slidesharecdn.com/linkedtvd2-150715090538-lva1-app6891/85/LinkedTV-Deliverable-2-7-Final-Linked-Media-Layer-and-Evaluation-9-320.jpg)
![Final Linked Media Layer and Evaluation D2.7
German version of DBpedia for an average of 8.85 entities per document. Table 2 and Table 3 present
the inter-annotator agreements for types and links for the 80 documents that were manually annotated.
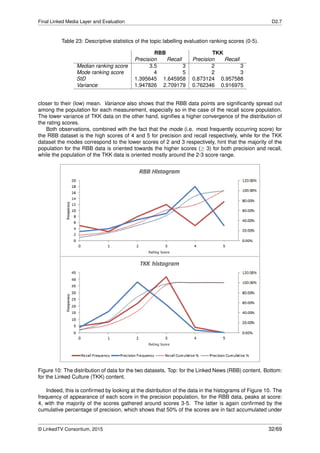
Table 2: Type agreements for current RBB ground truth
Document Agreed Total Observed agreement Cohen’s Kappa Pi’s Kappa
Macro summary 0.9850 0.9766 0.9764
Micro summary 708 720 0.9833 0.9764 0.9764
Table 3: URI agreements for current RBB ground truth
Document Agreed Total Observed agreement Cohen’s Kappa Pi’s Kappa
Macro summary 0.8926 0.8802 0.8746
Micro summary 453 518 0.8682 0.8666 0.8665
The corpus contains subtitles that cover a wide range of topics: sports, politics, entertainment,
weather, disasters, immigration, healthcare, etc. Most of the news are focused on the area Berlin-
Brandenburg. The disambiguation has been done in context. Therefore, a set of entities that might
not have made any sense otherwise (people designated by a function and just family name, for exam-
ple) were easier to disambiguate by the humans annotators since they knew that there are really good
chances that the respective entity is related to the Belin-Brandenburg area (if you know it is a person
and that it is the minister of Berlin land and a simple Google query does not help you find it, you are
still allowed to look on the list of current people who are in office to find the right link, for example). The
annotators used a simple ontology to annotate the corpus that contained the following types: Person, Or-
ganization, Location, Event, Product, Work, Miscellaneous (for all the other important objects that could
not be classified in the previous types), and followed the conventions explained in annotation guideline
provided to them before the tasks. The version of German DBpedia that was used for link collection
is the one that is currently online2, but the evaluations were done using the last available dump from
DBpedia 20143.
3.1.2 Evaluation results
We have evaluated German profiles of Recognyze against the RBB ground truth. The results are pre-
sented in Table 4. Since the location profiles we use tend to be based on Geonames, we have converted
DBpedia URIs that represent locations to Geonames URIs in post-processing. We first collected the link
for the equivalent English entity and through a second SPARQL query collected the equivalent Geon-
ames. For people and organizations, we have used the DBpedia URIs that were present in the gold
standard.
The results for organization profiles are really bad if we consider the fact that Recognyze has per-
formed much better in similar evaluations done on news media articles (see [55]). The difference,
here, will be the fact that the corpus contains many local organizations for Berlin or Brandenburg, and
Recognyze was not optimized for them. Due to the fact that in many of the documents, we can find lots
of persons identified by a function and their family name (almost half of them) and that Recognyze was
not yet optimized to find such persons, we find the results obtained for persons really good.
While the location results look bad, the real results are much better (at least 2-2.5 times better,
therefore suggesting a real F1 measure between 0.36 and 0.40). The main issue is that we used a
Geonames profile, and converting German DBpedia links to Geonames via English DBpedia is a buggy
process that currently looses more than half of the possible links. We have manually checked the
results and Recognyze does indeed find more real Geonames results that correspond to the German
DBpedia entities than simple matching algorithm used in the evaluation. The matching algorithm had
two SPARQL queries: i) one to get the English DBpedia link that corresponds to the German DBpedia
entity because there is no owl:sameAs for Geonames in most of the German DBpedia entries; ii) the
second query just took the corresponding Geonames link from the English DBpedia page. We will try
to create a better algorithm for getting the links between various versions of DBpedia, Geonames and
other knowledge bases in the near future. Since the Geonames profile was also optimized for populated
2http://de.dbpedia.org
3http://data.dws.informatik.uni-mannheim.de/dbpedia/2014/de/
© LinkedTV Consortium, 2015 10/69](https://image.slidesharecdn.com/linkedtvd2-150715090538-lva1-app6891/85/LinkedTV-Deliverable-2-7-Final-Linked-Media-Layer-and-Evaluation-10-320.jpg)
![Final Linked Media Layer and Evaluation D2.7
places and administrative entities, it is also likely that by adding the other types of geographical entities
(hydro, roads, etc.) the results will improve even more.
The current results are intermediary and can be improved in the future. It is likely that for the current
corpus, all Recognyze results (or the results of other NER systems) can be improved if a) the links be-
tween the entities are considered, and if b) the various profiles used for disambiguation put an emphasis
on location.
Table 4: Recognyze results on the RBB ground truth.
Entity Type Knowledge Base P R F1
Organization German DBpedia 2014 0.16 0.05 0.07
Person German DBpedia 2014 0.51 0.38 0.44
Location Geonames 2014 0.11 0.37 0.18
3.1.3 Outlook
It was expected that Recognyze will not perform really well in this evaluation due to the regionality of
the content, use of shortened names, and language differences between German used in news media
and television. Based on the results we obtained, we have already started creating new lexicons that
are much better for this type of content (a much improved lexicon was especially needed for the Or-
ganisations, as it can easily be seen from the bad results obtained for this type of entity). The issue of
shortened names (particularly relevant for royalty people, banks, universities) is not always easy to fix.
If the relevant triples for the entities do not feature an alternate name (dbpprop:alternativeNames) that
includes the shortened form, another solution would be to parse the abstracts of the entities (as these
abstracts often contain the shortened name). A fix can be implemented as a disambiguation algorithm
binded to the relevant fields retrieved through the SPARQL query (dbpedia-owl:abstract, dbpprop: alter-
nativeNames). Of course choosing the right binding handlers for a particular profile can be really hard,
and future work on Recognyze will focus on building such profiles automatically based on the type of
content and the entity features a user might be interested in. The problems faced when we adapted
Recognyze for different types of content (news media, social media, television), together with some of
the solutions we will continue to develop, will be discussed in a further publication.
As it can be seen from the previous paragraph, by creating the RBB corpus we have established a
basis for improving the NER services for multimedia content. The plans for the RBB corpus include the
extension of the corpus to contain more documents (probably around 150-200 compared to the current
80 documents), its integration into GERBIL [51] and comparison with other systems.
3.2 Entity Expansion Evaluation
In this section, we evaluate our algorithm called Newscast Named Entity Expansion that is semantically
annotating news items in the LinkedNews scenario. This approach retrieves and analyzes additional
documents from the Web where the same event is described in order to automatically generate semantic
annotations that provide viewers and experts of the domain a additional information to fully understand
the context of the news item. By increasing the size of the document set to analyze, we increase the
completeness of the context and the representativeness of the list of entities, reinforcing relevant entities
and finding new ones that are potentially interesting inside the context of that news item.
The approach takes as inputs the publication date, the transcripts and the newscast’s title. It outputs
a ranked list of entities called Newscast Semantic Snapshot (NSS), which includes the initial set of
detected entities in the subtitle and other event-related entities extracted from the associated documents.
We have evaluated this method against a gold standard generated by domain experts and assessed via
a user survey for five different BBC newscasts. The results of the experiments show the robustness of
our approach holding an Average Normalized Discounted Cumulative Gain of 66.6%.
3.2.1 Newscast Entity Expansion Approach
The approach we use to generate Newscast Semantic Snapshot is composed of the following steps:
query formulation, document retrieval, semantic annotation, annotation filtering, and annotation ranking.
Figure 3 depicts the workflow.
© LinkedTV Consortium, 2015 11/69](https://image.slidesharecdn.com/linkedtvd2-150715090538-lva1-app6891/85/LinkedTV-Deliverable-2-7-Final-Linked-Media-Layer-and-Evaluation-11-320.jpg)
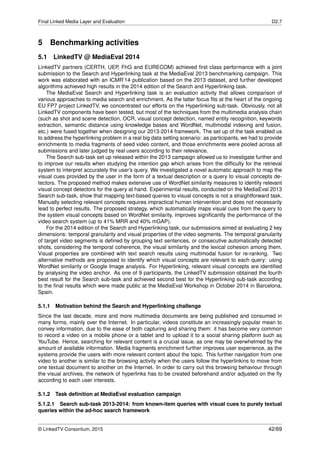
![Final Linked Media Layer and Evaluation D2.7
Figure 3: Workflow of the Named Entity Expansion algorithm
Query Formulation. Newscast broadcasters offer a certain amount of metadata about the items
they publish, which is normally available together with the audiovisual content itself. In this work, we
build the query q = [h,t], where h is the video headline, and t is the publication date. The query is then
used as an input of the retrieval stage.
Document Retrieval. The retrieval stage has the intent to collect event-related documents from the
open Web. To some extents, this process emulates what a viewer, who misses some details about the
news he is watching, does: going to the Web, making a search, and looking at the top ranked documents.
Our programmatic approach emulates this human driven task by analyzing a much bigger set of related
documents in a drastically smaller amount of time. The stage consists of retrieving documents that
report on the same event discussed in the original video as result of the query q. It has a key role in
the upcoming semantic annotation stage, since it selects a set of documents D over which the semantic
annotation process is performed. The quality and adequacy of the collected documents sets a theoretical
limit on how good the process is done.
Semantic Annotation. In this stage, we perform a named entity recognition analysis with the ob-
jective of reducing the cardinality of the textual content from the set D of documents {d1,...,dn,dn+1}
where di=1,...,n defines the ith retrieved document, while dn+1 refers to the original newscast transcript.
Since most of the retrieved documents are Web pages, HTML tags and other annotations are re-
moved, keeping only the main textual information. The feature space is then reduced and each doc-
ument di is represented by a bag of entities Edi
= e1di
,...,endi
, where each entity is defined as a triplet
(sur face_ form,type,link). We perform a union of the obtained bags of named entities resulting in the
bag of entities E of the initial query q.
Annotation Filtering and Clustering. The Document Retrieval stage expands the content niche
of the newscast. At this stage, we apply coarse-grained filtering of the annotations E obtained from
the previous stage, applying a f Edi
→ Edi
where Edi
< Edi
. The filtering strategy grounds on the
findings we obtained in the creation of the gold standard. In fact, when watching a newscast, viewers
better capture Person-type entities, as well as Organization-type and Location-type entities. The other
type of entities are generally more vague to be displayed on a second screen user interface and are
potentially less relevant for complementing the seed content. Named entities are then clustered applying
a centroid-based clustering operation. As cluster centroid, we consider the entity with the most frequent
disambiguation link that also has the most repeated sur face_ form. As distance metric for comparing
the instances, we applied strict string similarity over the link, and in case of mismatch, the Jaro-Winkler
string distance [56] over the sur face_form. The output of this phase is a list of clusters containing
different instances of the same entity.
Semantic Annotation Ranking. The bag of named entities Edi
is further processed to promote the
named entities which are highly related to the underlined event. To accomplish such an objective, we
© LinkedTV Consortium, 2015 12/69](https://image.slidesharecdn.com/linkedtvd2-150715090538-lva1-app6891/85/LinkedTV-Deliverable-2-7-Final-Linked-Media-Layer-and-Evaluation-12-320.jpg)
![Final Linked Media Layer and Evaluation D2.7
performed the task without any help from automatic systems. The output of this stage is a list of entity
candidates. The annotators worked in parallel. The annotator of the domain was asked to detect, for
each newscast, entities from:
subtitle : the newscast subtitles;
image : every time a recognizable person, organization or location was portrayed in the newscast, the
entity was added to the list;
image captions : the named entities appearing in such tags, such as nametag overlays, were added
to the candidate set;
external documents : the annotator was allowed to use Google Custom Search to look for articles
related to the video. The query followed the pattern: title of the newscast, date. The following
sources were considered: The Guardian, New York Times, and Al Jazeera online (English). The
results were filtered of one week time, where the median is represented by the day when the event
took place.
The journalist, with more than 6 years of experience as a writer and editor for important American
newspapers and web sites, acted as the expert of the domain. He was asked to watch the newscasts
and to identify the entities that best serve the objective of showing interesting additional information to
an end-user. He was completely free to suggest any named entity he wanted.
Afterwards, a quality control, performed by another expert of the domain, refined the set of entities
coming from the previous stage, eliminating all named entity duplicates and standardizing names. The
final step consisted in conducting a crowdsourcing survey with the objective to gather information about
the degree of interestingness of the entities for each newscast. Based on [53], we define interestingness
whether an entity is interesting, useful or compelling enough to tear the user away from the main thread
of the document. Fifty international subjects participated in this online study. They responded an online
call distributed via email and social networks. Their age range was between 25 and 54 years with an
average age of 30.3 (standard deviation 7.3 years). 18 participants were female and 32 were male.
Most of the participants were highly educated and 48 of them had either a university bachelor degree or
a postgraduate degree. The main requisite for participation was that they were interested in the news
and followed the news regularly, preferably through means that include newscasts. During the interview,
participants were asked to choose at least 3 out of 5 videos according to their preferences. Then, they
were shown one of the newscasts. They were asked to rate whether they would be interested in receiving
more information about the named entities in the context of the news video and on a second screen or
similar application. All the named entities from the candidate set related to the last seen video were
shown in a list with ratio buttons arranged in a similar way to a three-point Likert-scale. The possible
answers were “Yes” “Maybe” and “No”.
3.2.4 Experimental Settings
Document retrieval. We rely on the Google Custom Search Engine (CSE) API service8 by launching
a query with the parameters specified by q = [h,t]. Apart from the query itself, the CSE engine con-
siders other parameters that need to be tuned. First, due to quota restrictions, the maximum number
of retrieved document is set to 50. We have also considered 3 different dimensions that influence the
effectiveness in retrieving related documents:
1. Web sites to be crawled. Google allows to specify a list of web domains and sub-domains where
documents can be retrieved. This reduces the scope of the search task and, depending on the
characteristics of the sources considered, influence the nature of the retrieved items: from big on-
line newspapers to user generated content. At the same time, Google allows to prioritize searching
over those white lists while still considering the entire indexed Web. Based on this, in our study,
we considered five possible values for this parameter:
Google : search over the complete set of Web pages indexed by Google.
L1 : A set of 10 internationals English speaking newspapers9.
L2 : A set of 3 international newspapers used in the gold standard creation.
8https://www.google.com/cse/all
9http://en.wikipedia.org/wiki/List_of_newspapers_in_the_world_by_circulation
© LinkedTV Consortium, 2015 15/69](https://image.slidesharecdn.com/linkedtvd2-150715090538-lva1-app6891/85/LinkedTV-Deliverable-2-7-Final-Linked-Media-Layer-and-Evaluation-15-320.jpg)
![Final Linked Media Layer and Evaluation D2.7
L1+Google : Prioritize content in Newspaper whitelist but still consider other sites.
L2+Google : Prioritize content in Ground Truth’s whitelist but still consider other sites.
2. Temporal dimension. This variable allows to filter out those documents which are not temporarily
close to the day when the newscast was published. Assuming that the news item is recent enough,
this date of publication will also be fairly close to the day the event took place. Taking t as a
reference and increasing the window in a certain amount of days d, we end up having TimeWindow =
[t−d,t+d]. The reason why we expand the original event period is because documents concerning
a news event are not always published during the course of action but some hours or days after.
The final TimeWindow could vary according to many factors such as the nature of the event itself
(whether it is a brief appearance in a media, or part of a longer story with more repercussion) or
the kind of documents the search engine is indexing (from very deep and elaborated documents
that need time to be published, to short post quickly generated by users). In this study, we have
considered two possible values for it: two weeks and one week temporal windows.
3. Schema.org type. Google CSE makes possible to filter results according to a Schema.org type.
For our experiments, we use the following settings: [NoFilter, Person & Organization]
Semantic Annotation. We use [34], which applies machine learning classification of the entity type,
given a rich feature vector composed of a set of linguistic features, the output of a properly trained
Conditional Random Fields classifier and the output of a set of off-the-shelf NER extractors supported
by the NERD Framework10. We used it as an off-the-shelf entity extractor, using the offered classification
model trained over newswire content.
Annotation Filtering and Clustering. After initial trials, it became obvious that there are many
named entities detected in the semantic annotation phase which are not well-considered by viewers and
experts. We have then applied three different filtering approaches:
F1 : Filter annotations according to their NERD type11. In our case, we keep only Person, Location, and
Organization.
F2 : Filter out entities which are extracted with a confidence score falling under the first quarter of the
distribution.
F3 : Intuitively, people seem to be more attracted by proper names than general terms. Those names
are normally capitalized. This filter keeps only named entities matching this rule.
By concatenating those filters, we obtain the following combinations: F1, F2, F3, F1_F2, F1_F3,
F2_F3, F1_F2_F3 ). In order to reduce the number of runs, we did a first pre-selection of filters by
setting the rest of steps of the approach to default values and averaging the scores obtained over the
different queries. We ended up discovering that 3 of the filters (F1 and F3, and the combination F1_F3)
were producing the best results in the final MNDCG score.
Semantic Annotation Ranking. For the current experiment, we run both Frequency and Gaussian
based functions, together with the orthogonal strategies based on popularity and expert rules. This
makes a total of 2 ∗ 2 possible ranking configurations that will be considered and reported in the result
section. Regarding the particular details of the orthogonal functions, we have proceeded as follow:
Popularity. We rely on Google Trends12 which estimates how many times a search-term has been used
in a given time-window. Since Google Trends gives results with a monthly temporal granularity,
we have fixed the duration of such w to 2 months in order to increase the representativeness of
the samples without compromising too much the validity of the selected values according to the
time when the event took place. With the aim of being selective enough and keeping only those
findings backed by strong evidence, we have filtered the entities with peak popularity value higher
than µ + 2 ∗ σ which approximately corresponds to a 2.5% of the distribution. Those entities will
have their former scores combined with the popularity values via the following equation: SP (e) =
Rscore (e)+Poppeak(e)2.
Expert Rules. – i) Entity type based rules: we have considered three rules to be applied over the
three entity types considered in the gold standard. The different indexes per type have been
10http://nerd.eurecom.fr
11http://nerd.eurecom.fr/ontology
12https://www.google.com/trends
© LinkedTV Consortium, 2015 16/69](https://image.slidesharecdn.com/linkedtvd2-150715090538-lva1-app6891/85/LinkedTV-Deliverable-2-7-Final-Linked-Media-Layer-and-Evaluation-16-320.jpg)
![Final Linked Media Layer and Evaluation D2.7
deduced by relying on the average score per entity type computed in the survey SgtentityType.
Organizations have gotten a higher weight (Opexpert = 0.95), followed by Persons (Opexpert =
0.74), and by Locations (Opexpert = 0.48) that are less well-considered and therefore lower
ranked in general.
– ii) Entity’s documents based rules: each entity has to appear at least in two different sources
in order to become a candidate. All entities whose document frequency fdoc(ei) is lower than
2 are automatically discarded (Opexpert = 0).
3.2.5 Evaluation Results
Given the different settings for each phase of the approach (NrunsCollection
∗ RunsFiltering ∗ RunsRanking), we
have a total of 20∗4∗4 = 320 different runs that have been launched and ranked according to MNDCG10.
In addition, we have also executed two baseline approaches for comparing them with the best performing
strategies in our approach. More details are presented below.
Measures. Inspired by similar studies in Web search engines, we have based our evaluation proce-
dure in measures which try to find as many relevant documents as possible, while keeping the premise
that the top ranked documents are the most important. In order to summarize the effectiveness of a
the different algorithm across the entire collection of queries considered in the gold standard, we have
proposed different averaging measures that are listed below:
– Mean precision/recall at rank N. It is probably the most used measure in information retrieval tasks.
It is easy to understand and emphasize the top ranked documents. However, it does not distinguish
between differences in the rankings at positions 1 to p, which may be considered important for
some tasks. For example, the two rankings in Figure 6 will be the same when measured using
precision at 10.
– Mean average precision at N. Also called MAP, it takes in consideration the order of the relevant
items in the top N positions and is an appropriate measure for evaluating the task of finding as
many relevant documents as possible, while still reflecting the intuition that the top ranked docu-
ments are the most important ones.
– Average Normalized Discounted Cumulative Gain MNDCG at N. The Normalized Discounted Cu-
mulative Gain is a popular measure for evaluating Web search and related applications [7]. It is
based on the assumption that there are different levels of relevance for the documents obtained in
results. According to this, the lower the ranked position of a relevant document the less useful it is
for the user, since it is less likely to be examined.
As the documents in our gold standard are scored in terms of relevance for the user, we have mainly
focused on the last measure since it provides a general judgment about the adequacy of the NSS
generated. Concerning the evaluation point N, we have performed an empirical study over the whole set
of queries and main ranking functions observing that from N = 0 MNDCG decreasingly improves until it
reaches a stable behavior from N = 10 on.
Figure 6: Inability of P/R for considering the order of the relevant documents: rankings 1 and 2 share
the same Precision and Recall at 10.
Baselines.
© LinkedTV Consortium, 2015 17/69](https://image.slidesharecdn.com/linkedtvd2-150715090538-lva1-app6891/85/LinkedTV-Deliverable-2-7-Final-Linked-Media-Layer-and-Evaluation-17-320.jpg)
![Final Linked Media Layer and Evaluation D2.7
1. Baseline 1: Former Entity Expansion Implementation. A previous version of the News Entity Ex-
pansion algorithm was already published in [33]. The settings were: Google as source of docu-
ments, temporal window of 2 weeks, no Schema.org selected, no filter strategy applied, and only
frequency-based ranking function with no orthogonal appliances. The results are reported in the
Table 6 under the run id BS1.
2. Baseline 2: TFIDF-based Function. To compare our absolute frequency and Gaussian based
functions with other possible approaches already reported in the literature, we selected the well-
known TF-IDF. It measures the importance of an entity in a document over a corpus of documents
D, penalizing those entities appearing more frequently. The function, in the context of the named
entity annotation domain, is as follows:
t f(ei,dj) = 0.5+ 0.5×fa(ei,D)
max{fa(ei,D):ei∈dj}
,id f(ei,dj) = log |D|
{dj∈D:ei∈dj} (1)
We computed the average of the TF-IDF for each entity across all analyzed documents, resulting
in aggregating the different t f(ei,dj)×id f(ei,dj) into a single function t fid f∗(ei,D) via the function
STFIDF (e) =
∑n
j=1 t f(e,dj)×id f(e)
|D| . Results are reported in the Table 6 under the run id BS2.
Launching the Experiments.
Table 6: Executed runs and their configuration settings, ranked by MNDCG10
Run
Collection
Filtering
Functions Result
Sources TWindow Schema.org Freq Pop Exp MNDCG10 MAP10 MP10 MR10
Ex0 Google 2W F1+F3 Freq 0.666 0.71 0.7 0.37
Ex1 Google 2W F3 Freq 0.661 0.72 0.68 0.36
Ex2 Google 2W F3 Freq 0.658 0.64 0.6 0.32
Ex3 Google 2W F3 Freq 0.641 0.72 0.74 0.39
Ex4 L1+Google 2W F3 Freq 0.636 0.71 0.72 0.37
Ex5 L2+Google 2W F3 Freq 0.636 0.72 0.7 0.36
Ex6 Google 2W F1+F3 Freq 0.626 0.73 0.7 0.38
Ex7 L2+Google 2W F3 Freq 0.626 0.72 0.72 0.37
Ex8 Google 2W F1+F3 Freq 0.626 0.64 0.56 0.28
Ex9 L2+Google 2W F1+F3 Freq 0.624 0.71 0.7 0.37
Ex10 Google 2W F1 Freq 0.624 0.69 0.62 0.32
Ex11 L1+Google 2W F3 Freq 0.623 0.7 0.72 0.37
Ex12 L2+Google 2W F3 Freq 0.623 0.68 0.66 0.35
Ex13 L2+Google 2W F3 Freq 0.623 0.61 0.56 0.3
Ex14 L2+Google 2W F3 Freq 0.62 0.69 0.74 0.4
Ex15 L1+Google 2W F1+F3 Freq 0.617 0.69 0.66 0.34
Ex16 L2+Google 2W F1 Freq 0.616 0.68 0.62 0.32
Ex17 Google 2W F1+F3 Freq 0.615 0.7 0.64 0.32
Ex18 L1 2W F3 Freq 0.614 0.65 0.6 0.32
Ex19 L1+Google 2W F1+F3 Freq 0.613 0.72 0.72 0.38
Ex20 L1+Google 2W F1+F3 Freq 0.613 0.7 0.66 0.35
... ... ... ... ... ... ... ... ... ... ... ...
Ex78 Google 2W F1+F3 Gaussian 0.552 0.66 0.66 0.34
Ex80 L2+Google 2W F1+F3 Gaussian 0.55 0.69 0.7 0.36
Ex82 L1 2W F3 Gaussian 0.549 0.68 0.64 0.33
... ... ... ... ... ... ... ... ... ... ... ...
BS2 Google 2W Freq 0.473 0.53 0.42 0.22
... ... ... ... ... ... ... ... ... ... ... ...
BS1 Google 2W TFIDF 0.063 0.08 0.06 0.03
In Table 6, we present the top 20 runs for our approach in generating NSS, together with other
configurations at position 78 and following that are worth to be reported and the scores of the baseline
strategies. We summarize the main findings of the experimental settings and evaluation as follows:
– Our best approach has obtained a MNDCG10 score of 0.662 and a MAP10 of 0.71, which are
reasonably good in the document retrieval domain.
– Our approach performs much better than BS1 and BS2. The very low score of this last baseline
is explained by the fact that traditional TF-IDF function is designed to measure the relevance of an
item in the encompassing document and not with respect to a collection. In addition, the absence
of filters drops drastically the score.
© LinkedTV Consortium, 2015 18/69](https://image.slidesharecdn.com/linkedtvd2-150715090538-lva1-app6891/85/LinkedTV-Deliverable-2-7-Final-Linked-Media-Layer-and-Evaluation-18-320.jpg)
![Final Linked Media Layer and Evaluation D2.7
– Regarding the Document Retrieval step, we see that using Google as a single source or together
with other white list gives better results than restricting only to particular white lists. The biggest
TWindow of 2 weeks performs better in all cases, while the use of Schema.org does not bring any-
thing back except when it is applied over the Gaussian function (see runs 78, 80, 82) where it turns
to be an influential factor.
– The best Filtering strategy is F3, followed by the combination F1_F3. In conclusion, capitalization is
a very powerful tool for making a first candidate list with those entities that, a priori, users consider
more interesting.
– The absolute frequency function performs better than the Gaussian in all top cases.
– The Expert Rules based function improves the final NSS for almost every possible configuration.
– Popularity based function does not seem to improve significantly the results. However, a further
manual study of the promoted entities has revealed that in fact, the method is bringing up relevant
entities like for example David Ellsberg13 for the query “Fugitive Edward Snowden applies for
asylum in Russia”. This entity is rarely mentioned in the collected documents, but David Ellsberg’s
role in the newscast is quite representative since he published an editorial with high media impact
in The Guardian praising the actions of Snowden in revealing top-secret surveillance programs of
the NSA.
3.2.6 Outlook and Future Work
In this section, we have presented an approach for automatically generating Newscast Semantic Snap-
shots. By following an entity expansion process that retrieves additional event-related documents from
the Web, we have been able to enlarge the niche of initial newscast content. The bag of retrieved docu-
ments, together with the newscast transcript, is analyzed with the objective of extracting named entities
referring to people, organizations, and locations. By increasing the size of the document set, we have
increased the completeness of the context and the representativeness of the list of entities, reinforcing
relevant entities and finding new ones that are potentially interesting inside the context of that news item.
The named entities have been then ranked according to the entity appearance in the sampled collection
of documents, popularity of the entity on the Web, and experts’ rules. We assessed the entire workflow
against a gold standard, which is also proposed in this section. The evaluation has showed the strength
of this approach, holding an MNDCG10 score of 0.666, outperforming the two studied baselines.
Future research includes tailoring the entity ranking functions to particular news categories: sport,
politics, regional, international, opinion. We are investigating the role of entity relations in generating
of the Newscast Semantic Snapshot: usually, entities are linked by tight relations extracted from a
knowledge base, or simply from the documents collected, in order to generate a directed graph of
entities instead of a list. We also plan to refine the ranking process, applying supervised techniques
(Learning to Rank) that tailor the solution on particular domains.
3.3 Linked Hypernyms Dataset
The Linked Hypernyms Dataset (LHD) Core dataset14, associates DBpedia entities (corresponding
to Wikipedia articles) with a type which is obtained by parsing the first sentences of the respective
Wikipedia article. This dataset is powering the THD system, which is evaluated in Subs. 3.4.
In this section, we report on the accuracy of the LHD Core dataset and compare it with the accuracy
of types in DBpedia. To increase the coverage of LHD, there is an extended version of the dataset
called LHD Inferred, which uses statistical and machine learning techniques to assign additional entities
a type from the DBpedia Ontology. These algorithms are described in [24, 58], here we report on their
accuracy.
3.3.1 Generating the gold standard
In order to evaluate the general quality of types in the LHD dataset and to compare it with the quality
of types in DBpedia we generated a gold standard dataset using the crowdsourcing platform Crowd-
flower15. The CrowdFlower, similarly to the well-known Amazon Mechanical Turk (AMT), is an online
13http://en.wikipedia.org/wiki/Daniel_Ellsberg
14ner.vse.cz/datasets/linkedhypernyms
15http://www.crowdflower.com
© LinkedTV Consortium, 2015 19/69](https://image.slidesharecdn.com/linkedtvd2-150715090538-lva1-app6891/85/LinkedTV-Deliverable-2-7-Final-Linked-Media-Layer-and-Evaluation-19-320.jpg)
![Final Linked Media Layer and Evaluation D2.7
– Accexact evaluation metric uses original gold standard GSexact.
– Accdir_supertypes uses gold standard GSdir_supertypes which extends GSexact with all direct supertypes.
GSdir_supertypes is defined as follows:
{x|x ∈ directSuperTypes(y),y ∈ GSexact}∪GSexact (2)
– Accsupertypes uses gold standard GSsupertypes extending GSexact with all supertypes. GSsupertypes is
defined as follows:
{x|x ∈ superTypes(y),y ∈ GSexact}∪GSexact (3)
– Acc[sub|super]types uses gold standard GS[sub|super]types extending GSsupertypes with all subtypes.
GS[sub|super]types is defined as follows:
{x|x ∈ subTypes(y),y ∈ GSexact}∪GSsupertypes (4)
Since there is a total order between the variants of the gold standard, GSexact ⊆ GSdir_supertypes ⊆
GSsupertypes ⊆ GS[sub|super]types, it follows that: Accexact ≤ Accdir_supertypes ≤ Accsupertypes ≤ Acc[sub|super]types.
Since the variants of the gold standard, except GSexact, can have more than one type per entity, type
assignment by a classifier is considered as correct if this type is included in a set of types associated
with an entity in the gold standard.
3.3.3 Evaluation results
We performed evaluation on three languages: English, German and Dutch. For English the annotation
was performed on 1165 randomly drawn articles from English Wikipedia. In total there were 1033
entities with assigned agreement category in the gold standard for English. Additionally, 22 entities were
assigned to the ’not found’ category, 47 entities the ’disambiguation page’ category, and in 63 cases
there was no agreement.
For German the annotation was performed on 300 randomly drawn articles from German Wikipedia.
In total there were 248 entities with assigned agreement category in the gold standard for German.
Additionally, 15 entities were assigned to the ’not found’ category, 19 entities the ’disambiguation page’
category, and in 18 cases there was no agreement.
For Dutch the annotation was performed on 239 randomly drawn articles from Dutch Wikipedia. In
total there were 222 entities with assigned agreement category in the gold standard for Dutch. Addition-
ally, 8 entities were assigned to the ’not found’ category, 6 entities the ’disambiguation page’ category,
and in 3 cases there was no agreement. For the evaluation we used the most up-to-date version of the
DBpedia Ontology (2014).
Figure 7 shows that the results for LHD Core (denoted as LHD 1.0 in [25]) and DBpedia are very
similar for all three languages. There is just one larger difference in terms of Accexact for German, where
LHD Core achieves improvement of 42% over DBpedia. By inspecting German DBpedia it seems that
this can be explained by the fact that German DBpedia assigns mostly general concepts from the DBpe-
dia ontology, while the more specific concepts are assigned from the German DBpedia ontology, which
was not involved in the gold standard and evaluation.
In general, while LHD Core has exact types with higher accuracy than DBpedia (e.g. 19% improve-
ment in Accexact for English), DBpedia has higher accuracy in the relaxed metrics but always only by
a thin margin (e.g. of 3% in Accsupertypes for English). This result shows that DBpedia Ontology types
assigned by the lexico-syntactic pattern based LHD Core extraction framework are of equal quality with
types extracted from infoboxes.
However, it should be noted that LHD Core framework has much smaller coverage than DBpedia. In
our evaluation datasets, it covered only 345 entities out of the 1033 for English (cf. 733 by DBpedia), 37
entities out of the 248 for German (cf. 165 by DBpedia) and 53 entities out of 222 for Dutch (cf. 180 by
DBpedia) with DBpedia Ontology type.
For English, we tried to extend the number of entities with assigned DBpedia Ontology type using
the following three algorithms: Statistical Type Inference (STI) algorithm [24], hierarchical Support Vector
Machines (hSVM) classifier [58], which exploits the words in the short abstracts and links in the article
categories to perform the classification, and a fusion of the two algorithms. The results depicted at
Figure 8 show that STI has the highest accuracy from the type inference approaches in the Accexact
metric, however, in the more relaxed metrics it is outperformed by hSVM. The types generated by the
machine-learning algorithms are published as the LHD Inference dataset.
© LinkedTV Consortium, 2015 21/69](https://image.slidesharecdn.com/linkedtvd2-150715090538-lva1-app6891/85/LinkedTV-Deliverable-2-7-Final-Linked-Media-Layer-and-Evaluation-21-320.jpg)
![Final Linked Media Layer and Evaluation D2.7
Table 7: DBpedia and LHD is evaluated on the English (1033 entities), German (248 entities) and Dutch
(222 entities) gold standards. For hSVM we report result for the β run and for the hSVM-STI fusion from
the “propβ-1” run described in [58].
Classifier
Accexact
Accdir_supertypes
Accsupertypes
Acc[sub|super]types
DBpedia (en)
(on 733 entities) .526 .690 .785 .878
LHD Core (en)
(on 345 entities) .655 .761 .787 .856
DBpedia (de)
(on 165 entities) .296 .521 .854 .915
LHD Core (de)
(on 37 entities) .702 .783 .783 .891
DBpedia (nl)
(on 180 entities) .638 .727 .877 .911
LHD Core (nl)
(on 53 entities) .655 .761 .787 .856
Table 8: Evaluation of STI and hSVM algorithms on the English dataset (1033 entities). For hSVM we
report result for the β run and for the hSVM-STI fusion from the “propβ-1” run described in [58].
Classifier
Accexact
Accdir_supertypes
Accsupertypes
Acc[sub|super]types
hSVM .275 .457 .690 .747
STI
(on 324 entities) .438 .462 .487 .666
STI/hSVM-fusion
(699 STI types) .429 .566 .666 .757
3.3.4 Outlook: automating LHD Inference dataset generation
Since the results by the LHD Inference dataset are promising, we carried out steps in order to automate
the generation of the dataset to improve the odds of the lasting contribution to the community.
The core component of the LHD Inference dataset is a machine learning algorithm. In our earlier
work we obtained promising results with the use of association-rule based classifier in a related text
categorization task. We developed a new web service for association rule learning within our EasyMiner
framework, which is based on the high performance arules library [4].
This web service can be used to build an association rule-based classifier that could possibly replace
the third-party hSVM component in the Inference dataset generation workflow. The advantage of this
approach is that there would be one in-house machine learning service that could meet the needs of
multiple work packages as association rule learning is already used as a core WP4 component, however
using a slower underlying implementation [46].
Table 9 provides a preliminary benchmark of our brCBA classifier [26], which builds classification
models from association rules, with other commonly used classifiers, including linear SVM models. The
experiments were performed on 28 datasets used to train the hSVM classifier in [58]. These datasets
were derived from the short abstracts of DBpedia resources, which correspond to first sentences of
© LinkedTV Consortium, 2015 22/69](https://image.slidesharecdn.com/linkedtvd2-150715090538-lva1-app6891/85/LinkedTV-Deliverable-2-7-Final-Linked-Media-Layer-and-Evaluation-22-320.jpg)
![Final Linked Media Layer and Evaluation D2.7
Table 10: Size metrics for the Sound and Vision and RBB datasets.
Dataset Num. of entities Named entities Common entities Video length
Sound and Vision 289 42 247 14 min 55 sec
RBB 397 75 322 13 min 50 sec
3.4.2 Evaluated Approaches
3.4.2.1 Entity spotting Entityclassifier.eu supports two approaches for entity spotting, which were
evaluated.
– Pattern based (GRAM) - a manually crafted lexico-syntactic patterns written as JAPE grammars.
We have developed grammars that can be applied to detect common and named entities in Dutch,
German and English texts. The grammars, can be used for detection of both, common and named
entities.
– Conditional Random Fields (CRF) based - an entity spotting approach based on the state-of-the-
art Conditional Random Fields (CRF) model. The model is trained on the CoNNL 2003 dataset.
See Section 5.2.3.2 for more information.
3.4.2.2 Entity linking We evaluated following entity linking approaches.
– Basic Lucene index (LB) - uses a specialized Lucene index, which extends the Apache Lucene
search API. It primarily ranks pages based on the number of backlinks and the Wikipedia articles’
titles. It uses the detected entity name when performing the entity linking.
– Lucene Skip Disambiguation (LSD) - same as the previous, only as a correct link it considers
the first non-disambiguation page.
– Surface Form Index (SFI) - this approach approach uses a custom entity candidate index. The
candidate index contains all surface forms found in Wikipedia articles together with their candi-
dates.
– Surface Form Similarity (SFS) - this approach first performs entity linking with the SFI and LSD.
And then, the article with the most similar title to the entity surface form is considered as correct.
For measuring similarity we opted for the widely used Jaro-Winkler string similarity measure.
3.4.3 Results
The evaluation was performed using GERBIL [51], a benchmarking framework for entity annotation
and disambiguation tools. For the evaluation we run the A2KB experiment [51]. We report on thee
metrics computed by the GERBIL framework: micro precision, micro recall and micro F-measure. The
macro measures are not reported, since scores obtained on such a short documents (one document
corresponds to one subtitle fragment) are not very meaningful, as many of the documents have no
ground truth annotation, which results in increased macro score measures.
The results reported by the GERBIL framework in the micro recall measure (and consequently for the
F1 measure) in Table 11-16 were updated in the final published version of the deliverable as foreseen in
the initially submitted version.18
The details of the metrics can be found in the description of the underlying BAT framework [6].
Table 11 shows the results from the evaluation on the Dutch dataset with focus on the named entities
only. The results show that the best F1 micro score 0.2737 was achieved by the approach which uses
Conditional Random Field (CRF) model for entity spotting and a custom Surface Form Index (SFI) for
entity linking.
Table 12 shows the results from the evaluation on the Dutch dataset which contains both, named and
common entities. In this evaluation, the best micro 0.2912 F1 score was achieved by the Surface Form
Similarity (SFS) based approach.
18A bug in the evaluation framework was discovered by the deliverable authors shortly before the deliverable submission due
time and reported to the GERBIL community, which confirmed it and later fixed it.
© LinkedTV Consortium, 2015 24/69](https://image.slidesharecdn.com/linkedtvd2-150715090538-lva1-app6891/85/LinkedTV-Deliverable-2-7-Final-Linked-Media-Layer-and-Evaluation-24-320.jpg)
![Final Linked Media Layer and Evaluation D2.7
Table 17: Size metrics for the Reuters-128 and New York Times entity salience corpora.
Corpus Documents
Entity
mentions
Unique
entities
Entities linked
with DBpedia
Salient
entities
Not salient
entities
Reuters-128 128 4,429 2,024 3,194 804 (18%) 3,625 (82%)
NYT (train) 100,834 1,990,355 173,462 1,990,355 255,572 (13%) 1,734,783 (87%)
NYT (eval) 9,706 184,457 42,251 184,457 24,438 (13%) 160,019 (87%)
collection [35]. The Reuters-128 dataset is an English corpus in the NLP Interchange Format (NIF) and
it contains 128 economic news articles. The dataset contains information for 880 named entities with
their position in the document (beginOffset, endOffset) and a URI of a DBpedia resource identifying the
entity.
Since the dataset only provides information about named entities found in the corpus, we further
extended the dataset with common entities. To this end, we used our Entityclassifier.eu NER tool to
enrich the dataset with common entities. This resulted in additional 3551 common entities.
Furthermore, aiming to obtain a gold standard entity salience judgments we used a crowdsourc-
ing tool to collect judgments from non-expert paid judges. For each named and common entity in the
Reuters-128 dataset, we collected at least three judgments for each entity from annotators based in 15
different countries, including English-speaking countries, such as United Kingdom, Canada and United
States. We also manually created a set of test questions, which helped us to determine contributor’s trust
score. Only judgments from contributors with trust score higher than 70% were considered as trusted
judgments. If the trust score of a contributor falls bellow 70%, all his/her judgments were disregarded.
In total we collected 18,058 judgments from which 14,528 we considered as “trusted” and 3,530 as “un-
trusted” judgments. The interannotator agreement, in cases where the annotators judgments differed,
was determined by the crowdsourcing tool.
Additionally, we used also the New York Times dataset. The salience annotations in the NYT dataset
have been automatically generated by aligning the entities in the abstract and the document and consid-
ering that every entity which occurs in the abstract is salient. The New York Times dataset consists of
two partitions. A training partition which consists of about 90% of the data, and a testing partition con-
sisting of the remaining 10%. The NYT dataset [18] provides only information about the begin and end
index of the entities, the entity name, document ID and salience information. The annotations are shared
without the underlying document’s content. Thus, we have converted only the available information in
the NIF format; without the documents’ content.
Annotation statistics for both the crowdsourced Reuters-128 and the converted New York Times
dataset are presented in Table 17.
3.5.2 Baseline methods
In the experiments we consider the following three baseline methods against which we compare our
method.
– Positional Baseline. An entity is considered as salient only if the begin index of the first occurrence
in the document is within the first 100 characters. This also corresponds to a typical sentence
length, which in average is around 100 characters long. Since the entities of the Reuters-128
dataset are classified with three classes {most salient, less salient, not salient}, an entity is consid-
ered as “most salient” only if its first occurrence is within the first 100 characters in the document.
The entities in the NYT dataset are classified with two salient classes {salient, not salient}, and an
entity is considered as “salient” if it occurs withing the first 100 characters in the document.
– Majority Vote Baseline. This baseline method always predicts the majority class. For the Reuters-
128 and the NYT datasets that is the “not salient“ class.
– Entity Frequency Baseline. This baseline method is learning from the frequency of entity occur-
rence in a document. As a learning algorithm for this method we used the Random Forest decision
tree learning algorithm.
3.5.3 Learning Algorithms
We experimented with various learning algorithms to find the most suitable one for the task of learning
entity salience. In D1.4, we reported results for Support Vector Machines (SVM) with polynomial kernel,
© LinkedTV Consortium, 2015 27/69](https://image.slidesharecdn.com/linkedtvd2-150715090538-lva1-app6891/85/LinkedTV-Deliverable-2-7-Final-Linked-Media-Layer-and-Evaluation-27-320.jpg)
![Final Linked Media Layer and Evaluation D2.7
Table 20: Evaluation results for different baseline methods for the class “most salient” for the Reuters-
128 dataset and “salient” for NYT dataset.
Method
Reuters-128 (most salient class) New York Times (salient class)
Precision Recall F1 Precision Recall F1
Positional baseline 0.518 0.488 0.391 0.620 0.262 0.369
Majority vote baseline 0.000 0.000 0.000 0.000 0.000 0.000
Entity frequency baseline 0.437 0.133 0.204 0.706 0.305 0.426
Our with Random forest 0.693 0.516 0.592 0.611 0.629 0.620
The scores reported in Table 19 are computed as “weighted average” for all the classes. Since we
are interested in representing the aboutness of the Web documents in terms of salient entities, we report
also the scores for the salient classes. Table 20 summarizes the results for the “most salient” class for
the Reuters–128 dataset and the “salience” class for the NYT dataset.
The results show that our model outperforms all other considered baseline methods. For the Reuters–
128 dataset our model based on the Random Forest algorithm achieves 0.592 F1, while the positional
baseline 0.391 F1 and the entity frequency baseline 0.204 F1. Similarly, for the NYT dataset our method
achieves 0.620, while the positional baseline is at 0.369 F1, and the entity frequency baseline at 0.426
F1. The entity frequency baseline, which is very close to a typical TF-IDF keyword extraction approach,
is improved by our model by 290% for the Reuters–128 dataset and by 45% for the NYT dataset.
Since the Random Forest learning algorithm shows best performance for learning entity salience, we
also use Random Forest for learning entity salience in Entityclassifier.eu.
3.5.5 Outlook: Entity-based clustering
As an outlook for further development of LinkedTV technologies, we investigated the utility of entity-
annotated text for text clustering. While not incorporated into the WP2 pipeline, within the LinkedTV
context the availability of clustering could serve the following purposes: i) the most discriminative fea-
tures of each of the clusters can be used as “keyword” labels describing the documents in the cluster,
ii) since the resulting cluster labels are LOD entities this will provide unambiguous semantics for the
clusters. Additionally, we hypothesize that the entity-based text representation could also improve the
quality of the clustering as opposed to the standard bag-of-words representation.
As the dataset, we used the Reuters-21578 text categorization collection. The Reuters-21578 col-
lection contains 21,578 documents, which are assigned to 135 different categories (topics). Example
topics are “earn” or “wheat”. On average, one document belongs to 1.3 categories. For the experiments,
we used only a subset consisting of 9,809 documents which are assigned to the ten most frequently
populated categories (same list of categories was used e.g. in [2]).
Two versions of the dataset were prepared: the bag of words (BoW) and bag of entities (BoE). In
the BoW version, the following preprocessing was performed: all terms were converted to lower case,
numbers were removed, punctuation was removed, stop words were removed, whitespace was stripped
and the documents were stemmed. The resulting words were used as features (attributes).
In the BoE version, the text was analyzed with THD and represented with the list of entities (DBpedia
resources) and their types (DBpedia Ontology concepts) which THD returned. The features in both
BoW and BoE documents were assigned a TF-IDF score in each document. Finally, for each version,
ten datasets were created by selecting 10, 50, 100, 200, 500 features with highest TF scores.
For our experiments, we employed the bisection K-Means clustering algorithm implemented within
the LISp-Miner data mining system (lispminer.vse.cz). The LISp-Miner system was adapted and
extended to perform this analysis as described in the technical report [54], which contains additional
details on algorithm settings and parameters. The results depicted in Table 21 show that the entity-
based representation leads to consistently higher quality of clustering than the standard bag-of-words
approach. The results also indicate that the BoE representation is more condensed, achieving peak
cluster quality at only 200 term vector size. This demonstrates the utility of entity representation (and
the THD tool) for the clustering task.
3.6 Topic labelling evaluation
The topic labelling service associates content with topics from the LUMO ontology (http://data.linke
dtv.eu/ontologies/lumo/, [50]) Topics subhierarchy, as described in the previous deliverable D2.6. In
© LinkedTV Consortium, 2015 29/69](https://image.slidesharecdn.com/linkedtvd2-150715090538-lva1-app6891/85/LinkedTV-Deliverable-2-7-Final-Linked-Media-Layer-and-Evaluation-29-320.jpg)
![Final Linked Media Layer and Evaluation D2.7
Table 21: Evaluation of clustering results using cluster quality metric defined in [54]
term vector length 10 50 100 200 500
Bag of entities (BoE) 0.43 0.47 0.52 0.56 0.54
Bag of words (BoW) 0.41 0.42 0.43 0.44 0.52
D2.6, the performance of the service for video chapters of LinkedTV content was evaluated, while in this
experiment the focus is set on evaluating the service over enrichments of LinkedTV content. The goal
of the evaluation was to measure the accuracy and coverage of the topics extracted for enrichments.
The dataset used was the set of enrichment articles identified during the user trials of WP6 (cf. D6.5).
Therefore, it consisted of 46 articles related to all the chapters of five RBB news shows, for the Linked
News scenario, and of 82 articles, related to all the chapters of three TKK shows, for the Linked Culture
scenario.
3.6.1 Experiment setup
The topics detection was based on entities automatically extracted from the text of the articles. The
steps to extract these entities are listed below.
1. The service received the HTML content of the web page for each web article via the trials’ web-
player. It is worth noticing that the player’s embedded content proxy retrieved the contents of the
page, stripped it of irrelevant text (e.g. menus, sidebars), and stored it locally.
2. The body text of the stripped HTML was run thought the THD Entity Extraction service, in order
to extract DBPedia entities (resources) from the text. The salience score of extracted entities a)
was employed in order to prune the less significant entities and b) for the remaining entities, it was
conveyed across the next steps to take into account in the final step of the topic detection.
3. The THD Entity Classification service was employed in order to retrieve DBPedia types (from
DBPedia Ontology and/or the Linked Hypernyms Dataset) for the extracted entities.
4. For the DBPedia ontology types extracted in the last step, a custom mechanism was built to filter
out the more generic types per entity (e.g. "Agent" for every person that appears in the texts) and
keep only the most specific and characteristic types for an entity (e.g. ’Politician’ that gives an
outlook of the topic of the text), where applicable.
5. These types were translated to LUMO classes, again where applicable, via the LUMO wrapper
service and based on the LUMO mappings ontology (cf. D2.4 for more details). This step is
necessary in order to bring the entities into the LUMO concept space, where relations between
types of agents, objects, events and their respective topics can be retrieved.
The final input for the topic labelling service was the retrieved LUMO classes, along with a degree
per class that represented the salience of the original entity that each class derived from. Essentially,
the degree represented the relevance of the class to the article at hand.
Ultimately, the LiFR reasoner [49], the core of the topic labelling service as described in D2.4, was
employed in order to retrieve the topics related with the input classes within the LUMO ontology for each
article. The topics retrieved carried the salience degree of the classes they derived from, thus denoting
the relevance of each topic to the article.
3.6.2 Evaluation setup
For the evaluation of the topics retrieved, one person was called to rate the results per scenario, as-
suming the hypothetical role of a content editor for a broadcaster. For the Linked News (i.e. German
language content), a colleague from partner MODUL served as the editor, and for Linked Culture (i.e.
Dutch language content), a colleague from partner S&V served as the editor.
Each evaluator was presented with an online form containing a) information about all articles and
b) their respective topics, and were asked to evaluate the precision and recall of the topics per article
based on their informed opinion.
In more detail, the information the evaluators were presented with per article was:
a. The URL of the article.
© LinkedTV Consortium, 2015 30/69](https://image.slidesharecdn.com/linkedtvd2-150715090538-lva1-app6891/85/LinkedTV-Deliverable-2-7-Final-Linked-Media-Layer-and-Evaluation-30-320.jpg)
![Final Linked Media Layer and Evaluation D2.7
b. The body text of the article, as it was presented in the trials’ webplayer, the specific day it was
crawled to be presented. I.e. if it was a dynamic web page that is refreshed hourly/daily/weekly
(like e.g. the home page of a sports news site) and the evaluators clicked on the link, they might
see content other than the one they were displayed with in this form. This is because the webplayer
visited the page at some point during trials’ preparations, it parsed the HTML of that time point and
kept it stored, while today the contents of the page may have changed. The topic labelling service
detected topics on the stored contents. This is also the reason why the form presented the body text
(instead of just letting the evaluators click on the URL), so they can assess the topics based on the
actual (static) piece of text that they represent.
c. The collection of topics that describe the contents of the corresponding body text along with their
respective degrees. The degrees were in the [0, 1] scale. So if there is a topics-degree pair "arts -
1.0", this means that the topic "arts" was found to be 100% relevant to the text. If, in the same article,
there is a topics-degree pair "science - 0.3", this means that the topic "science" was also found in the
text, but it has a medium-to-low relevance (30%).
A snapshot of the form can be seen in Figure 9.
Figure 9: Topics Labelling evaluation form
Subsequently, the evaluators were asked to give their expert opinion on the precision and recall of
topics presented by providing a ranking score in a scale of 0-5 for all topics retrieved per article, for each
measurement (precision, recall), taking also into account the topics’ degrees. In order to interpret the
scores and the criteria for ranking, the reader should refer to the instructions towards the evaluators,
available in the Annex, section 8.
It is worth noticing that, regarding recall, we did not want to restrain the evaluators to take into account
the existing LUMO Topics subhierarchy, but rather provide their unbiased opinion. This way, while co-
estimating recall of enrichment entities in the analysis of the results, we would be able to identify the
coverage that LUMO offers over topics.
3.6.3 Results and outlook
The average precision, average recall and f-measure scores is displayed in Table 22. Based on these
scores, it can be concluded that the overall performance of the topic labelling service was mediocre,
while being better in the Linked News case than in the Linked Culture case. However, a closer inspection
of the rest of the statistics of the two datasets, seen in Table 23, in correspondence with the results
populations’ histograms in Figure 10, reveals a significantly better performance of the service over the
RBB dataset than over the TKK dataset.
Table 22: Precision, Recall, F-measure results for the topic labelling normalized to [0;1] interval.
RBB TKK
Avg Precision 0.617391304 0.402469136
Avg Recall 0.608695652 0.479012346
F-measure 0.613012643 0.437417436
Examination of the standard deviation, for both precision and recall, in Table 23 shows that although
the scores for precision and recall in both datasets have a notably high deviation among them, the RBB
data points deviate considerably more from their (mediocre) mean than the TKK ones, which appear
© LinkedTV Consortium, 2015 31/69](https://image.slidesharecdn.com/linkedtvd2-150715090538-lva1-app6891/85/LinkedTV-Deliverable-2-7-Final-Linked-Media-Layer-and-Evaluation-31-320.jpg)
![Final Linked Media Layer and Evaluation D2.7
scores 3-5. For recall, scores mostly peak at score:3 and score:5, while the cumulative percentage
shows that 60% of the scores are between 3-5.
On the other hand, as indicated, the distribution of data for the TKK scenario show that for precision,
the more frequent scores were along the lines of 1-3, peaking at 2. Their cumulative percentage reveals
that by score:3, the data accumulation has reached a little less that 100%, i.e. almost no scores of 4 and
5 were recorded. Similarly, but relatively better, for recall, the peak is at score: 3, while the majority of
the population is distributed around scores 1-4. Recall’s cumulative percentage shows that 95% of the
population is accumulated by score: 3.
From the above statistical analysis, it can be concluded that the performance of topic labelling for the
RBB dataset was good, scoring mostly ≥ 3, with a lot of scores on the 4-5 rating. While for the TKK
dataset, the performance was mediocre to poor, averaging at a 2-3 rating.
3.6.3.1 Observations While looking closely to some of the least successful articles in the RBB
dataset, in collaboration with the evaluator, we noticed a dependency between the quality of topics de-
tected and the quality of entities and types recognized by THD. This dependency was already observed
and quantitatively evaluated in a previous experiment (cf deliverable D2.6, ch. 5.3: topics detection eval-
uation in video chapters). Another observation regarded the dependency of the service’s performance
and the domain coverage of the vocabularies used by the THD entity extraction.
For example, in an article about the war in Syria, words in the text like "Krieg" (war) and "Kampf"
(battle) should have pointed towards the sub-topic "Armed_conflict". However, looking at the entities
extracted from THD for this article, neither of these words were detected20 On the other hand, entities
that were correctly detected (e.g. http://de.dbpedia.org/resource/Hisbollah) failed to provide any
meaningful information to the service, due to the fact that the German DBPedia did not provide any
meaningful types for it other than "organisation", while it could also have been characterized as a "Po-
litical_Party", like its English DBPedia counterpart. These misses gave rise to unrelated topics, e.g.,
in this example, "Gastronomy", because of a statement of one of the officials in the article saying that
things calmed down so that "they can now make some tea". "Tea" was recognized as "Beverage", which
connected to culinary topics. Such outlier entities, and subsequently derived topics, had a low salience,
however in lack of more relevant information, at times they were the only ones that were presented for
this article.
Feedback from the evaluator also revealed that in general some topics, like "art_culture_entertainment"
seem to be over-detected, but not necessarily wrongfully. This will be further scrutinized, but preliminary
indications show that this is the result of a combination of facts: a) LUMO is more detailed in the arts sub-
domain, while is maintained more generic towards other more specific sub-domains, due to the LinkedTV
scenario. b) A tendency of the entity extraction service to recognize more frequently named entities in-
stead of common words within the German DBPedia was observed. This can also be tracked back to
deficiencies of the German DBPedia, i.e. a focus in more efficiently modelling named entities over com-
mon words. Those named entities extracted often pointed to movies, plays, TV shows, musicians/bands
and music albums that are entitled with the underlying common word. E.g. for a case where the word
"Desaster" (disaster) was detected by THD, the German DBPedia resource extracted, pointed (via the
" same-as" property) to an English DBPedia resource (http://dbpedia.org/resource/Desaster) of
a German music band of that name. This resource and the type "Band" were the THD input for the
underlying string "Desaster", misleading to the topic "Music".
For the TKK dataset, again the dependency between the quality of topics and the accuracy of ex-
tracted entities was prominent. Common entities (words) like "Material" or "Plate" (as an artifact) were
not detected, supposedly pertaining to the coverage deficiencies of Dutch DBPedia. More significantly
though, and as observed throughout the research phase of LinkedTV, the DBPedia types cannot cover
efficiently arts or art related semantics, or any of the more specific sub-domains’ semantics, since it
focuses on covering generic domain semantics. This is why mappings to YAGO[23] (a more vast and
detailed taxonomy) were opted, but for the setup of these trials21 only DBPedia was used. The lack of
art-related semantics was heavily observed as the cause of the topic detection’s poor performance over
the TKK dataset.
The generality of DBPedia was not conveyed only to missed types, but also to out-of-context seman-
tics in extracted entities, which mislead the topic detection process. For instance, in an article about
20It is worth noticing that while THD has an option to restrict entity extraction to named entities only or common entities (words)
only, we verify that the experiment uses the combined strategy, where both named entities and common words are detected.
21The trials followed the setup of the WP6 trials in relation to personalization, in which the omission of YAGO-extracted entities
was deemed necessary to reduce the very large volume of information retrieved by THD per article, which caused delays in
real-time data trafficking.
© LinkedTV Consortium, 2015 33/69](https://image.slidesharecdn.com/linkedtvd2-150715090538-lva1-app6891/85/LinkedTV-Deliverable-2-7-Final-Linked-Media-Layer-and-Evaluation-33-320.jpg)

![Final Linked Media Layer and Evaluation D2.7
In 2013, the task focused on the search of a known video segment in a archive collection using a query
provided by a user in the form of text [12]. This framework is based on an assumption that writing text is
the most straightforward mean for a user to formulate a query: the user doesn’t need any input image (for
which (s)he would need to perform a preliminary image search or need drawing skills). In this situation,
a query is constituted of two parts: the first part gives information for a text search while the other part
provides cues on visual information in the relevant segments using words. We give two examples of
such queries below:
Query 1:
– Text query: Medieval history of why castles were first built
– Visual cues: Castle
Query 2:
– Text query: Best players of all time; Embarrassing England performances; Wake up call for English
football; Wembley massacre;
– Visual cues: Poor camera quality; heavy looking football; unusual goal celebrations; unusual crowd
reactions; dark; grey; overcast; black and white;
For the text-based search, the state-of-the-art methods perform sufficiently well. However, the visual
cues are not straightforwardly understandable by a computer, since some queries are not so easy to
interpret.
As these visual cues can be any text words, it is a challenging task to have a visual model for every
word of the text query. Thus, a basic candidate solution is to have a set of models for predefined visual
concepts (the maximum it covers, the better it is), and to map each word to its closest concept in the list.
Then, the models of the mapped concepts will be used as visual content models for each query.
Ideally, this mapping process should be done manually to avoid any intent gap between the query and
the mapped concepts. However, this is a very time consuming process, which may be subject to personal
interpretation and therefore error prone. Strong of these facts, this process should be automated, even
knowing that it will provide some noise in the mapping. Our framework uses a predefined mapping
between keywords from the visual cues and the visual concepts automatically computed using WordNet
distances. Each mapping is characterized by a confidence score, derived from the WordNet distances,
indicating how related a keyword and a visual concept are [38].
Instead, we want to study how to perform a joint query combining text and visual concepts for video
segment search. Using visual concepts relies on the accuracy of concept detectors, which can vary from
one concept to the other. Hence, the query used should be carefully designed and take into account the
confidence in different modules: concept mapping, concept detectors; It should also balance the part
given to text and visual concepts in the search.
In 2014, the framework of the Search sub-task has been changed in favour of large scale experiments
evaluation, i.e. the queries became more general to allow the ad-hoc search that implies more than one
relevant document within the collection [11]. At the same time the visual cues were no longer available for
these new queries, thus our investigation into the solutions for intention gap problem are confined within
2013 data set experiments, and 2014 data is used for testing implementations of LinkedTV components
combination.
5.1.2.2 Hyperlinking sub-task
Overall goal of the hyperlinking task is to generate a network of links between video segments within
an archive. At the MediaEval benchmark, the hyperlinking sub-task requires the participants to generate
a ranked list of video segments within the same collection that provide information about these initially
given list of video fragments that are otherwise named as anchors. The anchors are defined by their start
and end times within the video by the users, and these users gave a textual description of potentially
relevant target video segments. This textual description is not available for experiments, and is used
only at evaluation stage. This approach is taken to better imitate the real case scenario when all the
collection has to be indexed with anchors and targets before the actual user accesses it with a concrete
information need or interest. In these experiments we test the ability of our system to generate the lists
of video targets, given only the visual content of the anchor and corresponding transcript of the audio
channel.
© LinkedTV Consortium, 2015 43/69](https://image.slidesharecdn.com/linkedtvd2-150715090538-lva1-app6891/85/LinkedTV-Deliverable-2-7-Final-Linked-Media-Layer-and-Evaluation-43-320.jpg)
![Final Linked Media Layer and Evaluation D2.7
5.1.2.3 Evaluation metrics
For the known-item version of the Search sub-task there are 3 following metrics that address different
aspects of results ranking:
– the Mean Reciprocal Rank (MRR) assesses the ranks of the relevant segment returned for the
queries. It averages the multiplicative inverse of the ranks of the correct answers (within a given
time windows, here 60s).
– the Mean Generalized Average Precision (mGAP) is a variation of the previous that takes into
account the distance to the actual relevant jump-in point. Hence, this measure also takes into
account the start time of the segment returned.
– the Mean Average Segment Precision (MASP) assesses of the search in term of both precision of
the retrieved segments and the length of the segments that should be watched before reaching the
relevant content [13]. It takes into account the length of overlap between the returned segments
and the relevant segment. It hence favors segments whose boundaries are close to the expected
ones.
The results of both sub-tasks within the ad-hoc scenario were evaluated using the same procedure:
pooling of the top 10 results across all participants submissions, relevance assessment of those search
results and anchor/target pairs using crowdsourcing, i.e. workers at the Amazon Mechanical Turk plat-
form25. In this framework, precision at rank 10 is the most suitable metric to analyze the results, and we
use the binned version of it as defined by the task organisers in [1]
5.1.3 Motivation behind LinkedTV experiments within Search and Hyperlinking
5.1.3.1 Use of visual content to bridge the semantic gap in search
Popular search engines retrieve documents on the basis of textual information. This is especially the
case for text documents, but also is valid for images and videos, as they are often accompagnied with
textual metadata. Several research works attempt to include visual information based on input images
and/or on relevance feedback [43, 45, 32, 47].
The work of Hauptmann et al. [22] analyses the use of visual concepts only for video retrieval in the
scenario of a news collection. The authors study the impact of different factors: the number, the type
and the accuracy of concept detectors. They conclude that it is possible to reach valuable results within
a collection with fewer than 5000 concepts of modest quality. In their evaluation, they start from a query
directly constituted of concepts, while we propose to automate the concept mapping from a text query.
Nevertheless, they suggest the use of semi-automated methods for creating concepts-based queries.
Such work inspired the study of [19], although their focus is slightly different: they want to represent
events. They aim at creating a concept detectors vocabulary for event recognition in videos. In order
to derive useful concepts, they study the words used to describe videos and events. The resulting
recommendations on the concepts are the following: concepts should be diverse, both specific and
general. They also have results on the number of concepts to be used: vocabularies should have more
than 200 concepts, and it is better to increase the number of concept than the accuracy of the detectors.
Hamadi et al. [21] proposed a method, denoted as ’conceptual feedback’, to improve the overall
detection performance that implicitly takes into account the relations between concepts. The descriptor
of normalized detection scores was added to the pool of available descriptors, then a classification step
was applied on this descriptor. The resulting detection scores are finally fused with the already available
scores obtained with the original descriptors. They have concluded that significant improvement on
the indexing system’s performance can be achieved, when merging the classification scores of the
conceptual feedback with their original descriptors. However, they have evaluated their approach on
TRECVID 2012 semantic indexing task, which is based only on detecting semantic visual concepts, and
no text-based queries was used.
How much can different features (textual, low-level descriptors and visual concepts) contribute to
multimedia retrieval? The authors in [5] have addressed this question by studying the impact of different
descriptors, both textual and visual ones, for video hyperlinking. They concluded that the textual features
(in this case transcripts) performs the best for this task, while visual features by themselves (both low
level and high level) cannot predict reliable hyperlinks, due to a great variability in the results. Never-
theless, they suggest that using visual features for reranking results obtained from a text search slightly
25www.mturk.com
© LinkedTV Consortium, 2015 44/69](https://image.slidesharecdn.com/linkedtvd2-150715090538-lva1-app6891/85/LinkedTV-Deliverable-2-7-Final-Linked-Media-Layer-and-Evaluation-44-320.jpg)
![Final Linked Media Layer and Evaluation D2.7
improves the performance. In this paper, we endeavor to estimate how visual concepts can improve a
search, depending on the way they are used.
Another aspect of our framework is the automatic linking of a textual query to visual concepts through
a semantic mapping. Several works achieve this step by exploiting ontologies. In [44], the authors de-
veloped an OWL ontology of concept detectors that they have aligned with WordNet [15]. They question
whether semantically enriching detectors helps in multimedia retrieval tasks. Similarly, an ontology
based on LSCOM taxonomy [30] has been developped26, and has been aligned with ontologies such as
DBpedia27.
We focus on the use of visual information to improve content retrieval in a video collection. Indeed,
videos are visually very rich and it is not straightforward to exploit such data when searching for specific
content. This phenomena is commonly called semantic gap: there is no direct or easy match between
the meaning of a situation or an object, a concept, and the representation that can be made of it, in
particular by a computer [42]. Indeed, there is a gap between the low-level features extracted from an
image, and the high-level semantics that can be understood from it.
We propose and evaluate a video search framework using visual information, in the form of visual
concepts, for video retrieval. We report how much improvement this information can provide to the
search, and how we can tune this system to get better results. Indeed, we want to explore cross modality
between textual and visual features: we know text is able to give valuable results, but lacks the specificity
of the visual information, while visual features exploit this visual part but are not descriptive enough
by themselves. We argue that improved retrieval can be achieved by combining textual and visual
information to create an enriched query. Hence, we aim at designing a system that is able to query
not only the textual features, but also the visual ones. The originality of our work lies in the fact that
we start from a text query to perform the visual search: we attempt to overcome the semantic gap by
automatically mapping input text to semantic concepts.
This work proposes to evaluate the use of high-level semantic concepts in complementing text for
video retrieval. Text and visual concepts’ scores are calculated separately and we apply a late fusion
function to combine the results. We investigate the following two questions: i) to which extent can
visual concepts add information when retrieving videos? ii) How can we cope with the confidence in
visual concept detection? We answer to the above questions by first, studying an effective approach
for combining visual and textual information, then, investigating how reliable visual concept detectors
should be to achieve better improved performance, of multi-modal search on video database.
In MediaEval 2014 Search sub-task, queries are composed of a few keywords only (visual-cues are
not provided). Hence, the identification of relevant visual concepts is more complex than last year [11].
We propose two alternatives to this problem. On one hand, WordNet similarity is employed to map visual
concepts with query terms [37]. On the other hand, the query terms are used to perform a Google Image
search. Visual concept detection (using 151 concepts from the TRECVID SIN task [31]) is performed on
the first 100 returned images and concepts obtaining the highest average score are selected.
5.1.3.2 Temporal granularity to improve video segmentation for search and hyperlinking
As it is harder to browse through the video search results than in case of textual result lists, it is of
importance to find relevant segments that start close enough to the beginning of the relevant content.
Therefore we investigate into three temporal granularities of the content, i.e. the segmentation methods.
The first, termed Text-Segment, consists in grouping together sentences (up to 40) from the text sources.
We also propose to segment videos into scenes which consist of semantically correlated adjacent shots.
Two strategies are employed to create scene level temporal segments. Visually similar adjacent shots
are merged together to create Visual-scenes [40], while Topic-scenes are built by jointly considering the
aforementioned results of visual scene segmentation and text-based topical cohesion (exploiting text
extracted from ASR transcripts or subtitles).
5.1.4 LinkedTV Framework: Search sub-task 2013
Our proposed framework operates on any provided video collection with associated subtitles (or au-
tomatic speech recognition). First, we need to pre-process the video collection in order to extract and
index features (i.e. text, concepts, scenes), which are needed by our work. Text search is straightforward
26http://vocab.linkeddata.es/lscom/
27http://www.eurecom.fr/~atemezin/def/lscom/lscom-mappings.ttl
© LinkedTV Consortium, 2015 45/69](https://image.slidesharecdn.com/linkedtvd2-150715090538-lva1-app6891/85/LinkedTV-Deliverable-2-7-Final-Linked-Media-Layer-and-Evaluation-45-320.jpg)
![Final Linked Media Layer and Evaluation D2.7
with a search engine such as Lucene/Solr28. Nevertheless, it is different for a search based on visual
features: incorporating visual information in the search task requires to design a complex framework
that maps queries to a vocabulary of concepts and that is able to rank the videos segments accordingly.
Figure 15 illustrates this framework.
Figure 15: Our multimodal video retrieval framework
5.1.4.1 Pre-processing
We search for segments inside a video collection given a text query. For the experiments on 2013
dataset the videos are pre-segmented into scenes and we extract textual and visual features (visual
concepts) in order to give grounds to the search.
Scenes segmentation
As a video by itself is too long to present to the user, and it may not be relevant as a whole, we want
to retrieve meaningful segments of video. Shots are too short segments, hence we define scenes as
combinations of adjacent shots, that have temporal and visual consistency. We use the work proposed
in [41]. This algorithm, based on an extension of the Scene Transition Graph (STG) [57], groups video
shots by taking into account visual similarity (using HSV histogram comparisons) between temporally
adjacent shots represented by keyframes.
Concepts detection
For visual concept detection, we follow the approach presented in [39], which is based on the state-
of-art for content-based multimedia indexing (CBMI). CBMI systems consists of two main phases: the
modeling and indexing phases. In the modeling, the system should be extract different low-level features
form a training set (the labeled set) to build different descriptors based on the content, such as Color-
histograms, SIFT [28], Opponent-SIFT [52], bag-of-visual-words, etc. Then, for each concept a classifier
(e.g. SVM) should be trained on each type of these descriptors to obtain a classification model. This
model will be used to assign scores for new unlabeled samples (e.g. video-shots) as containing an
instance of the learned concept.
The indexing phase is achieved by extracting the same descriptors on the test set, and using the
learned model (on each descriptor) to predict the presence of the learned concept in these samples.
Then, for each sample per concept, the system assigns a predicted score by fusing its scores from all
the different models.
We directly use scores on the key-frame level, which are computed using a set of pre-calculated
classification models. These models were trained on 151 predefined concepts from the complete list of
concepts provided by TRECVid 2012 Semantic Indexing task (SIN) [31].
28http://lucene.apache.org/solr/
© LinkedTV Consortium, 2015 46/69](https://image.slidesharecdn.com/linkedtvd2-150715090538-lva1-app6891/85/LinkedTV-Deliverable-2-7-Final-Linked-Media-Layer-and-Evaluation-46-320.jpg)
![Final Linked Media Layer and Evaluation D2.7
5.1.4.2 Text-based scores computation: T We have used the search platform Lucene/Solr for in-
dexing textual features. We temporally aligned text from the subtitles to the scenes, performed base
processing (converting to lower-case, stop-words removal, etc) and indexed each scene in Lucene/Solr
together with its corresponding text.
Then, we compute the text-based scores by using Lucene’s default text search based on TF-IDF
representation and cosine similarity.
5.1.4.3 Visual-based scores computation: V
Concept detector scores for each scene: v
The concept scores extracted from the videos express the confidence that the corresponding concepts
appears in the main frame of each shot. By extension, we assume that they represent the confidence of
appearance for the entire shot.
We first normalize all the visual scores on a scale from 0 to 1 by a min-max normalization function.
This function aims to scale the scores for each concept, so that they all fall in a range of l to u bounds.
Thus, the visual scores values are normalized by subtracting the minimum and maximum score for each
concept and then applying the following equation on each bin value:
vij = l +
(u−l)×(vij −minj)
maxj −minj
(5)
where vij is the score of the jth concept for the ith frame, minj and maxj are respectively the minimum
and maximum score of the jth concept, and u and l are the new dimension space. Results in v are often
normalized to the [0,1] range. Then, the visual score v of each scene is obtained by the mean average
of its shots’ scores.
Valid detection rate: w
Concept scores are not normalized against each other: it is not possible to compare them, or to define a
threshold that provides a boolean result (whether the concept is present or not present). Nevertheless, in
order to have an insight on their performance, we manually created a valid detection score by examining
the top 100 images for each concept and counting the number of true positive. The percentage of true
positives found will be designated by valid detection rate w in the remaining of this document.
Mapping text-based visual cues to visual concepts
In the visual cues description, the user provides a textual description of what are the visual character-
istics of the video segment (s)he is looking for. As we propose to enhance the text-based search using
visual concepts, we need a mapping between the text-based query and the concepts that should be
found in the video, among the set of concepts that were computed.
For this mapping, we use the work reported in [38]. Keywords are extracted from the “visual cues”
using the Alchemy API29, and then each of those keywords is mapped with concepts for which a detector
is available. This was done by computing a semantic distance between the keyword and the names of
the concepts, based on Wordnet synsets [27]. Hence, each keyword was aligned to several concepts
with a confidence score: this score gives a clue on the proximity between the keyword and the concept.
In this work, we will study the impact of the confidence score β on the set of concepts Cq associated
to each query q, through its text-based visual cues. We plan to compute the performance of the system
with different thresholds θ that will automatically define the set of visual concepts which should be
included with each q. Given the set of concepts Cq for query q and a threshold θ, the selected concepts
C q are those having β ≥ θ.
An example of concept mapping is given in table 28, where, the term Castle was mapped to five
concepts (form the predefined set of concepts) with different associated confidence scores β-values.
Computing visual scores regarding each query
For each query q, we compute the visual score vq
i associated to every scene i as the following:
vq
i = ∑
c∈C q
wc ×vc
i , (6)
29http://www.alchemyapi.com/
© LinkedTV Consortium, 2015 47/69](https://image.slidesharecdn.com/linkedtvd2-150715090538-lva1-app6891/85/LinkedTV-Deliverable-2-7-Final-Linked-Media-Layer-and-Evaluation-47-320.jpg)
![Final Linked Media Layer and Evaluation D2.7
Table 28: Concepts mapped to the visual query from example "Castle", with their associated confidence
score β
Concept β
Windows 0.4533
Plant 0.4582
Court 0.5115
Church 0.6123
Building 0.701
where wc is the valid detection rate of concept c, which is used as a weight for the corresponding concept
detection score. vc
i is the score of scene i to contain the concept c. The sum is made over the selected
concepts C q.
Notice that when θ = 0, all the set of Cq is included. Therefore, evaluating the threshold θ is the main
objective of this paper and this will be compared with two baselines: i) using only text-based search and
ii) using text-based search with all available visual concepts C (e.g. the 151 visual concepts).
Fusion between text-based and visual-based scores
Scores of the scenes (T) based on the text feature are computed for each query. Independently, we
compute scores (V) based on visual attributes and apply late fusion between both in order to obtain the
final ranking of items. After these scores are calculated, the score of each scene is updated according
to its ti and vi scores. Many alternative fusion methods are applicable to such situation [14, 3]. Here, we
chose a simple weighting fusion function as follows:
si = tα
i +v1−α
i (7)
where α is a parameter in a range of [0,1] that controls the "strength" of the fusion method. There are
two critical values of α: α = 0 and α = 1. α = 1 gives the baseline (i), which corresponds to the initial text-
based scores only. α = 0 uses the visual scores of the corresponding concepts only, which are expected
to be very low on the considered task. However, this parameter has to be tuned by cross-validation
within a development set or different subsets.
5.1.5 LinkedTV Framework: Search sub-task 2014
5.1.5.1 Text-based methods
In this approach, relevant text and video segments are searched using Solr using text (TXT) only. Two
strategies are compared: one where search is performed at the text segment level directly (S) and one
where the first 50 videos are retrieved at the video level and then the relevant video segment is locate
using the scene-level index. The scene-level index granularity is either the Visual-Scene (VS) or the
Topic-Scene (TS). Scenes at both granularities are characterized by textual information only (either the
subtitle (M) or one of the 3 ASR transcripts ( (U) LIUM [36], (I) LIMSI [17], (S) NST/Sheffield [20])).
5.1.5.2 Multimodal Fusion method
Motivated by [37], visual concept scores are fused with text-based results from Solr to perform re-
ranking. Relevant visual concepts, out of the 151 available, for individual queries are identified using
either the WordNet (WN) or the GoogleImage (GI) strategy. For those multi-modal (MM) runs only
visual scene (VS) segmentation is evaluated.
5.1.6 LinkedTV Framework: Hyperlinking sub-task 2014
Pivotal to the hyperlinking task is the ability to automatically craft an effective query from the video an-
chor under consideration, to search within the annotated set of media. We submitted two alternative
approaches; One using the MoreLikeThis (MLT) Solr extension, and the other using Solr’s query en-
gine. MLT is used in combination with the sentence segments (S), using either text (MLT1) or text and
annotations [8] (MLT2). When Solr is used directly, we consider text only (TXT) or with visual concept
scores of anchors (MM) to formulate queries. Keywords appearing within the query anchor’s subtitles
compose the textual part of the query. Visual concepts whose scores within the query anchor exceed
the 0.7 threshold are identified as relevant to the video anchor and added to the Solr query. Both visual
(VS) and topic scenes (TS) granularities are evaluated in this approach.
© LinkedTV Consortium, 2015 48/69](https://image.slidesharecdn.com/linkedtvd2-150715090538-lva1-app6891/85/LinkedTV-Deliverable-2-7-Final-Linked-Media-Layer-and-Evaluation-48-320.jpg)
![Final Linked Media Layer and Evaluation D2.7
0
10
20
30
40
50
60
70
0.0 0.1 0.2 0.3 0.4 0.5 0.6 0.7 0.8 0.9 1.0
Numberofconcepts
w- values
#Concepts-in-range(w)
Figure 16: The predictor confidence scores of the visual concepts (w), for simplicity we show scores
grouped in ten ranges.
5.1.7 Experiments
5.1.7.1 Dataset
We conducted our work on the datasets offered by the MediaEval 2013-2014 Search and Hyperlinking
task, where the test set of 2013 edition became development set for 2014 experiments. The dataset con-
tains 2323 and 3520 videos from the BBC (amounting to 1697 hours and 2686 hours) for development
and test sets respectively. This represents the television content of all sort: news shows, talk shows,
series, documentaries, etc. The collection contains not only the videos and audio tracks, but also some
additional information such as subtitles, transcripts or metadata.
The queries and anchors for both 2013 and 2014 task editions were created by users at the premises
of BBC.They defined 50 and 30 search queries for the development and test sets accordignly, that are
related to video segments inside the whole collection; and 30 and 30 anchors for development and
test sets for the input for the Hyperlinking sub-task In case of the known-item search, each query is
associated with the video segment seeked by the user, described by the name of the video, the beginning
and end time of the segment inside the video. In case of an ad-hoc scenario, these relevant segments
were defined after the run submission.
5.1.7.2 Combining textual and visual information for effective multimedia search
Visual scores
To produce the visual scores we used the approach presented in [39], using a sub-set of ten different
low-level descriptors calculated on key-frames. Each detector was used to train a linear SVM on 151
semantic concepts of TRECVid 2012 SIN task, these results in ten SVM-models for each concept. The
same descriptors were computed on the considered dataset (i.e. Mediaeval 2013) and the models for
each concept were used to predict the presence of the concepts at each key-frame of our dataset. A
simple late fusion approach was applied on the ten scores for each key-frame and results in one score
for each concept per key-frame. These scores are then normalized by the min-max function. We have
no information about the quality of the models trained on TRECVid 2012, since only the scores on the
key-frames were provided to us. Thus, we have computed manually the performance of the models on
the first ranked 100 key-frames for each visual concept, which have the maximum predicted scores for
each concept. We have used these scores as the valid detection rate of each concept, denoted as w.
Figure 16 shows, the histogram of w values. As this histogram shows, there are many concepts
whose confidence score is equal to zero: w = 0. This means that these concepts will be ignored when
calculating the visual scores according to function 6.
In this paper, we also compare the performance of the system using these confidence detector scores
w and the case when having the same confidence for each detector, i.e. when w = 1.
Query mapping
Table 29 reports the minimum (Min), maximum (Max) and mean (Mean) number of concepts per query
with different thresholds θ on the mapping confidence β. It also shows the number of queries that have
© LinkedTV Consortium, 2015 49/69](https://image.slidesharecdn.com/linkedtvd2-150715090538-lva1-app6891/85/LinkedTV-Deliverable-2-7-Final-Linked-Media-Layer-and-Evaluation-49-320.jpg)
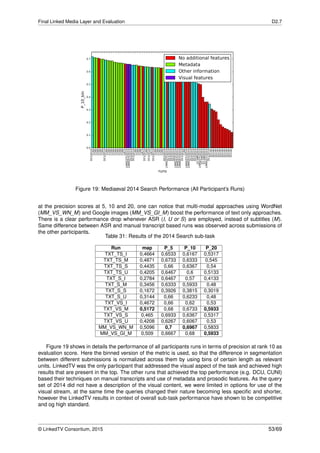
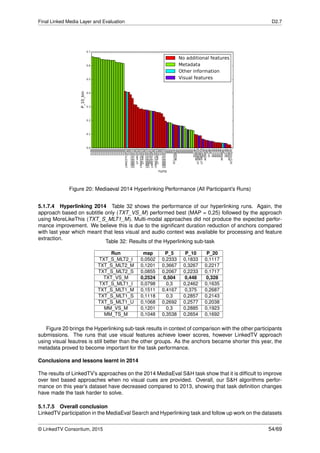
![Final Linked Media Layer and Evaluation D2.7
has shown that our approach to the task can significantly improve the quality of the results. Overall our
investigation into the use of visual cues found in the data and its temporal structure has shown that
our technique is competitive and manage to achieve high score results. Unfortunately the changes in
the 2014 task framework prevented us from direct development of methods that have proven to achieve
significantly better results on 2013 data set when dealing with user queries featuring visual cues (some-
what detailing the user intention when performing the query). However, even in new conditions of an
ad-hoc task, our techniques that vary size of segments depending on the structure of the scenes showed
promissing results that can be further advanced when combined with the usage of metadata that has
been shown of high importance for this task by other participants.
Our work was distiguished with a “Distinctive Mention Award” during the closing session of the Me-
diaEval 2014 workshop. Such results indicate that LinkedTV is currently providing one of the leading
technologies for Multimedia Search and Hyperlinking. We have also joined the team of researchers who
proposed to organise the hyperlinking sub-task as part of the TRECVID evaluation campaign 30.The
task has been accepted and already has 25 international registrations. This show high demand on the
development of these techniques. At the same time, at the MediaEval venue, the search sub-task stays
and will investigate further into the automatic anchor creation challenge. Representatives of our team
help to shape this new task for the 2015 edition.
5.2 TAC’14
In this section we report on the results on the participation of the UEP team in the English Entity Discov-
ery and Linking (EDL) track. The challenge was organized at the Text Analysis Conference 2014 (TAC)
under the Knowledge Base Population (KBP) track. Twenty teams submitted a total of 74 runs to the
TAC 2014 EDL track. The comparison with the team at position 10 depicted at Table 33 shows that our
best submission #2 underperformed the average F1 by 17%.
Table 33: The scores for the teams at rank 1, 10,11 and the LinkedTV submission in the strong typed
link match metric.
Team Precision Recall F1
Rank 1 0.717 0.642 0.678
Rank 10 0.445 0.595 0.509
Rank 11 0.433 0.583 0.497
linkedtv 0.409 0.415 0.412
This section is abridged report, which will be published in full within the TAC 2014 proceedings as
[10].
5.2.1 Task Description
This year, the Entity Linking task was extended also with full entity detection and classification. There
were the following subtasks: spotting entities in a document corpora, linking those entities with their
representation in a given reference knowledge base and classifying the entities with one of the following
types: PER (Person), GPE (Geo-Political Entity) and ORG (Organization). If the entity does not belong
to one of these classes, then it should not be added in the list of detected entities.
During the evaluation window each participation team was given a set of 138 documents to process.
The documents contained XML markup; sometimes also not valid. The participants were asked to
process not just the text content of the XML markup elements, but also the values of the XML attributes.
Furthermore, the organizers asked the participants not to extract entities from quoted text (inside the
quote element). The participants were also asked to adopt their systems for specific cases of entity
detection, e.g. recognizing two entities, poonam and poonam8, from the content <POSTER> poonam
<poonam8...@gmail.com> </POSTER>.
The systems had to output the results and provide “mention query file” containing the query id,
document id, namestring of the mention, its begin and end offset. Additionally, the system is required
to provide also “link ID file” providing information about the query id, reference knowledge base link (or
NIL link), entity type (PER, ORG or GPE) and a confidence score – if available.
30http://www-nlpir.nist.gov/projects/tv2015/tv2015.html
© LinkedTV Consortium, 2015 55/69](https://image.slidesharecdn.com/linkedtvd2-150715090538-lva1-app6891/85/LinkedTV-Deliverable-2-7-Final-Linked-Media-Layer-and-Evaluation-55-320.jpg)
![Final Linked Media Layer and Evaluation D2.7
5.2.2 Data Preparation
The reference knowledge base provides identification of the entities with custom identifiers (E.g., E0522900),
while our systems identify the entities with DBpedia URIs. Therefore, it was necessary to perform map-
ping of these identifiers.
In the reference knowledge base, each entity, in addition to the custom identifier, is also identified with
the name of the corresponding Wikipedia page. Since DBpedia derives the resource names from the
corresponding Wikipedia pages’ names, we could easily map a DBpedia resource URI to a Wikipedia
name and, consequently, to its unique identifier in the reference knowledge base. For example, the
person Sam Butler is identified with the DBpedia resource http://dbpedia.org/resource/Sam_Butler,
which is in the reference knowledge base identified with the Wikipedia page name Sam_Butler and the
custom identifier E0522900.
5.2.3 Entity Mention Detection
5.2.3.1 Pattern-Based Mention Detection This entity detection approach uses a manually crafted
lexico-syntactic pattern which utilize Part-Of-Speech tags. The pattern was written as JAPE grammar:
NNP+, where NNP is a proper noun tag. Before execution of the JAPE grammars, POS tags were
assigned using the ANNIE POS Tagger in the GATE framework.
5.2.3.2 Stanford NER Mention Detection In this entity detection approach was used the Stan-
ford Named Entity Recognizer [16], which is based on the state of the art Conditional Random Fields
model [29]. We used models trained based on the CoNLL 2003 [48] dataset.
5.2.4 Entity Linking
5.2.4.1 Lucene-based Entity Linking The Lucene-based linking is a context independent method,
which only uses the detected entity name when performing the entity linking. This approach links the
entity with the most-frequent-sense entity found in the reference knowledge base. To this end, we used a
specialized Lucene index, which extends the Apache Lucene search API. It primarily ranks pages based
on the number of backlinks and the Wikipedia articles’ titles. Note that this Lucene index is also used as
by the Wikipedia Search API. This baseline approach corresponded to our best performing submission
from TAC 2013 [9].
5.2.4.2 Lucene-based Entity Linking enhanced with Context To choose the most relevant entity
candidate, this approach combines the most frequent sense approach described in Subs. 5.2.4.1 with
the context around the entity. To retrieve the set of potential candidates, we submit a Lucene search
query with the entity name. The top-5 most relevant Wikipedia pages are considered as the potential
candidates. Next, we extract the entities (using Entityclassifier.eu) from the paragraph where the entity
occurs, and we also extract entities from the corresponding DBpedia abstract for each of the Wikipedia
candidate pages. Finally, the entity is linked with the page with the highest number of overlapping
entities.
5.2.4.3 Surface Form Index Entity Linking This approach approach uses a custom entity candidate
index. The candidate index contains all surface forms SW found in Wikipedia articles together with their
candidates Es (this corresponds to links and their anchor texts extracted from Wikipedia dump files).
Structure of the index is denoted in Figure 21. Together with each candidate e, ns
e keeps the record of
how many times the candidate occurred under the given surface form s.
Figure 21: Structure of the candidate index for s1,s2 ∈ SW , es
1,es
2 ∈ Es. Each record contains sorted set of
candidates together with counts of their occurrences under a given surface form.
© LinkedTV Consortium, 2015 56/69](https://image.slidesharecdn.com/linkedtvd2-150715090538-lva1-app6891/85/LinkedTV-Deliverable-2-7-Final-Linked-Media-Layer-and-Evaluation-56-320.jpg)
![Final Linked Media Layer and Evaluation D2.7
We experimented with various representations of surface forms in the index and methods of entity
linking taking into account co-occurrence of entities in the same paragraphs. The details of the final
algorithm are present in [10].
5.2.5 Entity Classification
5.2.5.1 Mappings Based Classification In this approach, we assume an entity is classified with a
DBpedia Ontology v3.9 fine-grained class and our task is to find an appropriate mapping to one of the
four entity types: Person (PER), Organization (ORG), Geo-political Entities (GPE) and Miscellaneous
(MISC). In this approach we manually established mappings between all 537 DBpedia classes, from the
DBpedia Ontology v3.9 to the four coarse grained types. Mappings to entity types are created according
to the “TAC KBP 2014 - Entity Linking Query Development Guidelines”.31
5.2.5.2 Supervised Classifier This approach uses a machine learning technique to classify the en-
tities into one of the four entity types: Person (PER), Organization (ORG), Geo-political Entities (GPE)
and Miscellaneous (MISC). As the training data we harvested DBpedia dataset using DBpedia SPARQL
endpoint32 so as to have a high number of three balanced entity types: PER 536×, ORG 451× and GPE
501×.33 Each DBpedia resource was represented as a vector of term frequencies (TF) of words from the
dbpedia-owl:abstract. Due to the high size of abstracts for DBpedia resources we applied 25% periodic
prunning of the original abstracts and eliminated common English words using stopwords. As a result,
the training dataset consists of 1488 instances represented by vectors of their TFs for 2403 attributes.
For entity classification we trained a supervised classifier based on the Support Vector Machines
(with linear kernel) using Weka wrapper for LibSVM34 library. Our classification model achieved 94%
accuracy in ten-fold cross-validation setting.
5.2.5.3 Stanford NER Based Classifier This approach uses the Stanford Named Entity Recognizer
[16] to classify the entity into one the four classes. StanfordNER distinguishes four coarse grained
types: Person (PER), Organization (ORG), Location (LOC) and Miscellaneous (MISC). While the PER
and ORG types are defined in the TAC 2014 the TAC 2014 Entity Discovery and Linking task, the LOC
was not present. Therefore, each entity of type LOC was mapped to the GPE type.
5.2.6 Submission Description
For the TAC KBP 2014 Entity Discovery and Linking task we have submitted three runs. Additionally,
after the submission, we experimented with variations of the methods and we evaluated two additional
runs. The descriptions of these runs follow.
Run #1. This run used the pattern based approach described in Sec 5.2.4.1 to detect entity mentions.
Each entity mention for further linked with the Lucene index approach described in Sec 5.2.4.1. To link
the entity we submit a Lucene search query with the entity name and the first non-disambiguation page
is considered as the correct entity link. If the entity is successfully linked, then our supervised classifier
described in Sec 5.2.5.2 assigns the entity to one of the four defined classes (PER, ORG, GPE or MISC).
If the model failed to classify into one of the four classes, we further processed the entity mention with
the StanfordNER and performed the classification. Only entity mentions which were classified as PER,
ORG, or GPE were included in the output.
Run #1v2. This run also uses the pattern-based approach to detect entity mentions and uses the
Lucene index to link with the first non-disambiguation page. The main purpose of this run is to evaluate
the supervised classifier. To this end, in this run we used the manual classification approach explained
in Sec 5.2.5.1. Since the manual classification requires DBpedia Ontology classes, the most specific
DBpedia Ontology class as returned by the Entityclassifier.eu NER was used to map to one of the three
required classes. If we failed to classify the entity, then the StanfordNER was used to perform the
classification.
Run #1v3. This run also uses the pattern-based approach to detect entities. The main purpose of this
run is to evaluate the quality of the Lucene-based linking approach used in run#1, which as a correct link
considers the first non-disambiguation page. Therefore, in this run, as the correct entity link we did not
skip the disambiguation pages, and the Wikipedia page with the highest rank in the Lucene index was
31TAC 2014 EDL Query Development Guidelines - http://nlp.cs.rpi.edu/kbp/2014/annotation.html
32http://dbpedia.org/sparql
33Entity is classified as MISC type if classifier cannot classify entity with sufficiently high confidence to other three entity types.
34http://www.csie.ntu.edu.tw/~cjlin/libsvm/
© LinkedTV Consortium, 2015 57/69](https://image.slidesharecdn.com/linkedtvd2-150715090538-lva1-app6891/85/LinkedTV-Deliverable-2-7-Final-Linked-Media-Layer-and-Evaluation-57-320.jpg)
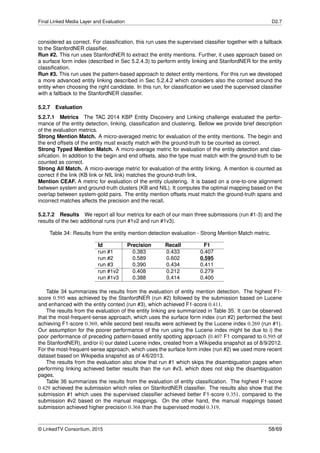
![Final Linked Media Layer and Evaluation D2.7
References
[1] Robin Aly, Maria Eskevich, Roeland Ordelman, and Gareth J. F. Jones. Adapting binary information
retrieval evaluation metrics for segment-based retrieval tasks. CoRR, abs/1312.1913, 2013.
[2] Maria-Luiza Antonie and Osmar R. Zaïane. Text document categorization by term association. In
ICDM ’02, Washington, DC, USA, 2002. IEEE Computer Society.
[3] Rachid Benmokhtar and Benoit Huet. An ontology-based evidential framework for video indexing
using high-level multimodal fusion. Multimedia Tools and Applications, pages 1–27, 2011.
[4] Christian Borgelt and Rudolf Kruse. Induction of association rules: A priori implementation, 2002.
[5] Shu Chen, Maria Eskevich, Gareth J. F. Jones, and Noel E O’Connor. An Investigation into Feature
Effectiveness for Multimedia Hyperlinking. In MMM14, 20th International Conference on MultiMedia
Modeling, pages 251–262, Dublin, Ireland, January 2014.
[6] Marco Cornolti, Paolo Ferragina, and Massimiliano Ciaramita. A framework for benchmark-
ing entity-annotation systems. In Proceedings of the International World Wide Web Conference
(WWW), 2013.
[7] W Bruce Croft, Donald Metzler, and Trevor Strohman. Search engines: Information retrieval in
practice. Addison-Wesley Reading, 2010.
[8] Milan Dojchinovski and Tomas Kliegr. Entityclassifier.eu: Real-Time Classification of Entities in
Text with Wikipedia. In Hendrik Blockeel, Kristian Kersting, Siegfried Nijssen, and Filip Železný,
editors, Machine Learning and Knowledge Discovery in Databases, volume 8190 of Lecture Notes
in Computer Science, pages 654–658. Springer Berlin Heidelberg, 2013.
[9] Milan Dojchinovski, Tomáš Kliegr, Ivo Lašek, and Ondˇrej Zamazal. Wikipedia search as effective
entity linking algorithm. In Text Analysis Conference (TAC) 2013 Proceedings. NIST, 2013.
[10] Milan Dojchinovski, Ivo Lašek, Ondˇrej Zamazal, and Tomáš Kliegr. Entityclassifier.eu and semitags:
Entity discovery, linking and classification with wikipedia and dbpedia. In Text Analysis Conference
(TAC) 2014 Proceedings. NIST, 2014. to appear.
[11] M. Eskevich, R. Aly, D. Racca, R. Ordelman, S. Chen, and G.J.F. Jones. The Search and Hyper-
linking Task at MediaEval 2014. In MediaEval 2014 Workshop, Barcelona, Spain, October 18-19
2014.
[12] M. Eskevich, J Gareth J.F., S. Chen, R. Aly, and R. Ordelman. The Search and Hyperlinking Task
at MediaEval 2013. In MediaEval 2013 Workshop, Barcelona, Spain, 2013.
[13] Maria Eskevich, Walid Magdy, and Gareth J. F. Jones. New metrics for meaningful evaluation of in-
formally structured speech retrieval. In Proceedings of the 34th European conference on Advances
in Information Retrieval, ECIR’12, pages 170–181, Berlin, Heidelberg, 2012. Springer-Verlag.
[14] Slim Essid, Marine Campedel, Gaël Richard, Tomas Piatrik, Rachid Benmokhtar, and Benoit Huet.
Machine learning techniques for multimedia analysis. John Wiley & Sons, Ltd, July 2011.
[15] Christiane Fellbaum, editor. WordNet: an electronic lexical database. MIT Press, 1998.
[16] Jenny Rose Finkel, Trond Grenager, and Christopher Manning. Incorporating non-local information
into information extraction systems by gibbs sampling. In Proceedings of the 43rd Annual Meet-
ing on Association for Computational Linguistics, pages 363–370. Association for Computational
Linguistics, 2005.
[17] Jean-Luc Gauvain, Lori Lamel, and Gilles Adda. The limsi broadcast news transcription system.
Speech Communication, 37(1):89–108, 2002.
[18] Dan Gillick and Jesse Dunietz. A new entity salience task with millions of training examples. In
Proceedings of the European Association for Computational Linguistics, 2014.
© LinkedTV Consortium, 2015 63/69](https://image.slidesharecdn.com/linkedtvd2-150715090538-lva1-app6891/85/LinkedTV-Deliverable-2-7-Final-Linked-Media-Layer-and-Evaluation-63-320.jpg)
![Final Linked Media Layer and Evaluation D2.7
[19] Amirhossein Habibian, Koen E.A. van de Sande, and Cees G.M. Snoek. Recommendations for
Video Event Recognition Using Concept Vocabularies. In Proceedings of the 3rd ACM Conference
on International Conference on Multimedia Retrieval, ICMR ’13, pages 89–96, Dallas, Texas, USA,
April 2013.
[20] Thomas Hain, Asmaa El Hannani, Stuart N Wrigley, and Vincent Wan. Automatic speech recogni-
tion for scientific purposes-webasr. In Interspeech, pages 504–507, 2008.
[21] Abdelkader Hamadi, Georges Quénot, and Philippe Mulhem. Conceptual Feedback for Semantic
Multimedia Indexing. In CBMI13, the 11th International Workshop on Content-Based Multimedia
Indexing, pages 53–58, Veszprèm, Hungary, June 2013.
[22] A. Hauptmann, Rong Yan, Wei-Hao Lin, M. Christel, and Howard Wactlar. Can High-Level Concepts
Fill the Semantic Gap in Video Retrieval? A Case Study With Broadcast News. Multimedia, IEEE
Transactions on, 9(5):958–966, 2007.
[23] Johannes Hoffart, Fabian M. Suchanek, Klaus Berberich, and Gerhard Weikum. YAGO2: A spatially
and temporally enhanced knowledge base from Wikipedia. Artificial Intelligence, 194:28–61, 2013.
[24] Tomás Kliegr and Ondˇrej Zamazal. Towards linked hypernyms dataset 2.0: complementing dbpe-
dia with hypernym discovery. In Proceedings of the Ninth International Conference on Language
Resources and Evaluation (LREC-2014), Reykjavik, Iceland, May 26-31, 2014., pages 3517–3523,
2014.
[25] Tomáš Kliegr. Linked hypernyms: Enriching DBpedia with Targeted Hypernym Discovery. Web
Semantics, 2015. In press.
[26] Tomáš Kliegr, Jaroslav Kuchaˇr, Davide Sottara, and Stanislav Vojíˇr. Learning business rules with
association rule classifiers. In Antonis Bikakis, Paul Fodor, and Dumitru Roman, editors, Rules on
the Web. From Theory to Applications, volume 8620 of Lecture Notes in Computer Science, pages
236–250. Springer International Publishing, 2014.
[27] Dekang Lin. An Information-Theoretic Definition of Similarity. In Proceedings of the Fifteenth In-
ternational Conference on Machine Learning, ICML ’98, pages 296–304, San Francisco, CA, USA,
1998.
[28] David G. Lowe. Distinctive Image Features from Scale-Invariant Keypoints. International Journal
of Computer Vision, 60(2):91–110, November 2004.
[29] Andrew McCallum and Wei Li. Early results for named entity recognition with conditional random
fields, feature induction and web-enhanced lexicons. In Proceedings of the seventh conference on
Natural language learning at HLT-NAACL 2003-Volume 4, pages 188–191. Association for Compu-
tational Linguistics, 2003.
[30] Milind Naphade, John R. Smith, Jelena Tesic, Shih-Fu Chang, Winston Hsu, Lyndon Kennedy,
Alexander Hauptmann, and Jon Curtis. Large-Scale Concept Ontology for Multimedia. IEEE Multi-
Media, 13(3):86–91, July 2006.
[31] Paul Over, George Awad, Martial Michel, Jonathan Fiscus, Greg Sanders, Barbara Shaw, Wessel
Kraaij, Alan F. Smeaton, and Georges Quénot. TRECVID 2012 – An Overview of the Goals, Tasks,
Data, Evaluation Mechanisms and Metrics. In Proceedings of TRECVID 2012. NIST, USA, 2012.
[32] Till Quack, Ullrich Mönich, Lars Thiele, and B. S. Manjunath. Cortina: A system for large-scale,
content-based web image retrieval. In Proceedings of the 12th Annual ACM International Confer-
ence on Multimedia, MULTIMEDIA ’04, pages 508–511, New York, NY, USA, 2004. ACM.
[33] José Luis Redondo Garcia, Laurens De Vocht, Raphael Troncy, Erik Mannens, and Rik Van de
Walle. Describing and contextualizing events in tv news show. In Proceedings of the Companion
Publication of the 23rd International Conference on World Wide Web Companion, WWW Compan-
ion ’14, pages 759–764, Republic and Canton of Geneva, Switzerland, 2014. International World
Wide Web Conferences Steering Committee.
[34] Giuseppe Rizzo, Marieke van Erp, and Raphaël Troncy. Benchmarking the Extraction and Disam-
biguation of Named Entities on the Semantic Web. In 9th International Conference on Language
Resources and Evaluation (LREC’14), 2014.
© LinkedTV Consortium, 2015 64/69](https://image.slidesharecdn.com/linkedtvd2-150715090538-lva1-app6891/85/LinkedTV-Deliverable-2-7-Final-Linked-Media-Layer-and-Evaluation-64-320.jpg)
![Final Linked Media Layer and Evaluation D2.7
[35] M. Röder, R. Usbeck, S. Hellmann, D. Gerber, and A. Both. N3 - a collection of datasets for
named entity recognition and disambiguation in the nlp interchange format. In The 9th edition of
the Language Resources and EvaluationConference, 26-31 May, Reykjavik, Iceland, 2014.
[36] Anthony Rousseau, Paul Deléglise, and Yannick Estève. Enhancing the ted-lium corpus with se-
lected data for language modeling and more ted talks. In LREC 2014, 2014.
[37] Bahjat Safadi, Mathilde Sahuguet, and Benoit Huet. When textual and visual information join forces
for multimedia retrieval. In ICMR 2014, ACM International Conference on Multimedia Retrieval, April
1-4, 2014, Glasgow, Scotland, Glasgow, UNITED KINGDOM, 04 2014.
[38] Mathilde Sahuguet, Benoit Huet, Barbora Cervenkova, Evlampios Apostolidis, Vasileios Mezaris,
Daniel Stein, Stefan Eickeler, Jose Luis Redondo Garcia, and Lukas Pikora. LinkedTV at MediaE-
val 2013 search and hyperlinking task. In MEDIAEVAL 2013, Multimedia Benchmark Workshop,
Barcelona, Spain, October 2013.
[39] Panagiotis Sidiropoulos, Vasileios Mezaris, and Ioannis Kompatsiaris. Enhancing Video concept
detection with the use of tomographs. In Proceedings of the IEEE International Conference on
Image Processing (ICIP), Melbourne, Australia, September 2013.
[40] Panagiotis Sidiropoulos, Vasileios Mezaris, Ioannis Kompatsiaris, Hugo Meinedo, Miguel Bugalho,
and Isabel Trancoso. Temporal Video Segmentation to Scenes Using High-Level Audiovisual Fea-
tures. IEEE Transactions on Circuits and Systems for Video Technology, 21(8):1163–1177, August
2011.
[41] Panagiotis Sidiropoulos, Vasileios Mezaris, Ioannis Kompatsiaris, Hugo Meinedo, Miguel Bugalho,
and Isabel Trancoso. Temporal Video Segmentation to Scenes Using High-Level Audiovisual Fea-
tures. IEEE Transactions on Circuits and Systems for Video Technology, 21(8):1163–1177, August
2011.
[42] Arnold W. M. Smeulders, Marcel Worring, Simone Santini, Amarnath Gupta, and Ramesh Jain.
Content-based image retrieval at the end of the early years. IEEE Transactions on Pattern Analysis
and Machine Intelligence, 22(12):1349–1380, 2000.
[43] John R. Smith and Shih-Fu Chang. VisualSEEk: a fully automated content-based image query
system. In Proceedings of the fourth ACM international conference on Multimedia, MULTIMEDIA
’96, pages 87–98, New York, NY, USA, 1996. ACM.
[44] C. G M Snoek, B. Huurnink, L. Hollink, M. de Rijke, G. Schreiber, and M. Worring. Adding Semantics
to Detectors for Video Retrieval. Multimedia, IEEE Transactions on, 9(5):975–986, 2007.
[45] David McG. Squire, Wolfgang Müller, Henning Müller, and Jilali Raki. Content-based query of image
databases, inspirations from text retrieval: Inverted files, frequency-based weights and relevance
feedback. In Pattern Recognition Letters, pages 143–149. Elsevier, 1999.
[46] Václav Zeman Stanislav Vojíˇr. Easyminer – next development, 2014. Technical report, University
of Economics, Prague.
[47] Franck Thollard and Georges Quénot. Content-Based Re-ranking of Text-Based Image Search
Results. In ECIR13,35th European Conference on IR Research, pages 618–629, Moscow, Russia,
March 2013.
[48] Erik F Tjong Kim Sang and Fien De Meulder. Introduction to the CoNLL-2003 shared task:
Language-independent named entity recognition. In Proceedings of the seventh conference on
Natural language learning at HLT-NAACL 2003-Volume 4, pages 142–147. Association for Compu-
tational Linguistics, 2003.
[49] Dorothea Tsatsou, Stamatia Dasiopoulou, Ioannis Kompatsiaris, and Vasileios Mezaris. Lifr: A
lightweight fuzzy dl reasoner. In 11th ESWC 2014 (ESWC2014), May 2014.
[50] Dorothea Tsatsou and Vasileios Mezaris. Lumo: The linkedtv user model ontology. In 11th ESWC
2014 (ESWC2014), May 2014.
© LinkedTV Consortium, 2015 65/69](https://image.slidesharecdn.com/linkedtvd2-150715090538-lva1-app6891/85/LinkedTV-Deliverable-2-7-Final-Linked-Media-Layer-and-Evaluation-65-320.jpg)
![Final Linked Media Layer and Evaluation D2.7
[51] Ricardo Usbeck, Michael Röder, Axel-Cyrille Ngonga Ngomo, Ciro Baron, Andreas Both, Mar-
tin Brümmer, Diego Ceccarelli, Marco Cornolti, Didier Cherix, Bernd Eickmann, Paolo Ferragina,
Christiane Lemke, Andrea Moro, Roberto Navigli, Francesco Piccinno, Giuseppe Rizzo, Harald
Sack, René Speck, Raphaël Troncy, Jörg Waitelonis, and Lars Wesemann. GERBIL – general
entity annotation benchmark framework. In 24th WWW conference, 2015.
[52] Koen van de Sande, Theo Gevers, and Cees Snoek. Evaluating Color Descriptors for Object and
Scene Recognition. IEEE Transactions on Pattern Analysis and Machine Intelligence, 32(9):1582–
1596, September 2010.
[53] Vadim von Brzeski, Utku Irmak, and Reiner Kraft. Leveraging context in user-centric entity detection
systems. In Proceedings of the Sixteenth ACM Conference on Conference on Information and
Knowledge Management, CIKM ’07, pages 691–700, New York, NY, USA, 2007. ACM.
[54] Milan Šim˚unek. Reuters-21578 text categorization test collection automated analysis using the
LISp-Miner system for purpose of the LinkedTV project, 2014. Technical report.
[55] Albert Weichselbraun, Daniel Streiff, and Arno Scharl. Linked enterprise data for fine grained
named entity linking and web intelligence. In Proceedings of the 4th International Conference on
Web Intelligence, Mining and Semantics (WIMS14), WIMS ’14, pages 13:1–13:11, New York, NY,
USA, 2014. ACM.
[56] William E Winkler. Overview of record linkage and current research directions. In Bureau of the
Census, 2006.
[57] Minerva Yeung, Boon-Lock Yeo, and Bede Liu. Segmentation of video by clustering and graph
analysis. Computer Vision and Image Understanding, 71(1):94–109, July 1998.
[58] Ondˇrej Zamazal and Tomáš Kliegr. Type inference in DBpedia from free text. Under review, 2015.
© LinkedTV Consortium, 2015 66/69](https://image.slidesharecdn.com/linkedtvd2-150715090538-lva1-app6891/85/LinkedTV-Deliverable-2-7-Final-Linked-Media-Layer-and-Evaluation-66-320.jpg)

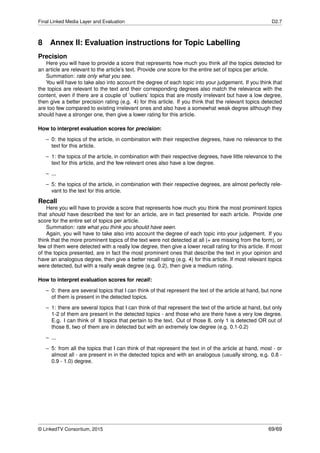

The deliverable D2.7 presents the evaluation of content annotation and enrichment systems developed by the LinkedTV consortium, focusing on linked news and culture trials in German, Dutch, and English. It details various evaluations, including benchmarking conducted in international contests and future challenges. The document spans 69 pages and includes contributions from multiple authors and institutions, highlighting advancements in web mining and video enrichment technologies.


