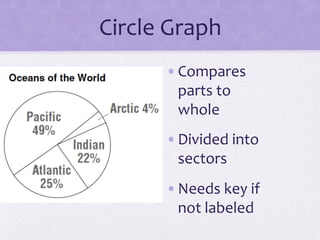
A circle graph compares parts to a whole by dividing data into sectors of a circle. It represents proportions or percentages of a whole through slices of a circle. A key may be needed if the sectors are not labeled to indicate what data each slice represents.