Download to read offline

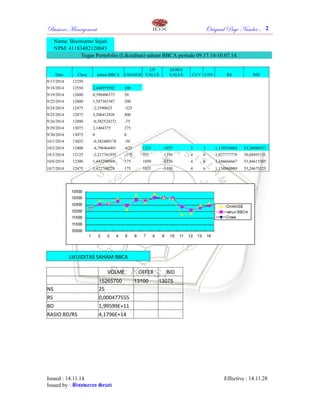
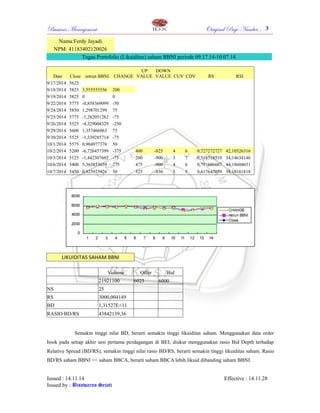

This document contains analysis of the liquidity of BBCA and BBNI stock prices from September 17, 2014 to October 7, 2014. It shows the daily closing prices, returns, and technical indicators like cumulative volume, cumulative value, relative strength, and relative strength index for each stock. It also includes data from the order book like volume, offer price, bid price, bid depth, and the bid depth to relative spread ratio for each stock. The analysis finds that BBCA stock has a higher bid depth to relative spread ratio, indicating it has higher liquidity than BBNI stock.


