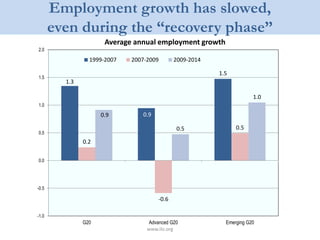
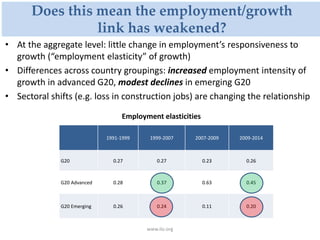
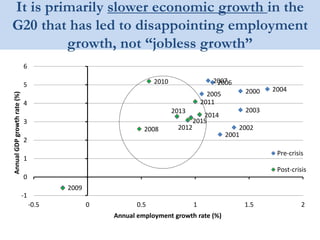
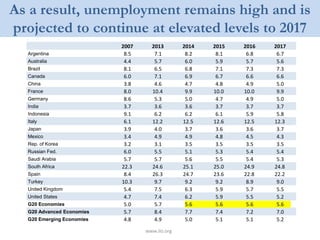
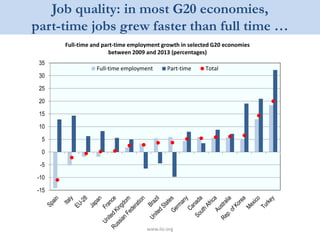
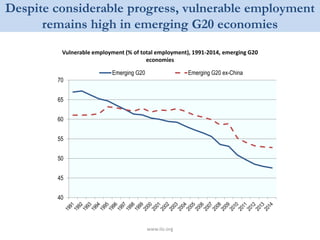
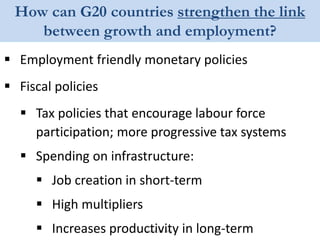
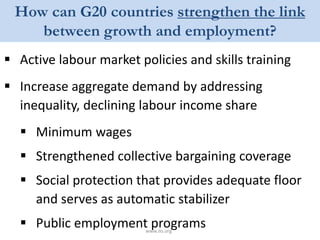
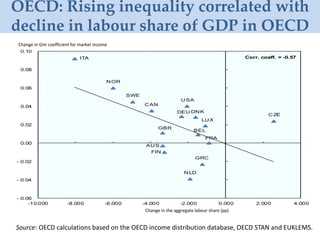
High Class Call Girls Nagpur Grishma Call 7001035870 Meet With Nagpur Escorts
G20 Labour Markets in 2015: Strengthening the Link between Employment and Growth
1. G20 Labour Markets in 2015:
Strengthening the Link between
Employment and Growth
G20 Labour and Employment
Ministerial Meeting
Ankara, Turkey
3 September 2015
2. Employment growth has slowed,
even during the “recovery phase”
www.ilo.org
1.3
0.9
1.5
0.2
-0.6
0.5
0.9
0.5
1.0
-1.0
-0.5
0.0
0.5
1.0
1.5
2.0
G20 Advanced G20 Emerging G20
1999-2007 2007-2009 2009-2014
Average annual employment growth
3. Does this mean the employment/growth
link has weakened?
www.ilo.org
Employment elasticities
1991-1999 1999-2007 2007-2009 2009-2014
G20 0.27 0.27 0.23 0.26
G20 Advanced 0.28 0.37 0.63 0.45
G20 Emerging 0.26 0.24 0.11 0.20
• At the aggregate level: little change in employment’s responsiveness to
growth (“employment elasticity” of growth)
• Differences across country groupings: increased employment intensity of
growth in advanced G20, modest declines in emerging G20
• Sectoral shifts (e.g. loss in construction jobs) are changing the relationship
4. It is primarily slower economic growth in the
G20 that has led to disappointing employment
growth, not “jobless growth”
2000
2001
2002
2003
2004
2005
20062007
2008
2009
2010
2011
2012
2013
2014
2015
-1
0
1
2
3
4
5
6
-0.5 0 0.5 1 1.5 2
AnnualGDPgrowthrate(%)
Annual employment growth rate (%)
Pre-crisis
Post-crisis
5. As a result, unemployment remains high and is
projected to continue at elevated levels to 2017
www.ilo.org
2007 2013 2014 2015 2016 2017
Argentina 8.5 7.1 8.2 8.1 6.8 6.7
Australia 4.4 5.7 6.0 5.9 5.7 5.6
Brazil 8.1 6.5 6.8 7.1 7.3 7.3
Canada 6.0 7.1 6.9 6.7 6.6 6.6
China 3.8 4.6 4.7 4.8 4.9 5.0
France 8.0 10.4 9.9 10.0 10.0 9.9
Germany 8.6 5.3 5.0 4.7 4.9 5.0
India 3.7 3.6 3.6 3.7 3.7 3.7
Indonesia 9.1 6.2 6.2 6.1 5.9 5.8
Italy 6.1 12.2 12.5 12.6 12.5 12.3
Japan 3.9 4.0 3.7 3.6 3.6 3.7
Mexico 3.4 4.9 4.9 4.8 4.5 4.3
Rep. of Korea 3.2 3.1 3.5 3.5 3.5 3.5
Russian Fed. 6.0 5.5 5.1 5.3 5.4 5.4
Saudi Arabia 5.7 5.7 5.6 5.5 5.4 5.3
South Africa 22.3 24.6 25.1 25.0 24.9 24.8
Spain 8.4 26.3 24.7 23.6 22.8 22.2
Turkey 10.3 9.7 9.2 9.2 8.9 9.0
United Kingdom 5.4 7.5 6.3 5.9 5.7 5.5
United States 4.7 7.4 6.2 5.9 5.5 5.2
G20 Economies 5.0 5.7 5.6 5.6 5.6 5.6
G20 Advanced Economies 5.7 8.4 7.7 7.4 7.2 7.0
G20 Emerging Economies 4.8 4.9 5.0 5.1 5.1 5.2
6. Incidence of long term unemployment (as a % of
total unemployment) varies across G20 countries
0
10
20
30
40
50
60
70
%
Q4 2007 Q1 2015
7. Job quality: in most G20 economies,
part-time jobs grew faster than full time …
www.ilo.org
Full-time and part-time employment growth in selected G20 economies
between 2009 and 2013 (percentages)
-15
-10
-5
0
5
10
15
20
25
30
35
Full-time employment Part-time Total
8. Intensity of employment growth above and below
US$4 per day to GDP growth in emerging G20
economies, 1991-2014
0.0
1.0
2.0
3.0
4.0
5.0
6.0
7.0
8.0
-1.5
-1.0
-0.5
0.0
0.5
1.0
1.5
2.0
2.5
3.0
Above US$4 Below US$4 Above US$4 Below US$4 Above US$4 Below US$4
1991-1999 1999-2007 2007-2014
AverageannualGDPgrowthrate(%)
Employmentelasticity
Employment elasticity (left axis) GDP growth (right axis)
9. Despite considerable progress, vulnerable employment
remains high in emerging G20 economies
www.ilo.org
Vulnerable employment (% of total employment), 1991-2014, emerging G20
economies
40
45
50
55
60
65
70
Emerging G20 Emerging G20 ex-China
10. How can G20 countries strengthen the link
between growth and employment?
www.ilo.org
Employment friendly monetary policies
Fiscal policies
Tax policies that encourage labour force
participation; more progressive tax systems
Spending on infrastructure:
Job creation in short-term
High multipliers
Increases productivity in long-term
11. How can G20 countries strengthen the link
between growth and employment?
www.ilo.org
Active labour market policies and skills training
Increase aggregate demand by addressing
inequality, declining labour income share
Minimum wages
Strengthened collective bargaining coverage
Social protection that provides adequate floor
and serves as automatic stabilizer
Public employment programs
12. OECD: Rising inequality correlated with
decline in labour share of GDP in OECD
Source: OECD calculations based on the OECD income distribution database, OECD STAN and EUKLEMS.
Source: OECD calculations based on the OECD income distribution
database, OECD STAN and EUKLEMS.
AUS
BEL
CAN
CZE
DEU DNK
FIN
FRA
GBR
GRC
ITA
LUX
NLD
NOR
SWE
USA
- 0.06
- 0.04
- 0.02
0.00
0.02
0.04
0.06
0.08
0.10
-10.000 -8.000 -6.000 -4.000 -2.000 0.000 2.000 4.000
Change in the aggregate labour share, percentage points
Change in the Gini coefficient for market income
Corr. coeff. = -0.57
Change in Gini coefficient for market income
Change in the aggregate labour share (pp)
13. Inequality and declining labour income share
are among the causes of slow growth
www.ilo.org
Recent work by ILO, OECD, IMF: An increasing body of
evidence shows that inequality slows and interrupts
economic growth. Different methodologies and
different data sets all yield the same conclusion.
Inequality has risen in most G20, reducing current and
potential growth and working against Leaders’ goal of
strong, sustainable and balanced growth and
additional 2% growth.
Social cohesion, political stability, further global
integration all negatively affected by inequality.