2
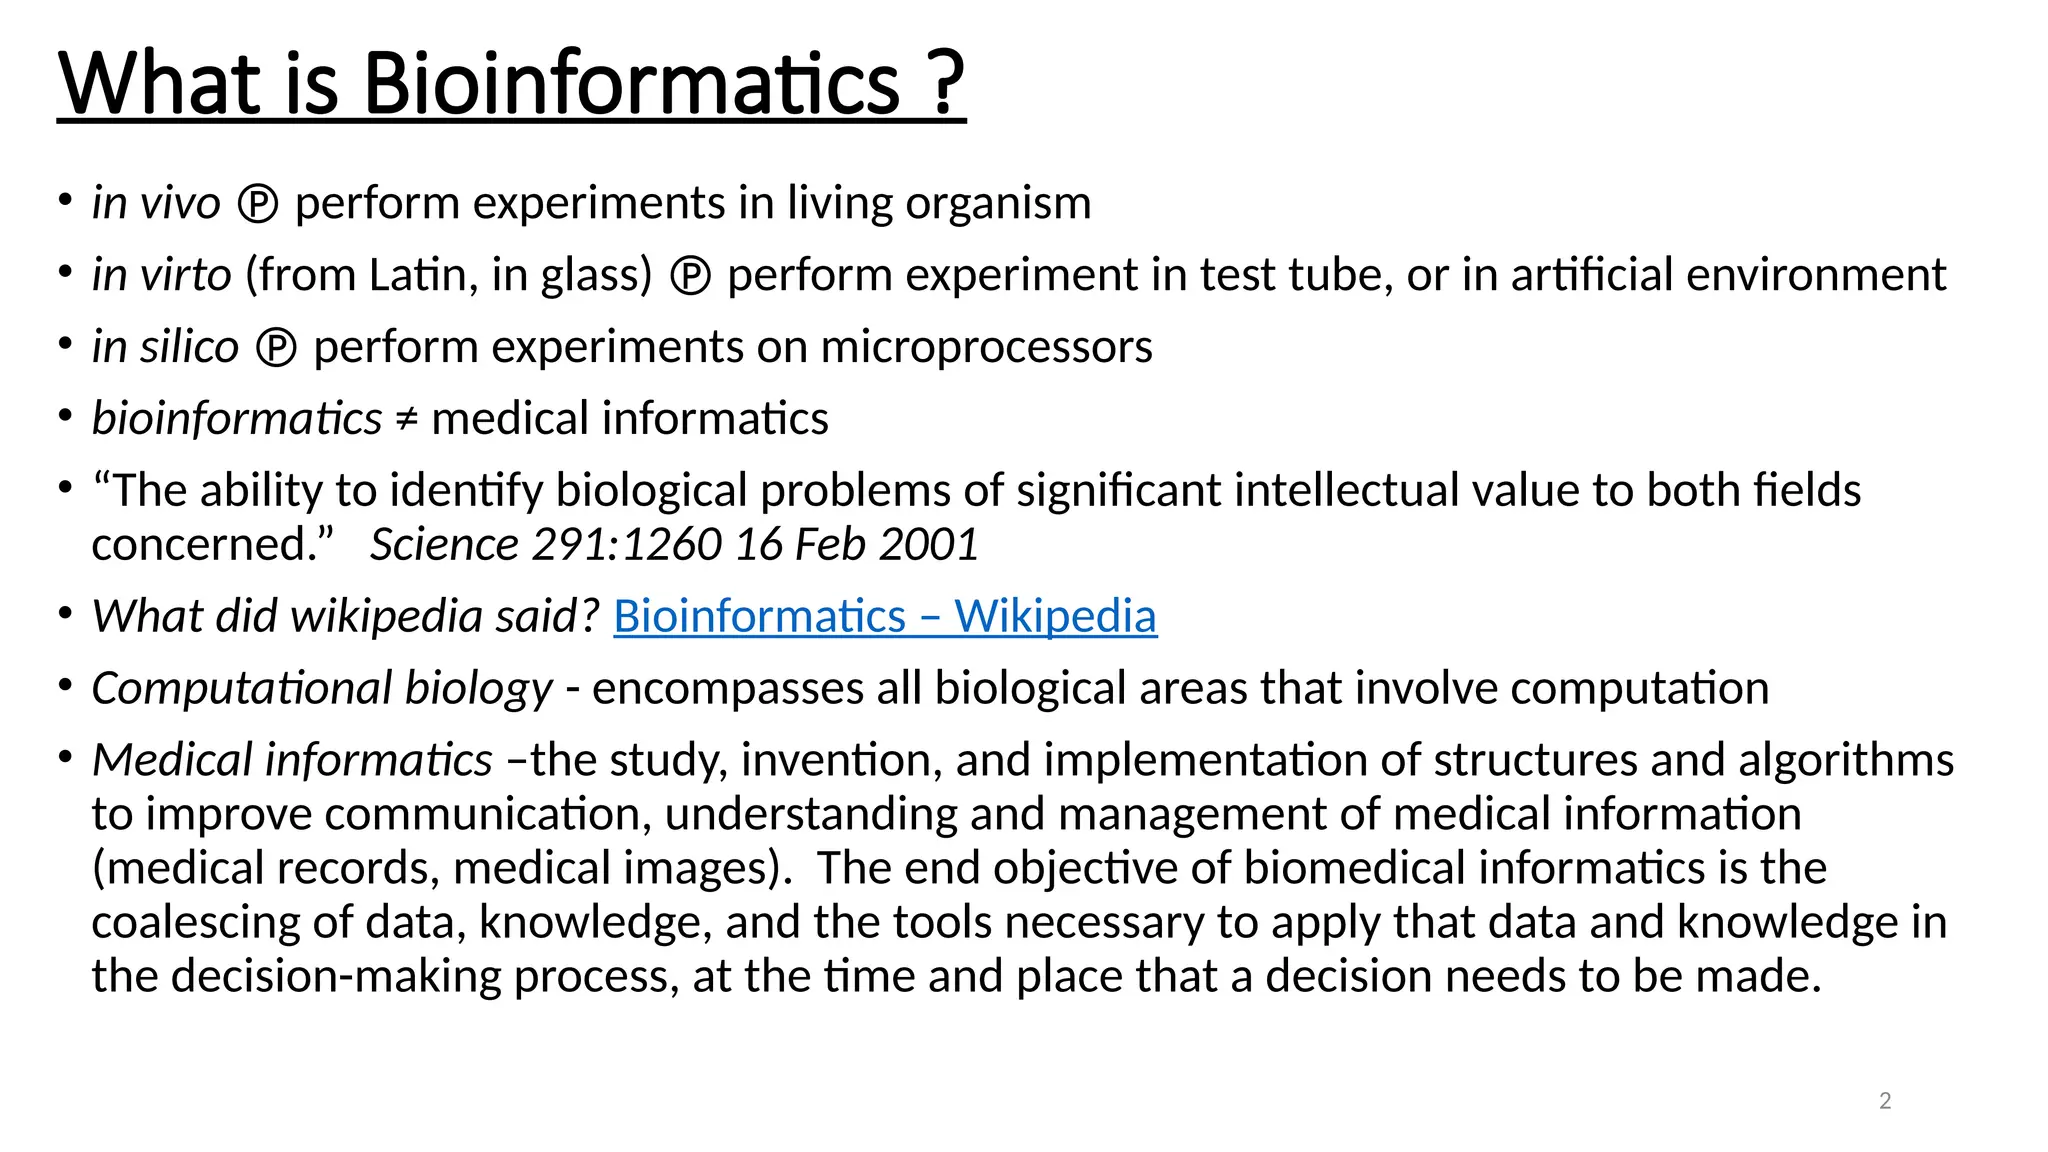
What is Bioinformatics?
• in vivo perform experiments in living organism
• in virto (from Latin, in glass) perform experiment in test tube, or in artificial environment
• in silico perform experiments on microprocessors
• bioinformatics ≠ medical informatics
• “The ability to identify biological problems of significant intellectual value to both fields
concerned.” Science 291:1260 16 Feb 2001
• What did wikipedia said? Bioinformatics – Wikipedia
• Computational biology - encompasses all biological areas that involve computation
• Medical informatics –the study, invention, and implementation of structures and algorithms
to improve communication, understanding and management of medical information
(medical records, medical images). The end objective of biomedical informatics is the
coalescing of data, knowledge, and the tools necessary to apply that data and knowledge in
the decision-making process, at the time and place that a decision needs to be made.
4
High level programminglanguage, scripting language, generation
of programming language
• What is High-Level Programming Language? Webopedia ...
• Scripting language – Wikipedia
• What's the difference between Scripting and Programming ...
• Generation of Programming Languages – GeeksforGeeks
• Comparison of C, MATLAB and Python
5.
5
Next generation ofprogramming languages: Julia, Gen & Q#
• Julia
• https://www.analyticsvidhya.com/blog/2015/07/julia-language-getting-started/
• Gen
• http://news.mit.edu/2019/ai-programming-gen-0626
• https://probcomp.github.io/Gen/
• Q#
• https://www.infoq.com/news/2019/05/microsoft-open-sources-qsharp/
6.
6
Steps for installationof R
• http://cran.r-project.org/ download R [For Windows, MacOS, Linux]
• Once R is successfully installed, double click on the R icon, the following
console will be shown up
7.
Steps for installationof Rstudio Desktop [Server]
https://www.rstudio.com/products/rstudio/download/
RStudio is just an IDE (Integrated Development Environment) in which you are using
the R language
Ref: What is the difference between R and RStudio? - Quora
What is the difference between R and R Studio program?
To identify R packages, read https://cran.r-project.org/ Task Views
Many other packages provided on Bioconductor, R-Forge, GitHub, etc.
read
http://www.bioconductor.org/
http://r-forge.r-project.org/
https://github.com/
Useful papers and information from Dr. Yanchang Zhao web site: RDataMining.com
Ref: http://www.rdatamining.com/docs
8.
8
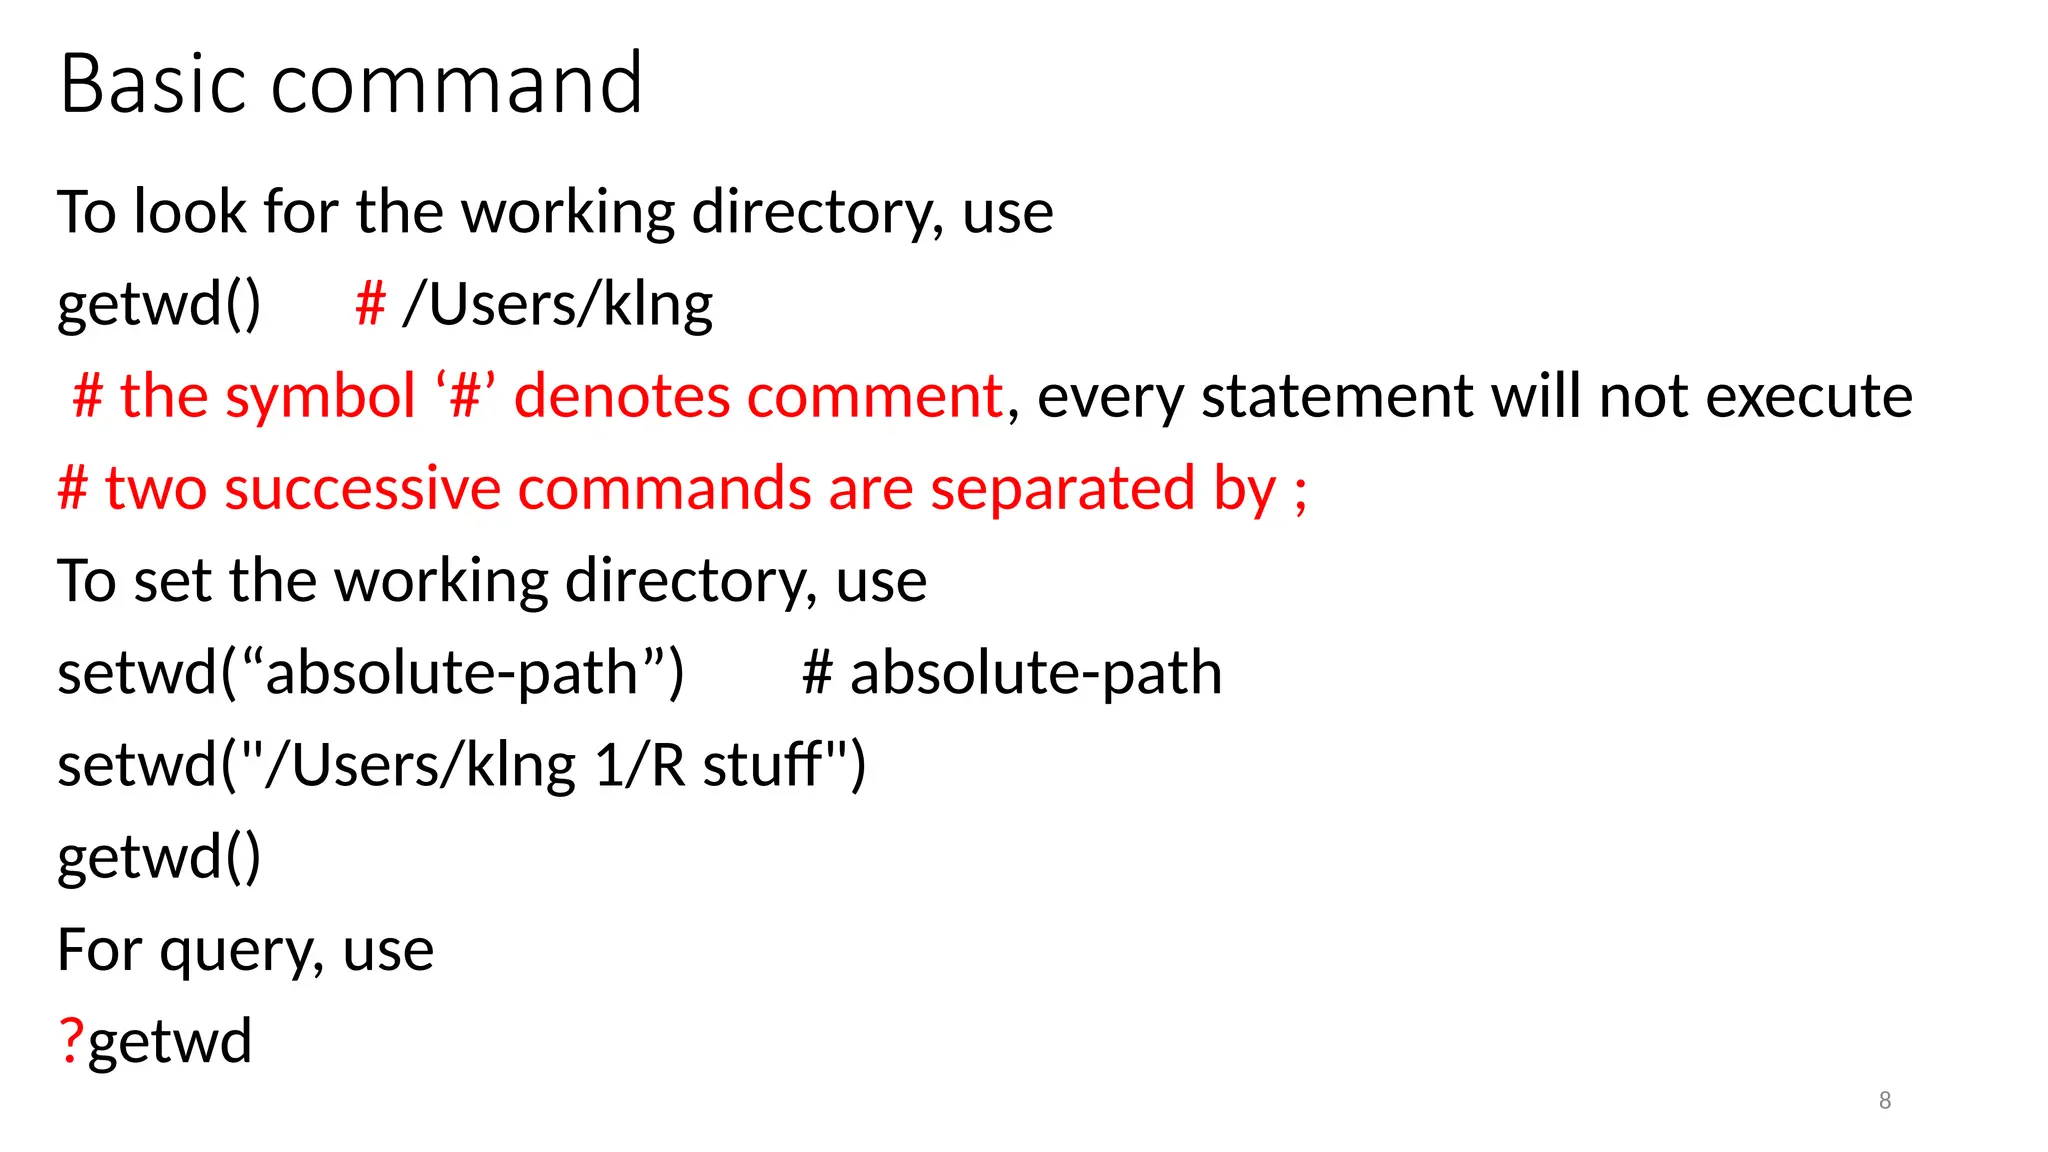
Basic command
To lookfor the working directory, use
getwd() # /Users/klng
# the symbol ‘#’ denotes comment, every statement will not execute
# two successive commands are separated by ;
To set the working directory, use
setwd(“absolute-path”) # absolute-path
setwd("/Users/klng 1/R stuff")
getwd()
For query, use
?getwd
9.
9
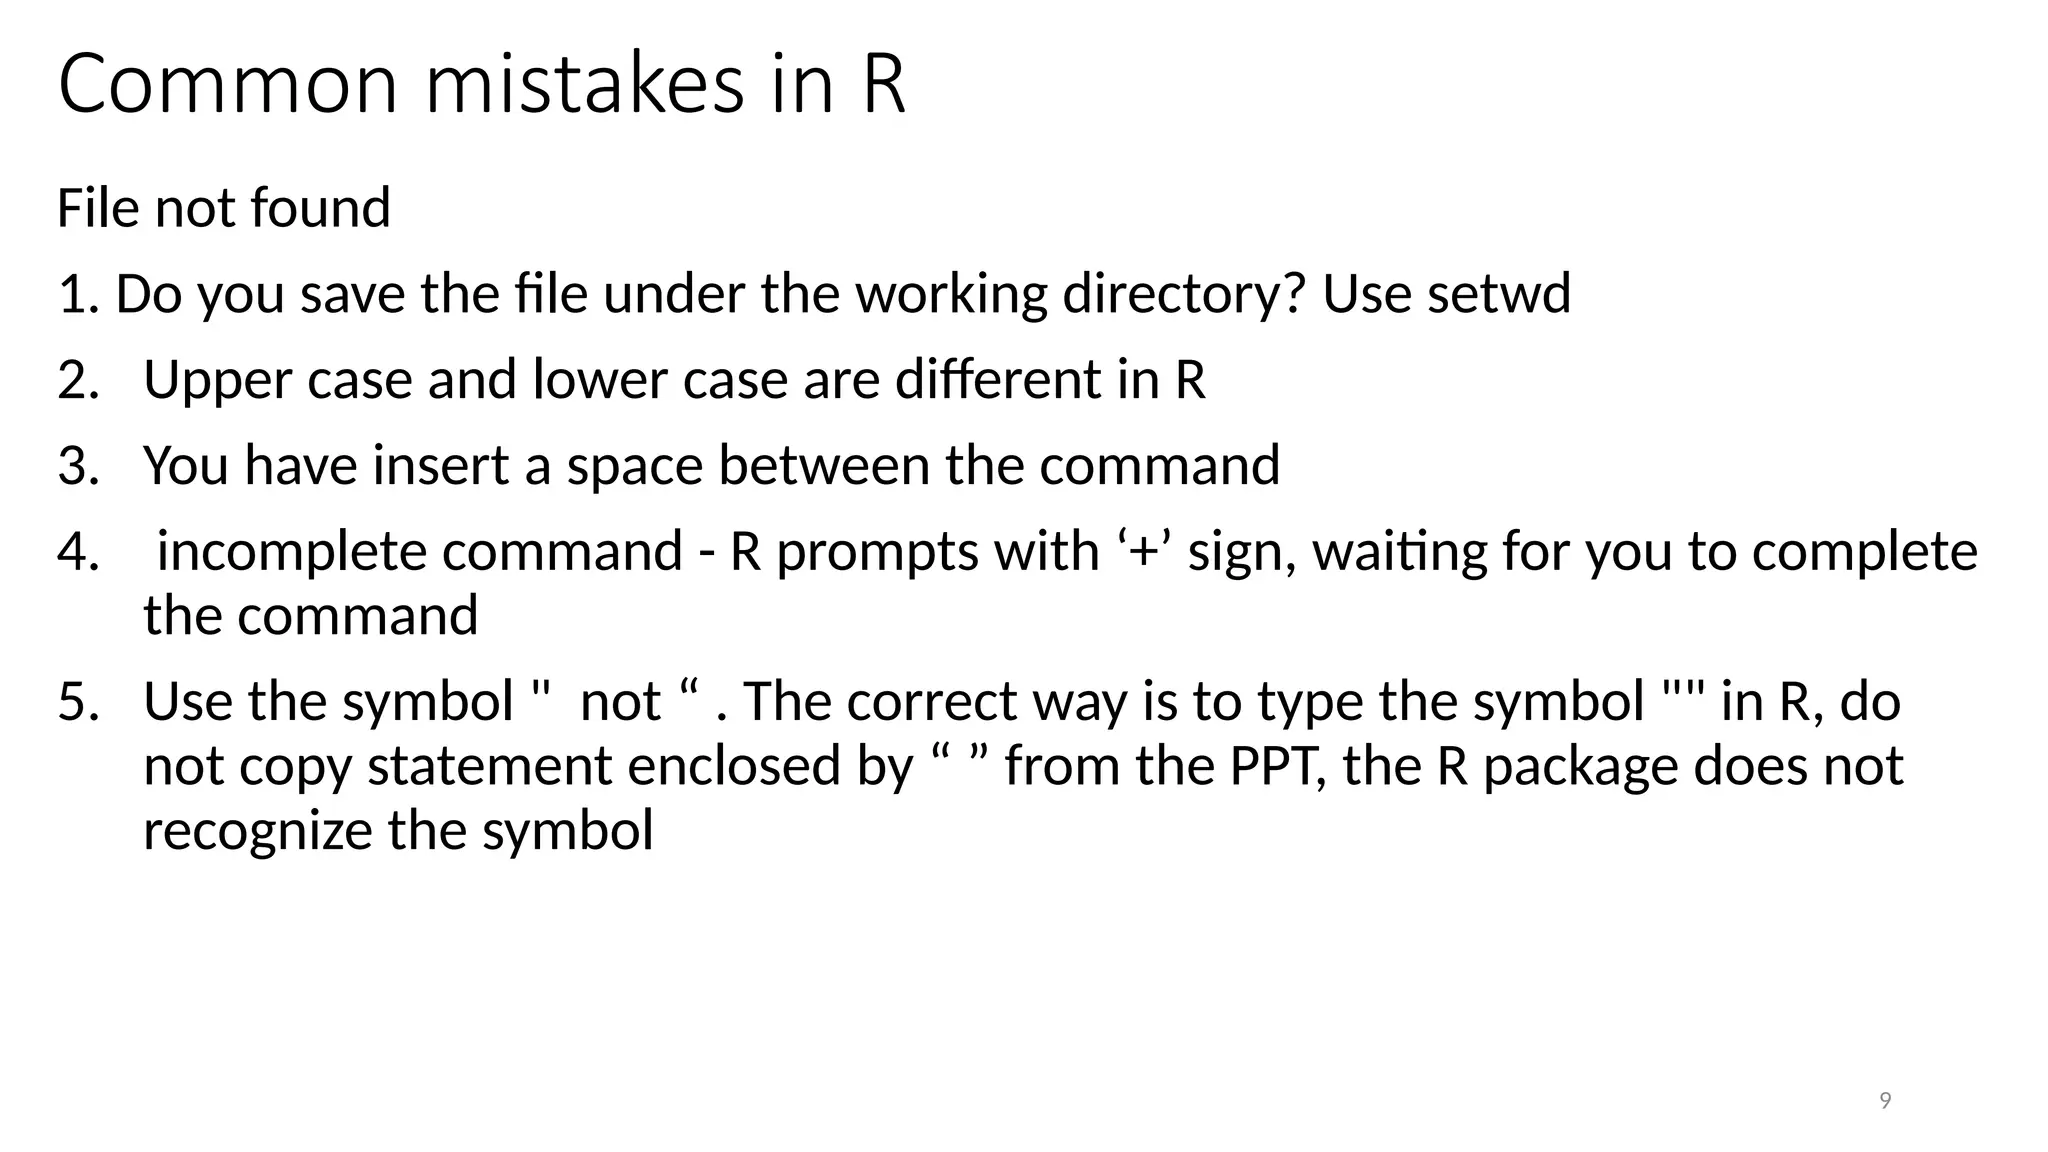
Common mistakes inR
File not found
1. Do you save the file under the working directory? Use setwd
2. Upper case and lower case are different in R
3. You have insert a space between the command
4. incomplete command - R prompts with ‘+’ sign, waiting for you to complete
the command
5. Use the symbol " not “ . The correct way is to type the symbol "" in R, do
not copy statement enclosed by “ ” from the PPT, the R package does not
recognize the symbol
11
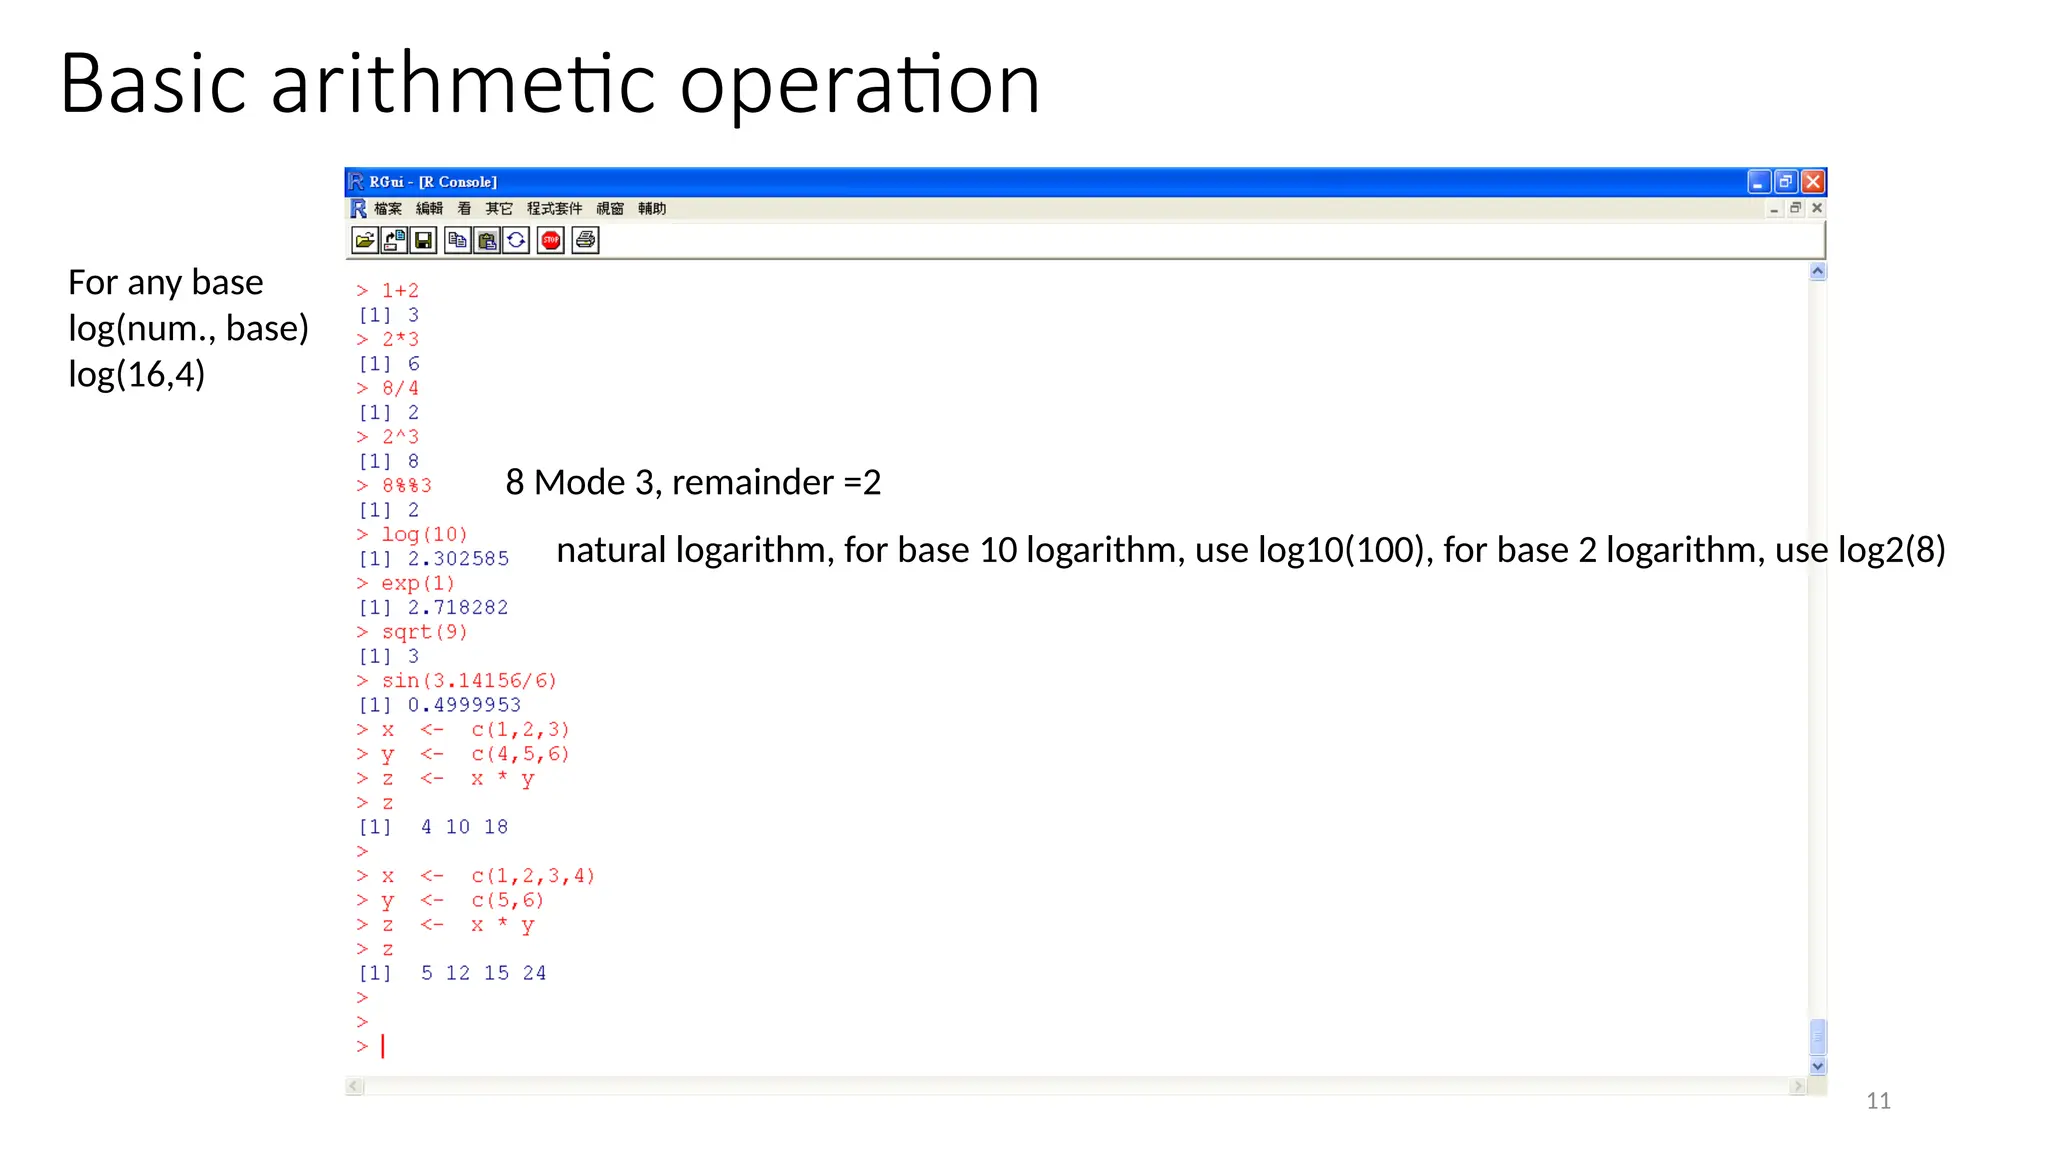
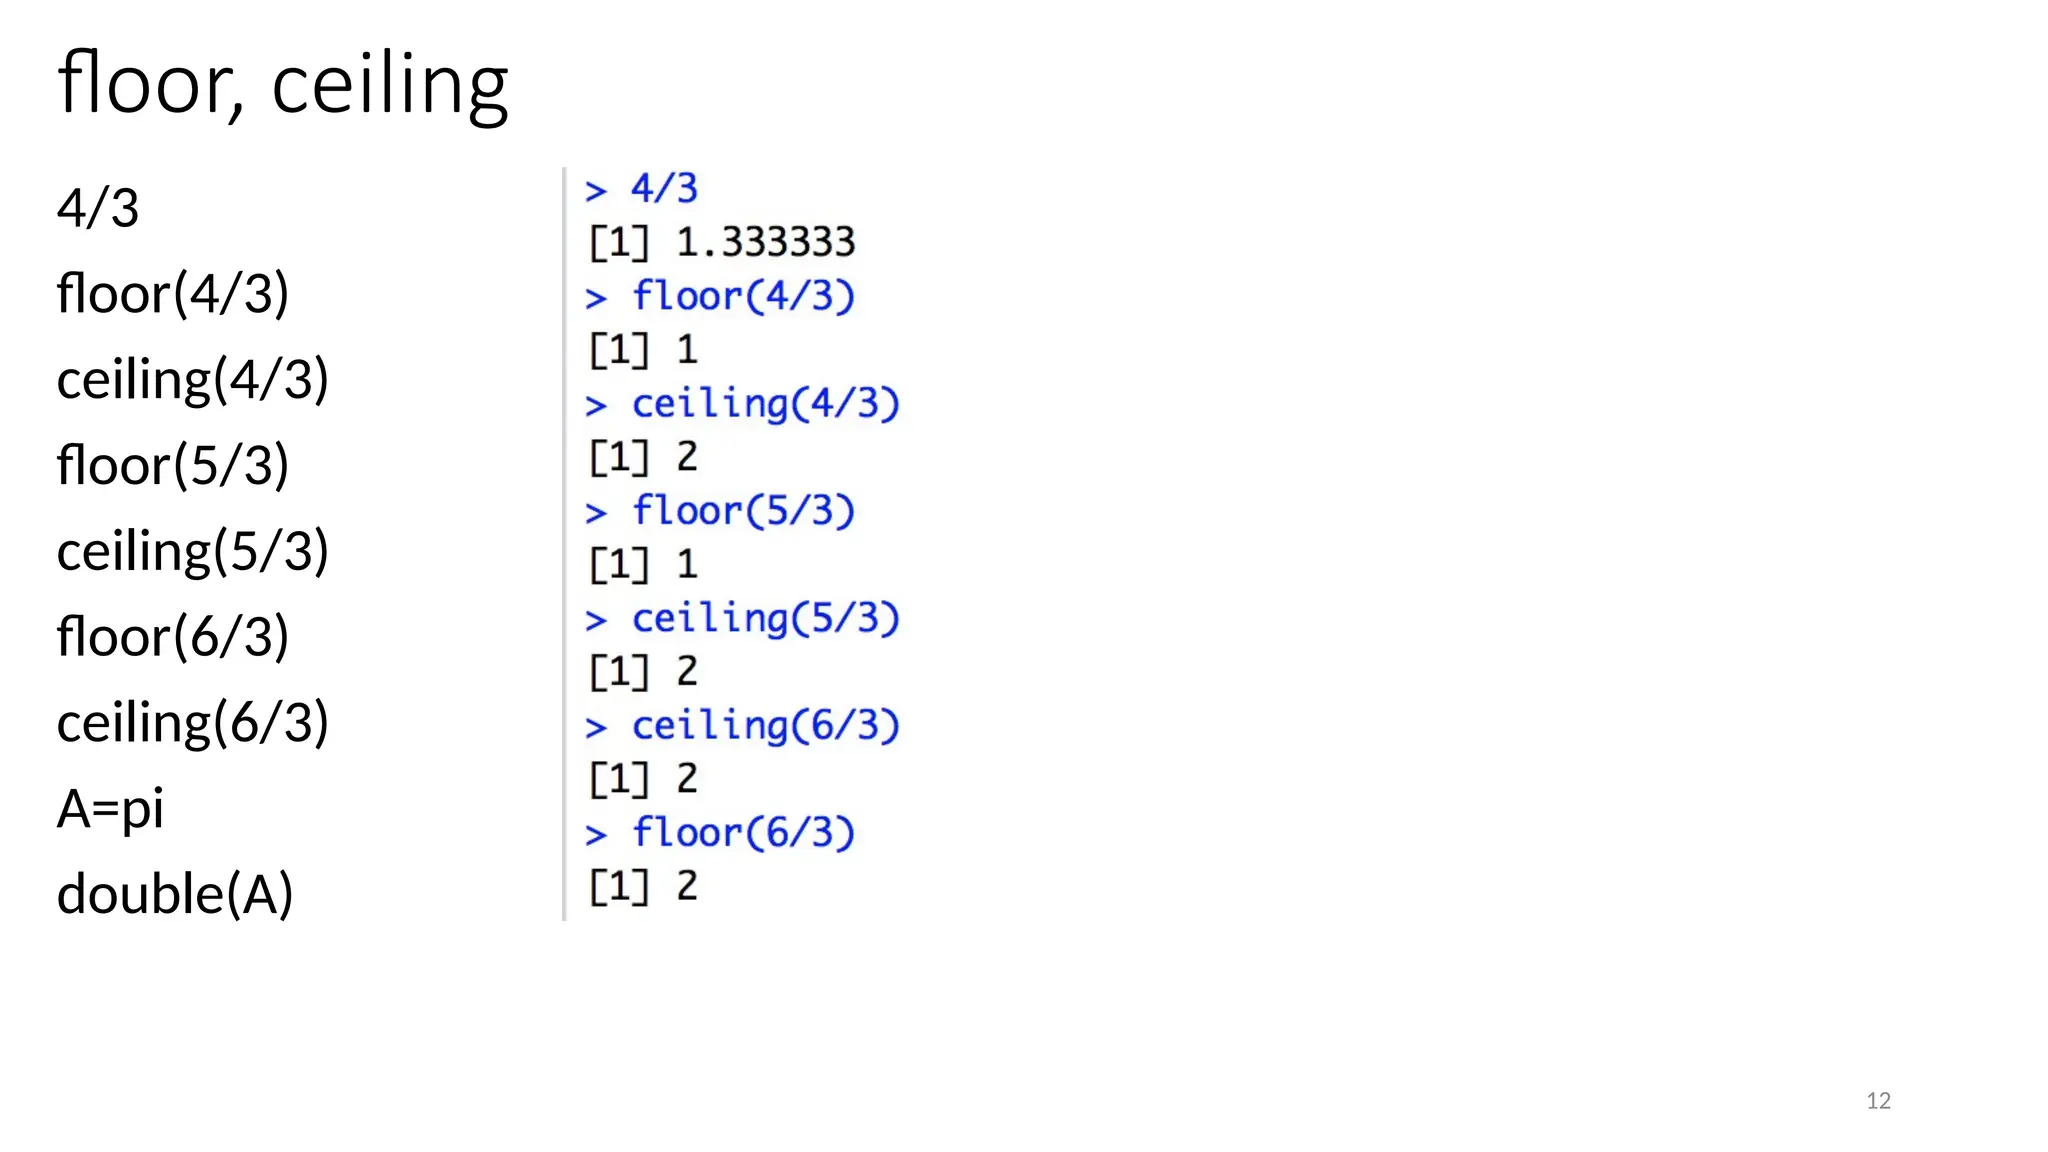
Basic arithmetic operation
naturallogarithm, for base 10 logarithm, use log10(100), for base 2 logarithm, use log2(8)
8 Mode 3, remainder =2
For any base
log(num., base)
log(16,4)
14
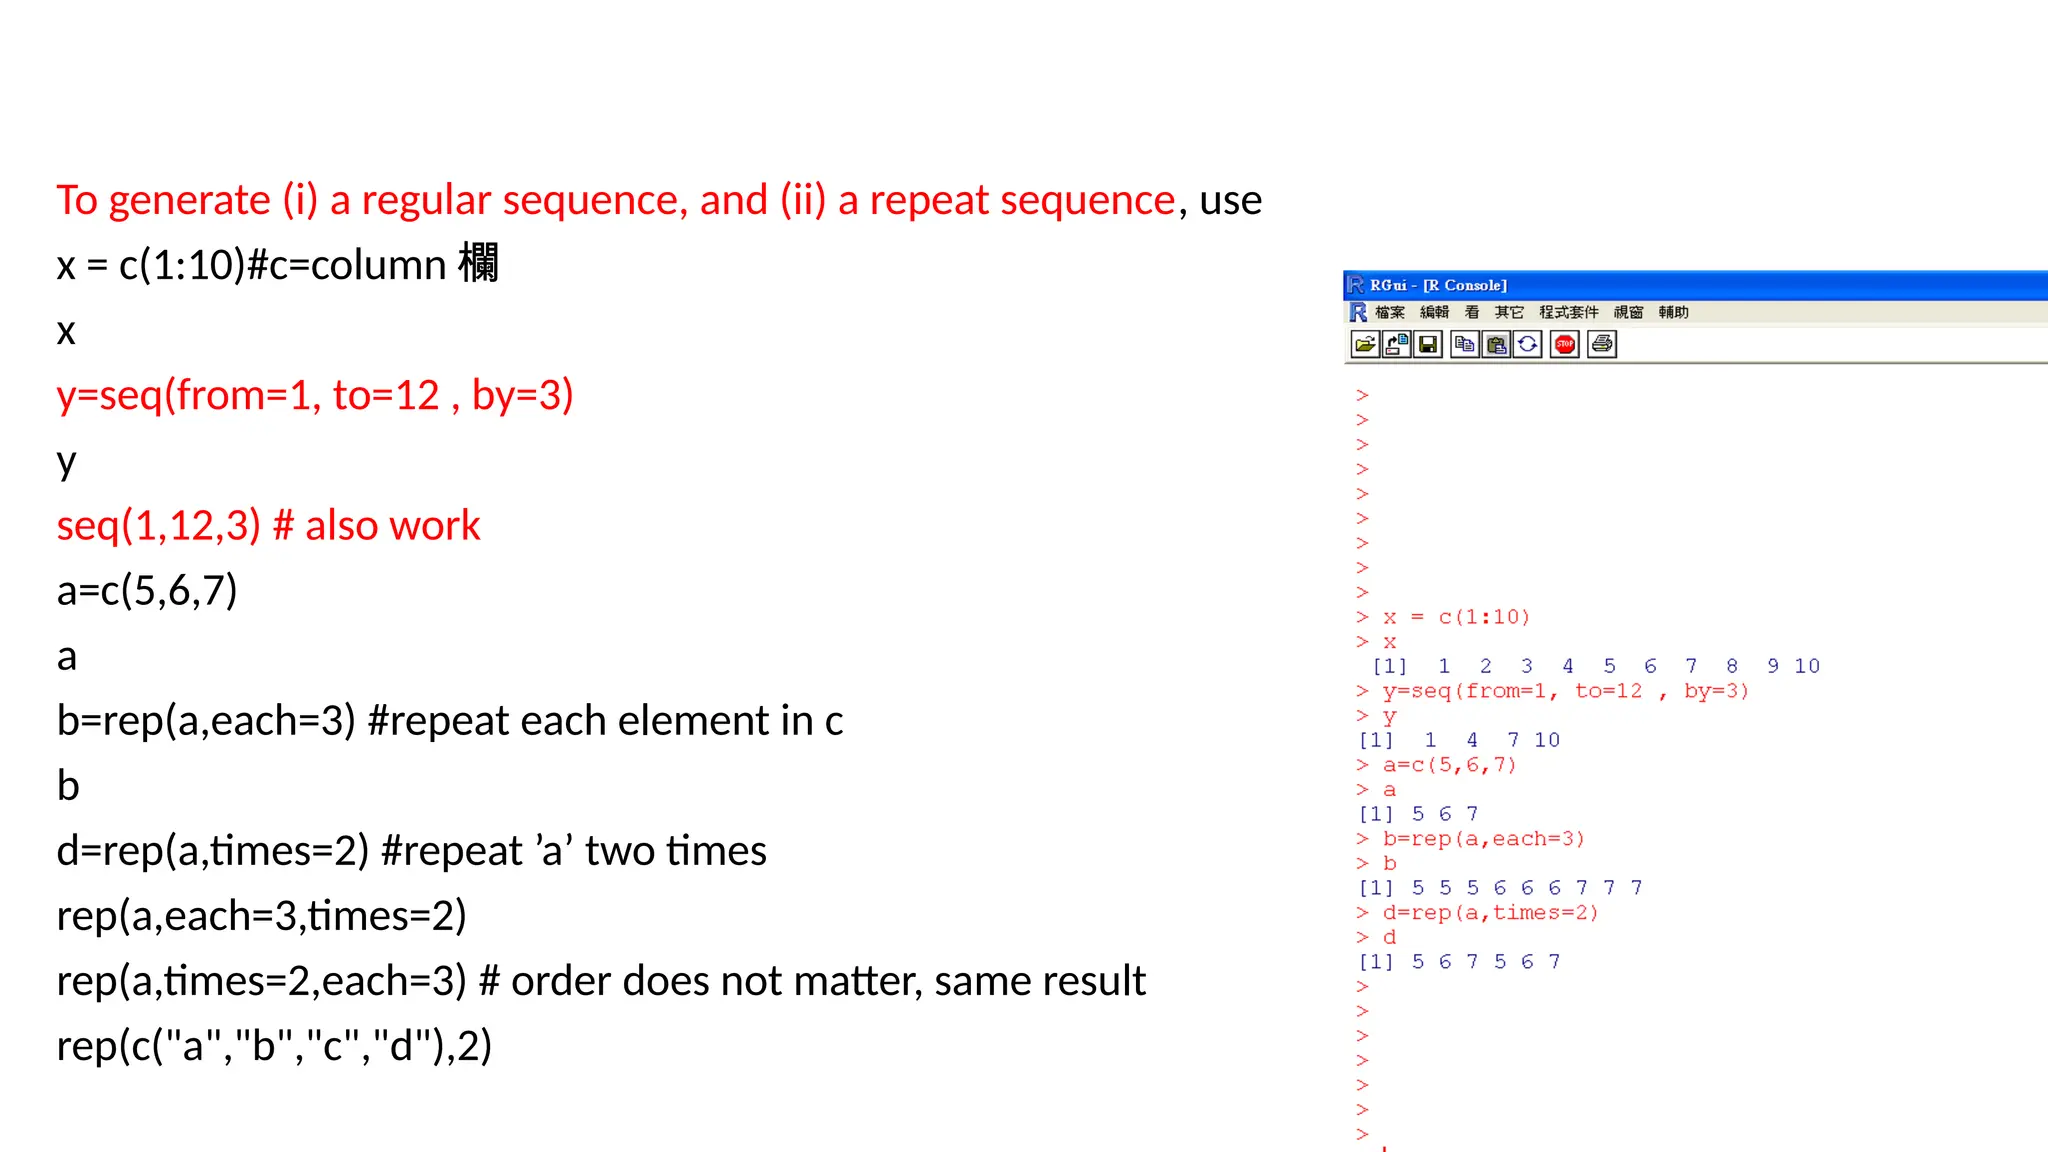
To generate (i)a regular sequence, and (ii) a repeat sequence, use
x = c(1:10)#c=column 欄
x
y=seq(from=1, to=12 , by=3)
y
seq(1,12,3) # also work
a=c(5,6,7)
a
b=rep(a,each=3) #repeat each element in c
b
d=rep(a,times=2) #repeat ’a’ two times
rep(a,each=3,times=2)
rep(a,times=2,each=3) # order does not matter, same result
rep(c("a","b","c","d"),2)
15.
15
seq(1,9,length=5)
#generate a sequencefrom 1 to 9 with 5-1= 4 equal intervals
# 1 3 5 7 9
#Application of ‘seq’: setting the x-axis scale for graphic
#Generate intervals [there are (length – 1) intervals]
A=seq(0,10,length=11);A
rev(A) # reverse the order
rank(A)
B=seq(1,10,length=10);B
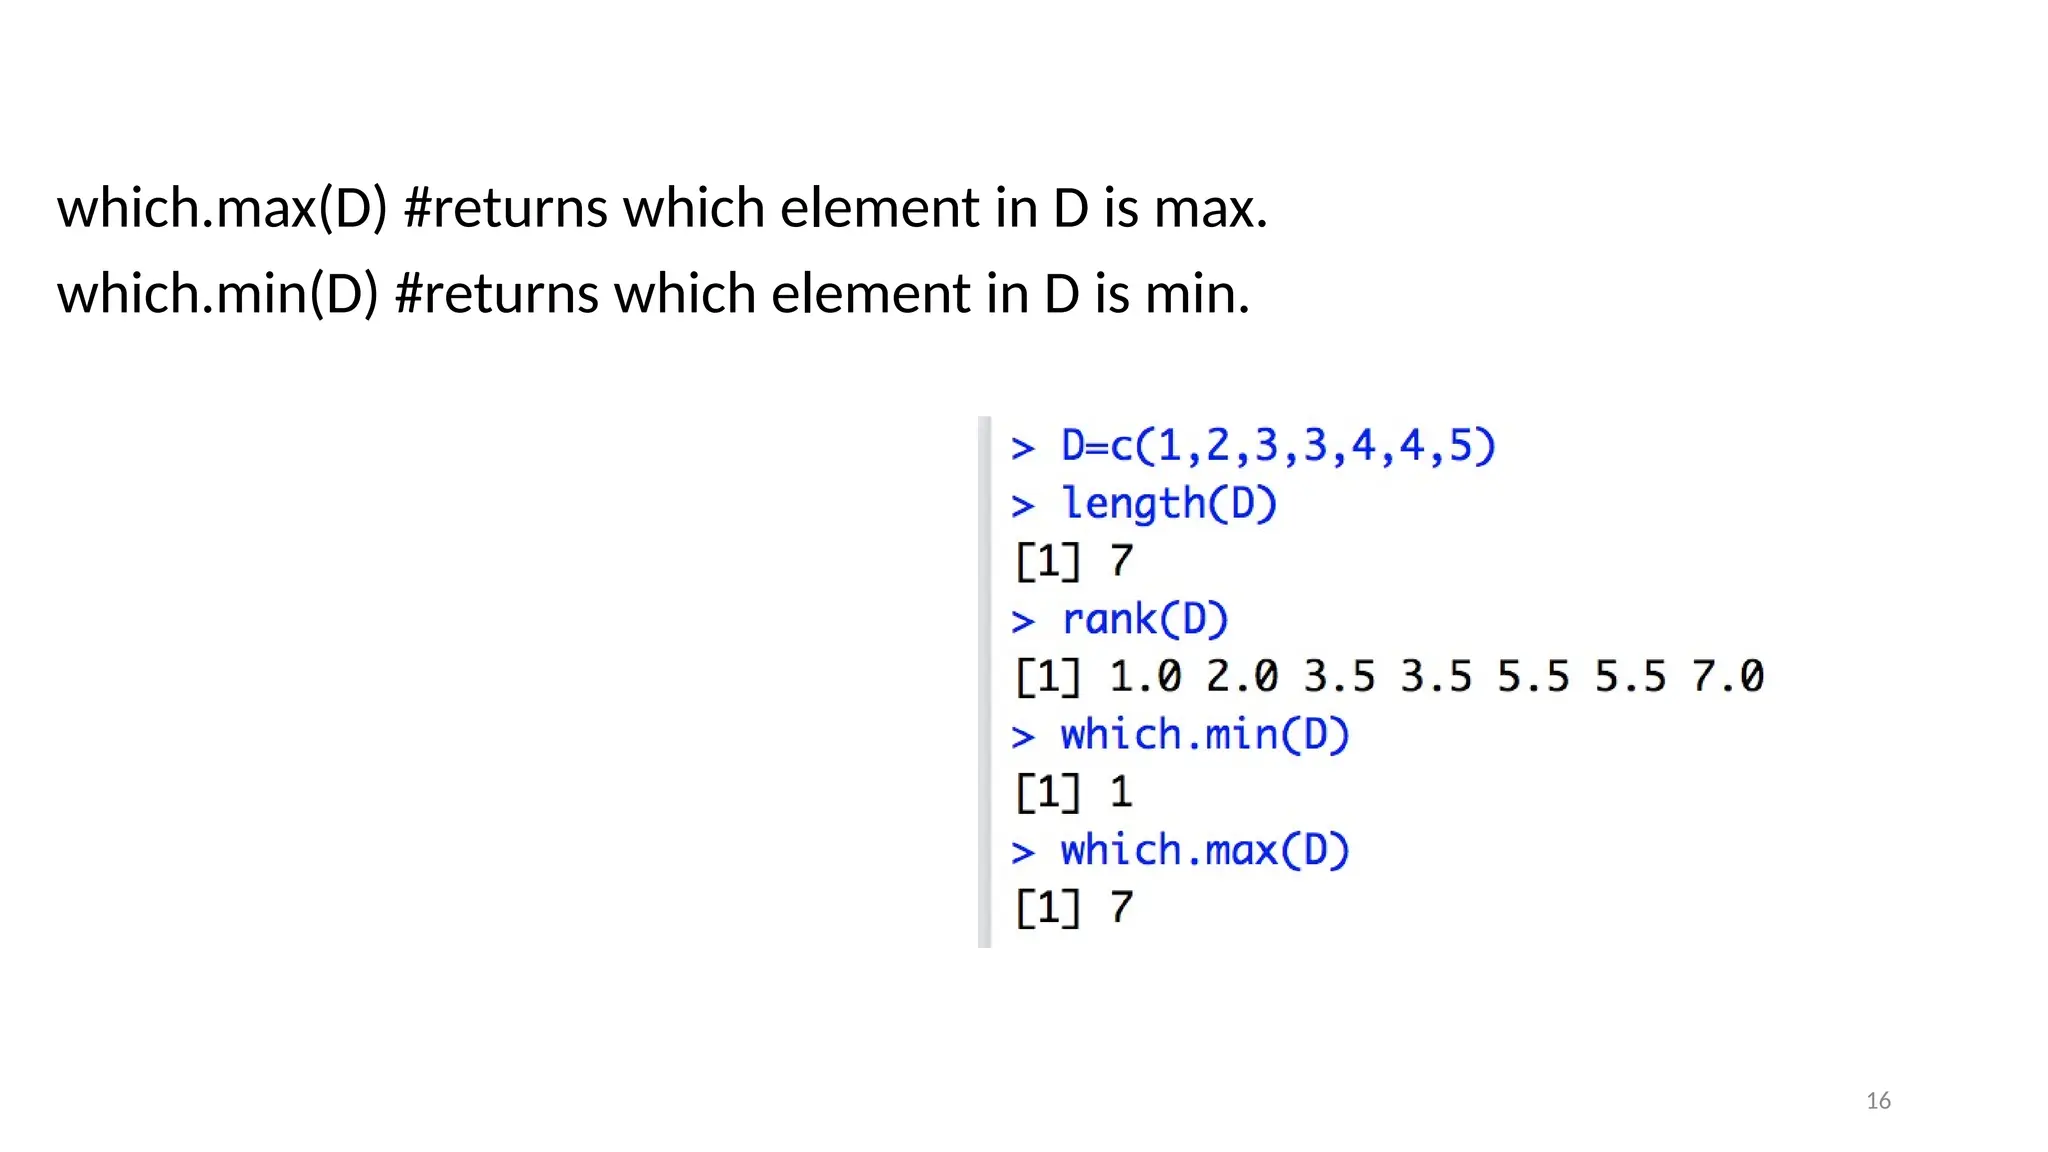
C=c(1,2,3,3,4,5)
length(C)
rank(C)
D=c(1,2,3,3,4,4,5); length(D); rank(D)
17
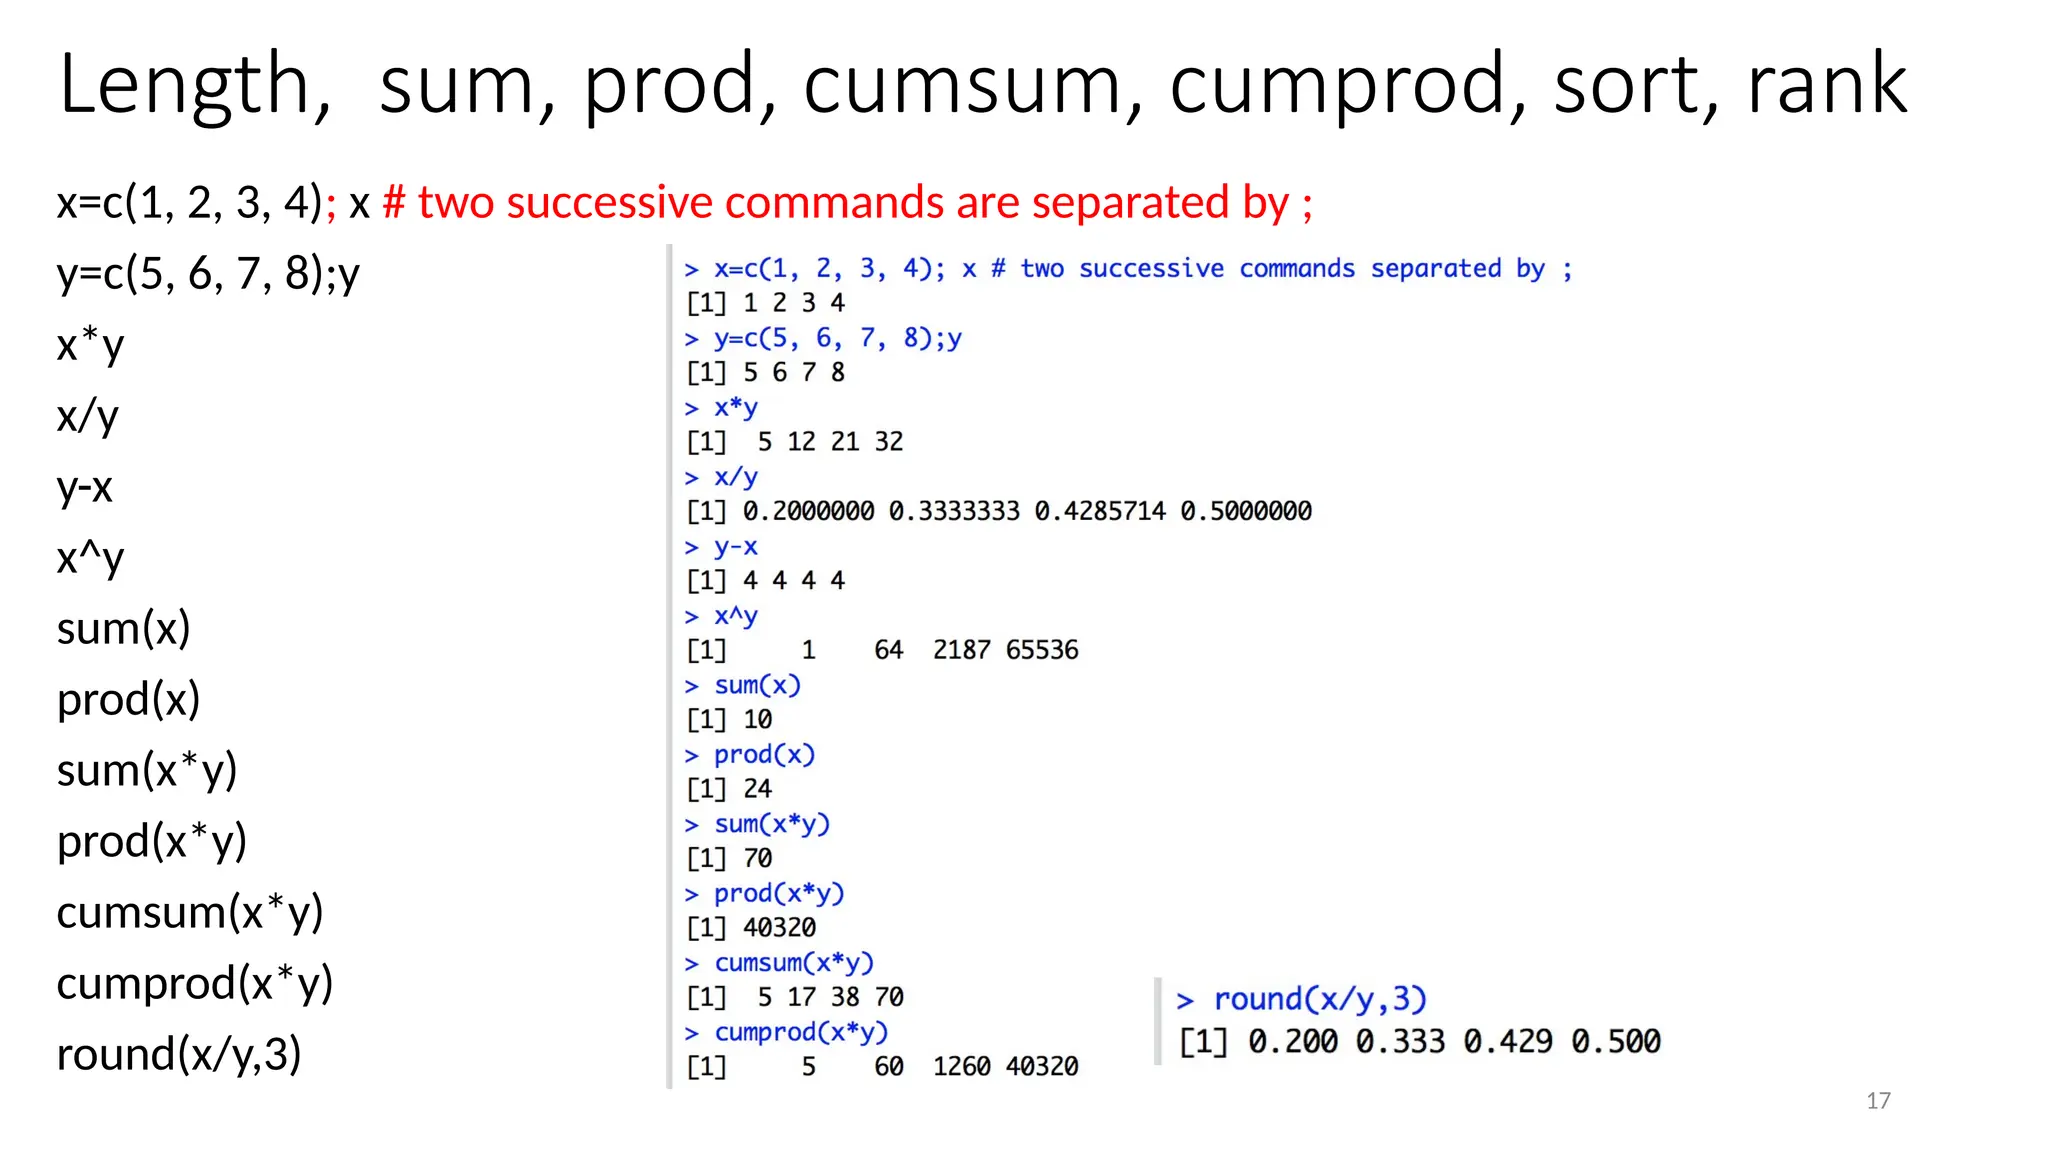
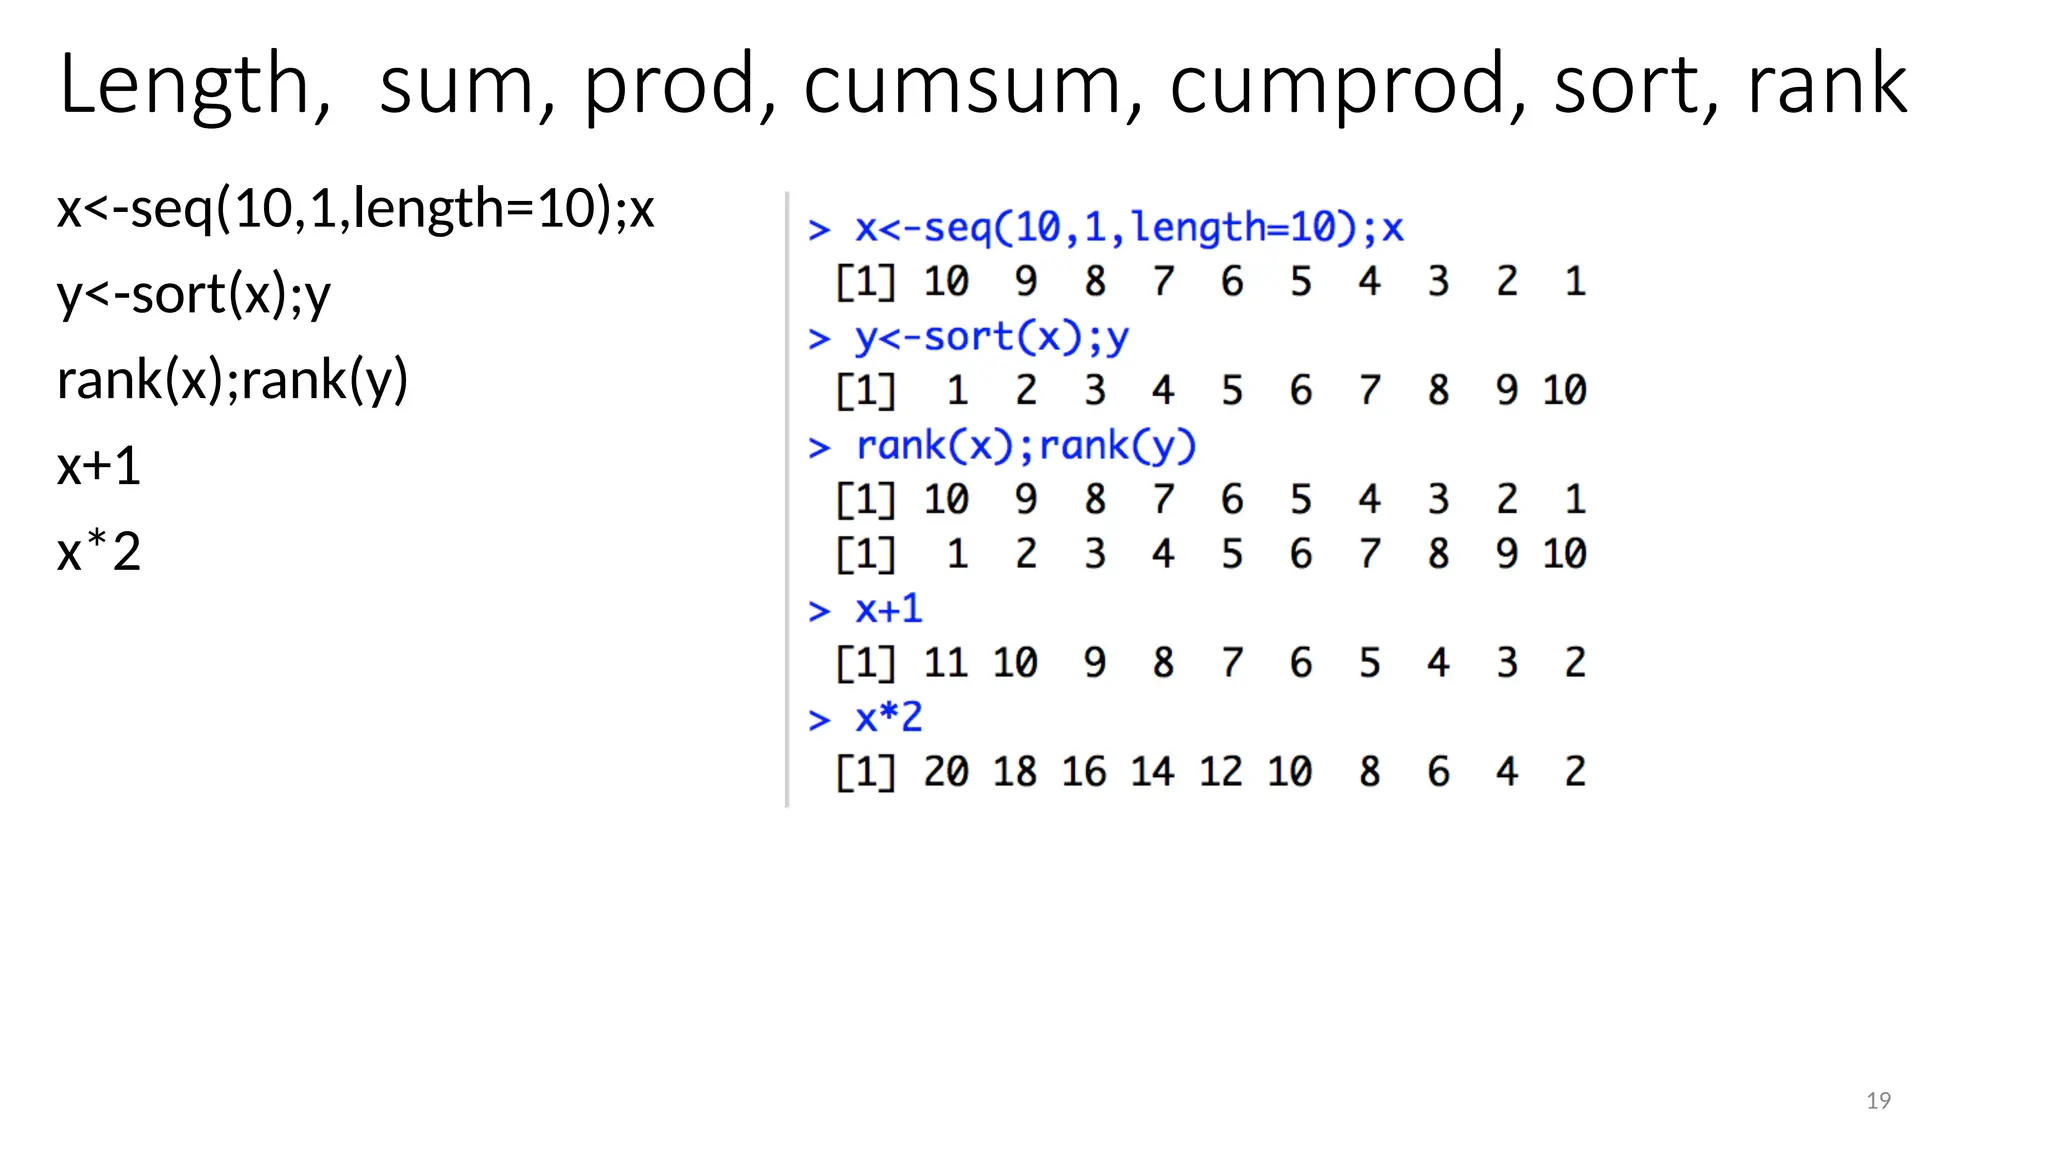
Length, sum, prod,cumsum, cumprod, sort, rank
x=c(1, 2, 3, 4); x # two successive commands are separated by ;
y=c(5, 6, 7, 8);y
x*y
x/y
y-x
x^y
sum(x)
prod(x)
sum(x*y)
prod(x*y)
cumsum(x*y)
cumprod(x*y)
round(x/y,3)
18.
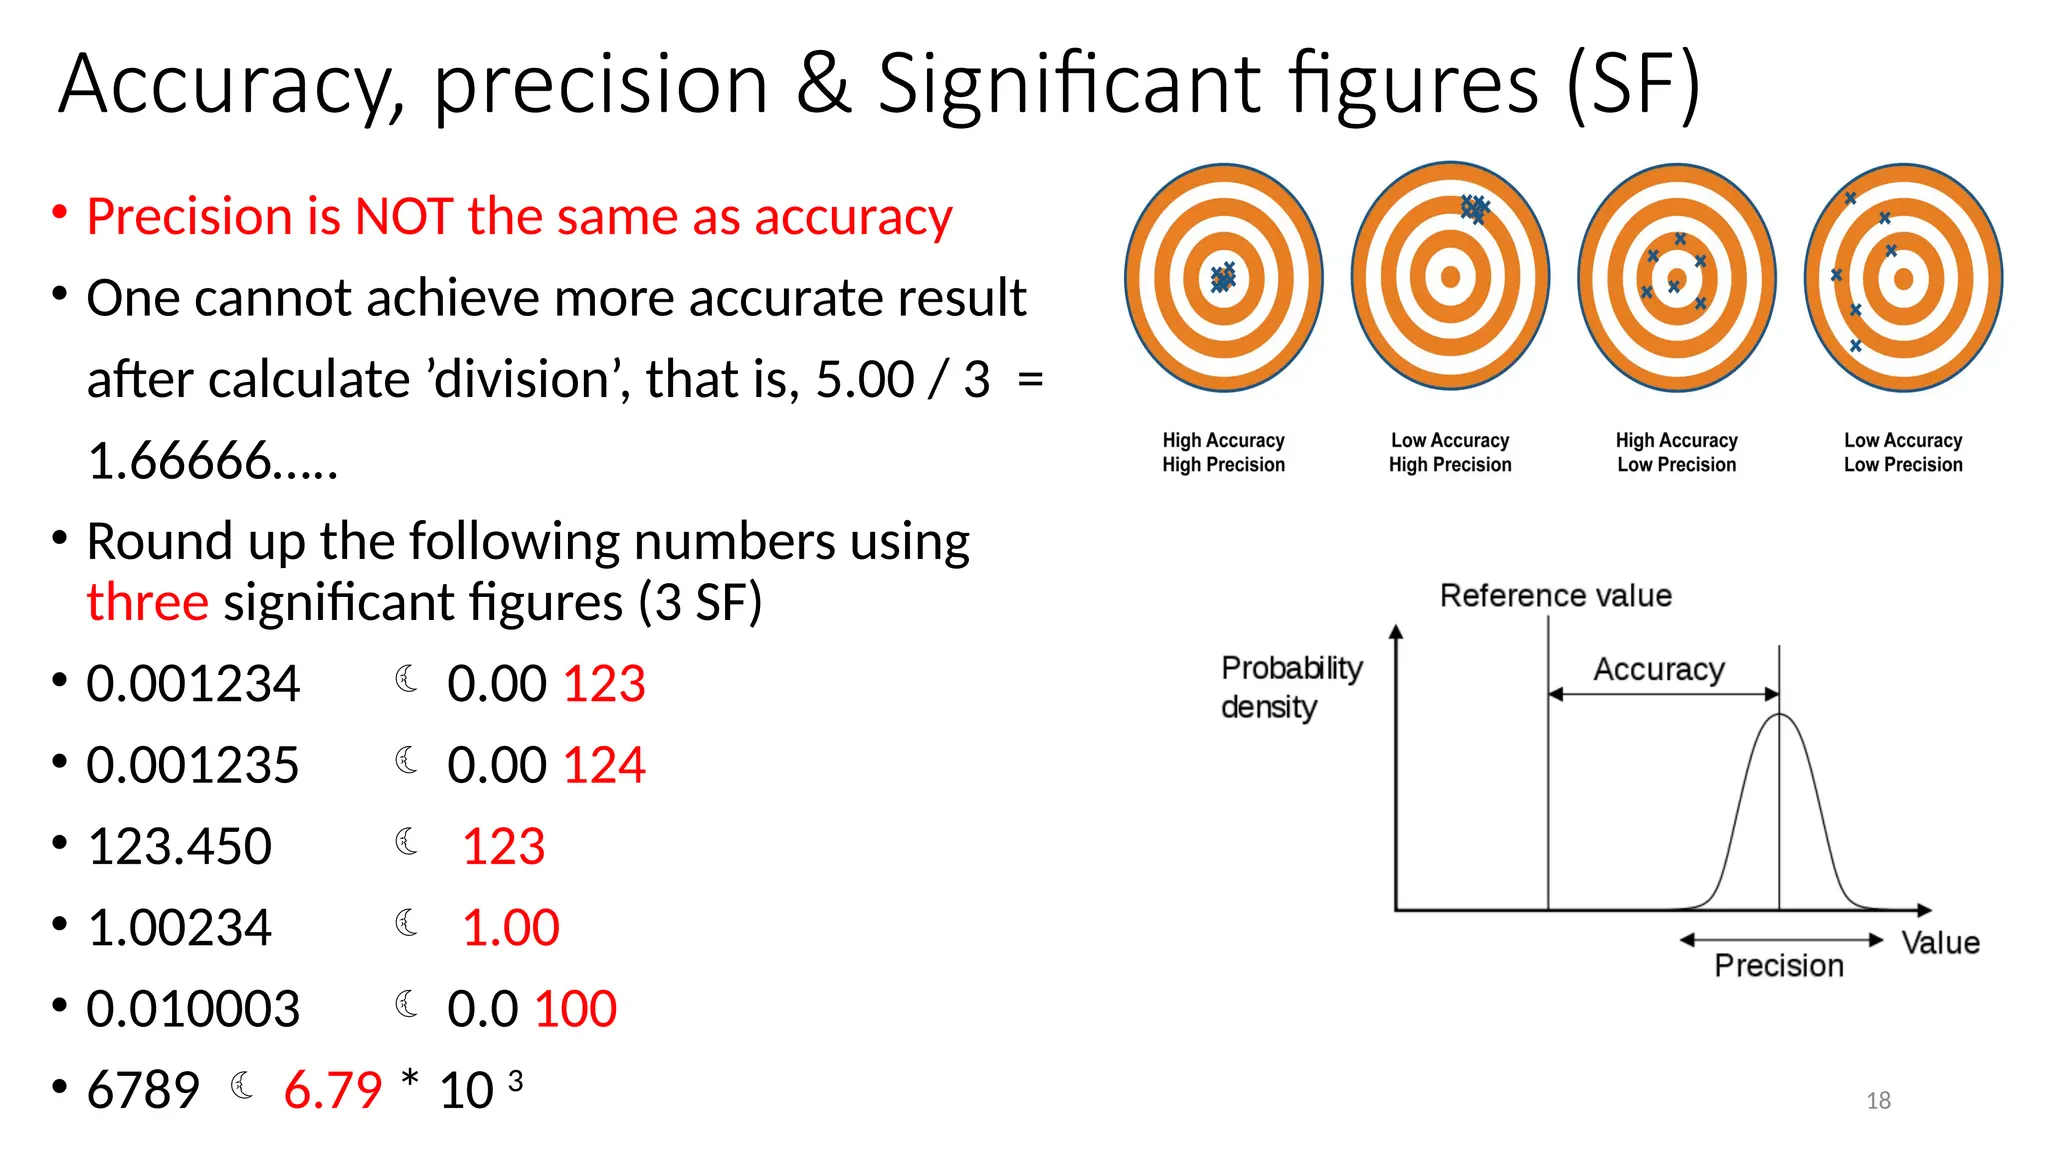
18
Accuracy, precision &Significant figures (SF)
• Precision is NOT the same as accuracy
• One cannot achieve more accurate result
after calculate ’division’, that is, 5.00 / 3 =
1.66666…..
• Round up the following numbers using
three significant figures (3 SF)
• 0.001234 0.00 123
• 0.001235 0.00 124
• 123.450 123
• 1.00234 1.00
• 0.010003 0.0 100
• 6789 6.79 * 10 3
21
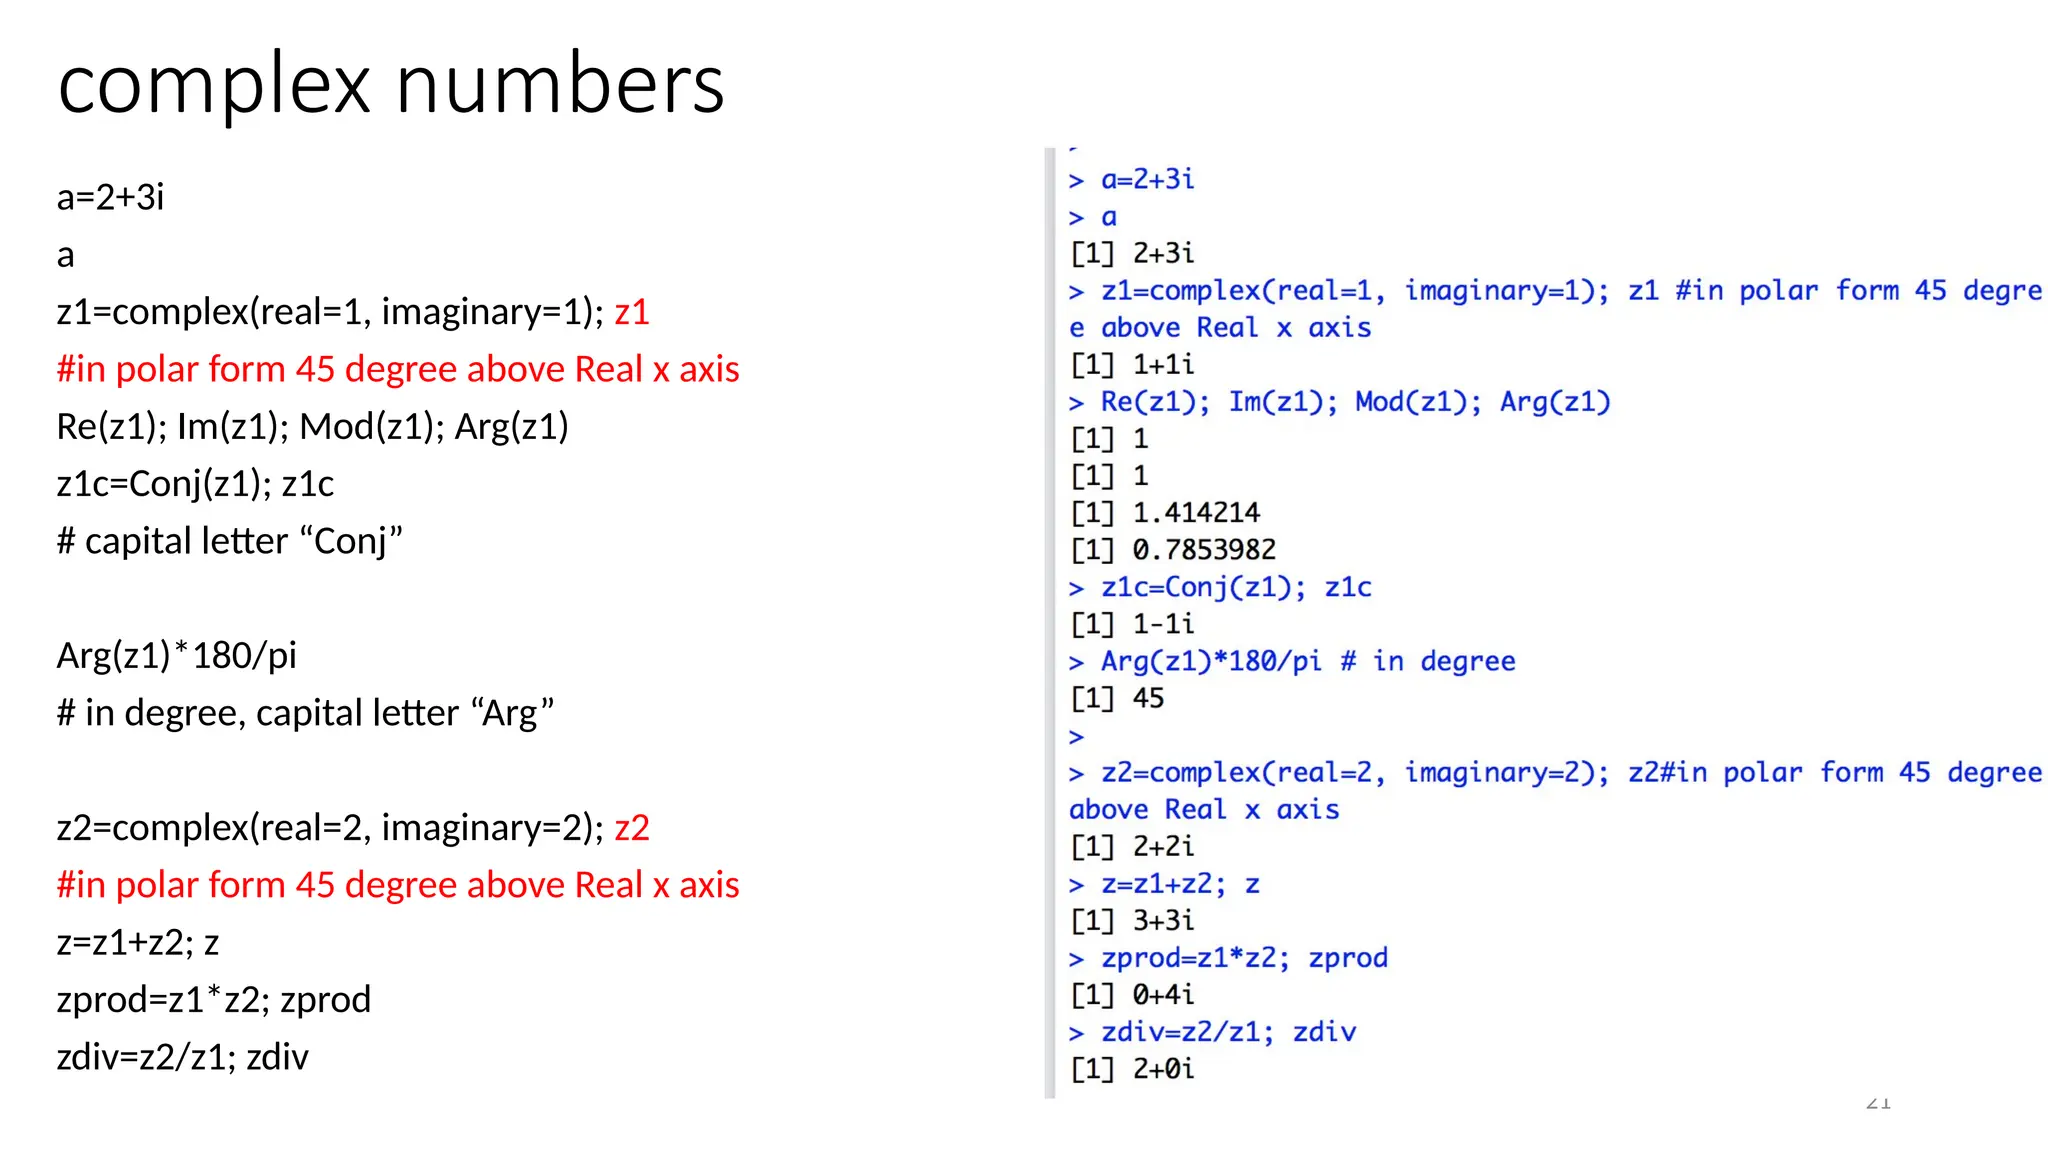
complex numbers
a=2+3i
a
z1=complex(real=1, imaginary=1);z1
#in polar form 45 degree above Real x axis
Re(z1); Im(z1); Mod(z1); Arg(z1)
z1c=Conj(z1); z1c
# capital letter “Conj”
Arg(z1)*180/pi
# in degree, capital letter “Arg”
z2=complex(real=2, imaginary=2); z2
#in polar form 45 degree above Real x axis
z=z1+z2; z
zprod=z1*z2; zprod
zdiv=z2/z1; zdiv
22.
22
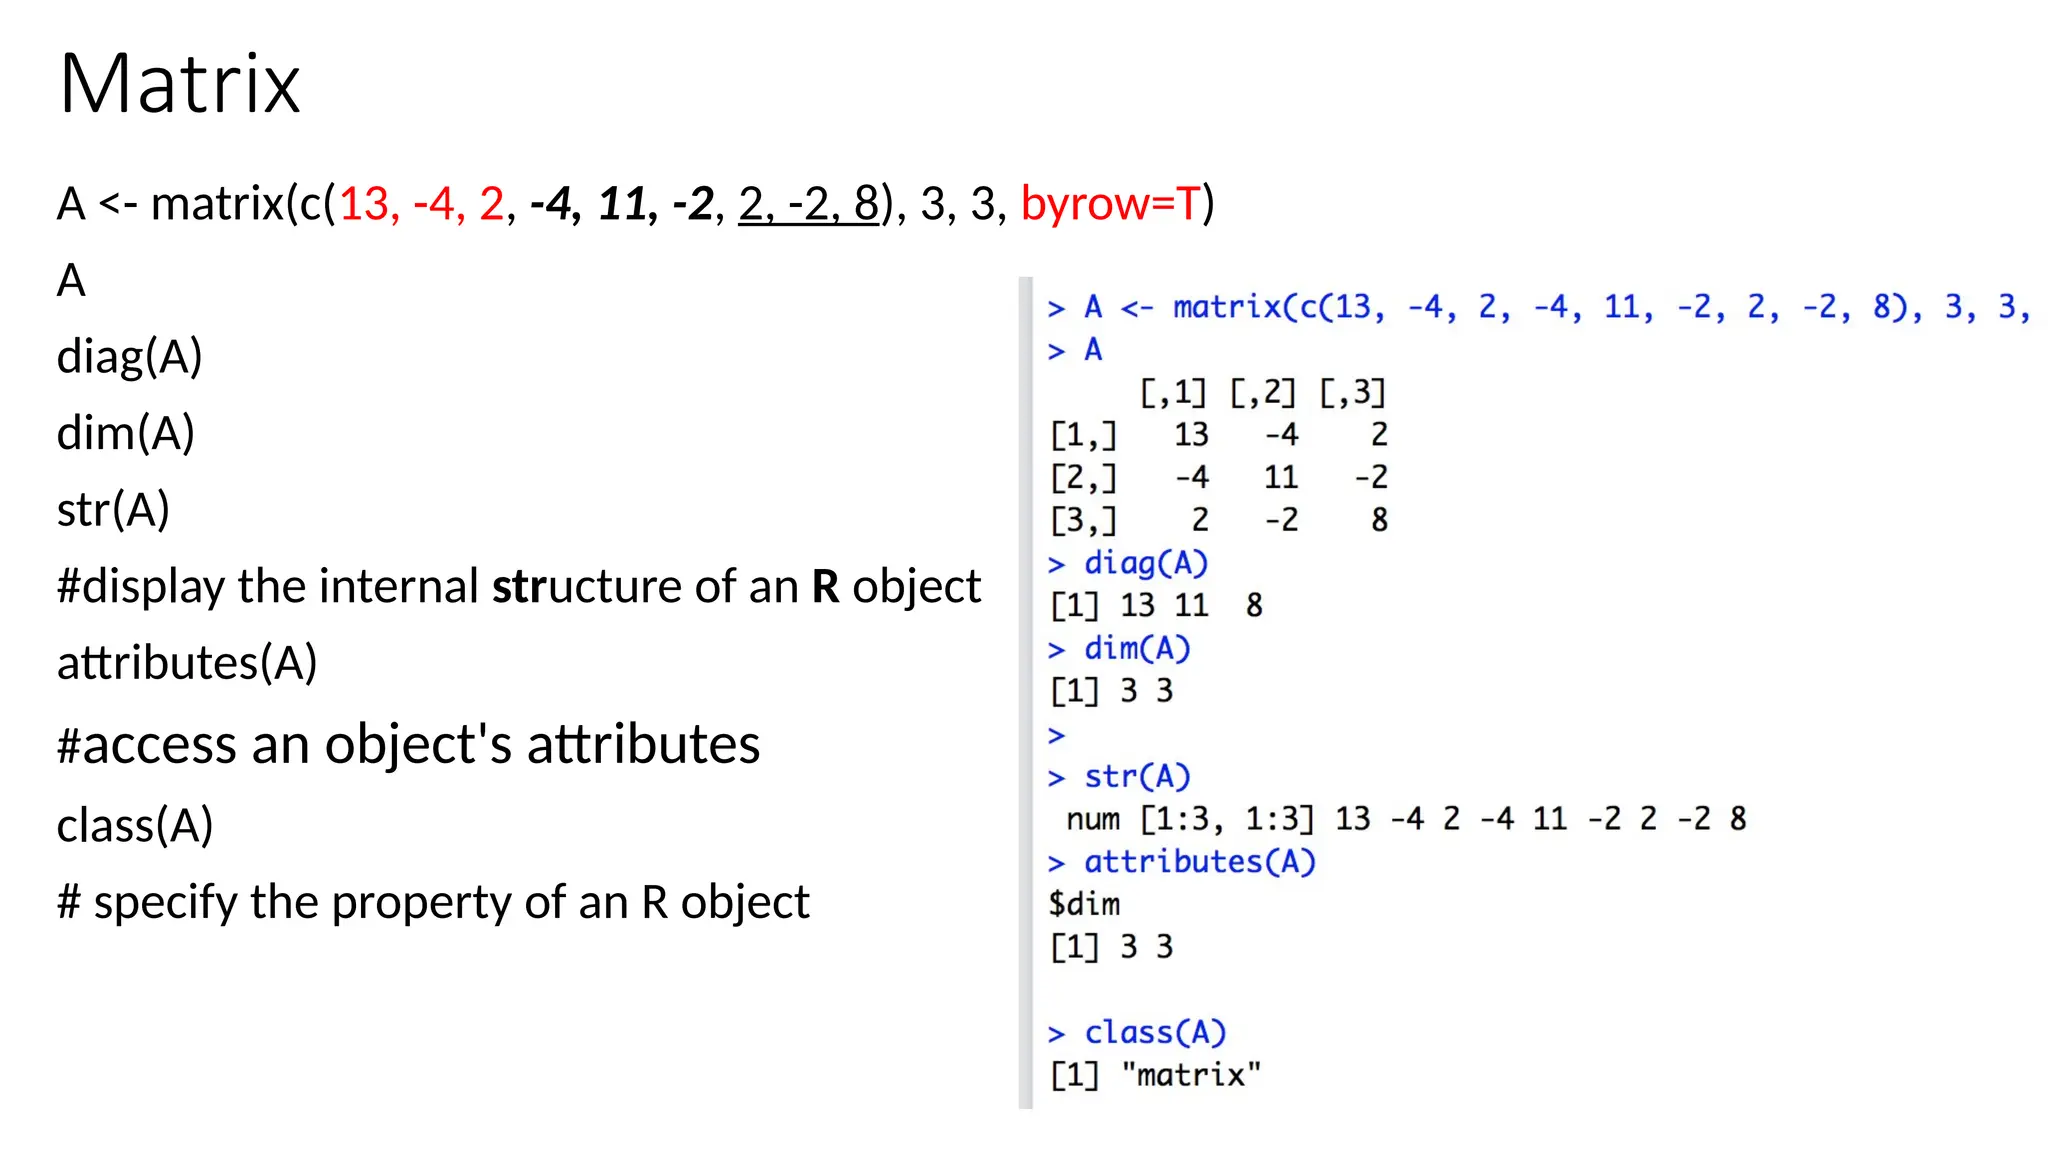
Matrix
A <- matrix(c(13,-4, 2, -4, 11, -2, 2, -2, 8), 3, 3, byrow=T)
A
diag(A)
dim(A)
str(A)
#display the internal structure of an R object
attributes(A)
#access an object's attributes
class(A)
# specify the property of an R object
23.
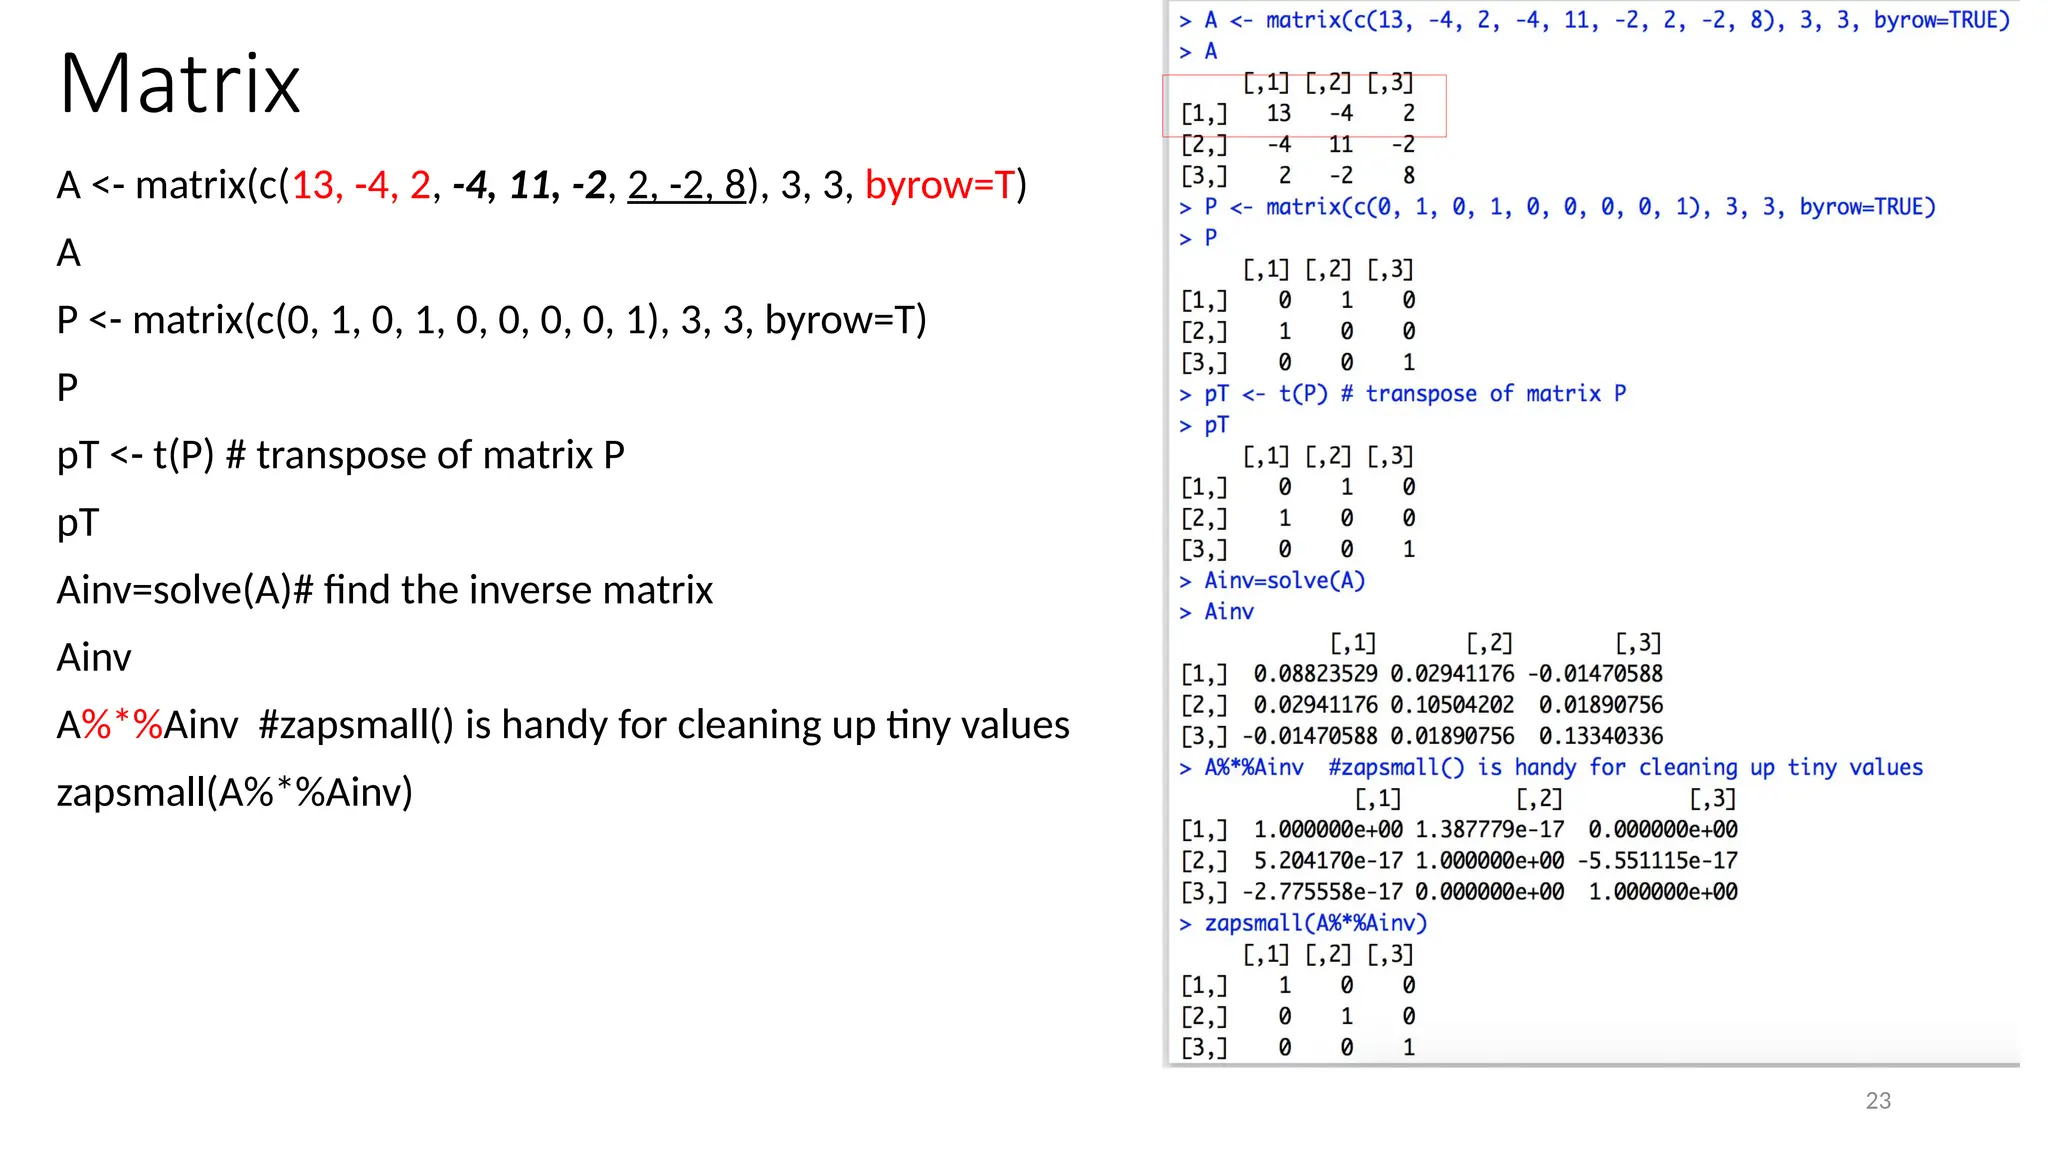
23
Matrix
A <- matrix(c(13,-4, 2, -4, 11, -2, 2, -2, 8), 3, 3, byrow=T)
A
P <- matrix(c(0, 1, 0, 1, 0, 0, 0, 0, 1), 3, 3, byrow=T)
P
pT <- t(P) # transpose of matrix P
pT
Ainv=solve(A)# find the inverse matrix
Ainv
A%*%Ainv #zapsmall() is handy for cleaning up tiny values
zapsmall(A%*%Ainv)
25
Matrix – eigenvaluesand eigenvectors
A <- matrix(c(13, -4, 2, -4, 11, -2, 2, -2, 8), 3, 3, byrow=T)
det(A)
# Eigenvalues and eigenvectors – Wikipedia # geometric meaning
#Ax = l x, given a 3x3 matrix A [3 eigenvalues and 3 eigenvectors ]
#Ax1 = l1 x1, Ax2 = l2 x2 , Ax3 = l3 x3
#[Ax2 = 8 x2 ]
Z=eigen(A); Z$values[2] # the second eigenvalue
Z$vectors[,2] # the second eigenvector
#an eigenvector of a shear mapping does not change direction, and since its length is unchanged, its
eigenvalue is 1.
26.
26
Matrix
Remark:
[1] matrix multiplicationis not commute, AB not equal to BA
[2] zapsmall(A*Ainv) # the symbol ‘*’ DOES NOT mean matrix
multiplication !!
More on matrix algebra in R, read
https://www.statmethods.net/advstats/matrix.html
27.
27
Multiplication of matrixand vector
Let A [nrow=3, ncol=2] and x [nrow=2, ncol=1]
denote a matrix and a vector respectively.
Need to form Ax [Ax2 = 8 x2 ]
A=matrix(1:6,3,2,byrow=T); A;
dim(A) # A is a matrix with nrow=3, ncol=2
x=c(7,8);x;
dim(x); length(x)
#x is a column vector, that is nrow=2, ncol=1
#‘dim’ command apply for matrix but not for c(7,8),
#one has to use ‘length’
A%*%x
#define a column vector using ‘matrix’
x=matrix(c(7,8),byrow=T); x
dim(x); length(x)
28.
28
Multiplication of matrixand vector
In-class exercise
Verify the eigenvalue equation, Ax = l x
# Ax2 = l2 x2
A <- matrix(c(13, -4, 2, -4, 11, -2, 2, -2, 8), 3, 3, byrow=T)
Z=eigen(A)
Z$values[2] # the second eigenvalue
Z$vectors[,2] # the second eigenvector
A%*%Z$vectors[,2]
#To verify correctness of the result, use R to
#determine if the following give a ZERO vector [Ax2 - 8 x2 =0]
A%*%Z$vectors[,2]- Z$values[2]*Z$vectors[,2]
zapsmall(A%*%Z$vectors[,2]- Z$values[2]*Z$vectors[,2])
round((A%*%Z$vectors[,2]- Z$values[2]*Z$vectors[,2]),7)
29.
29
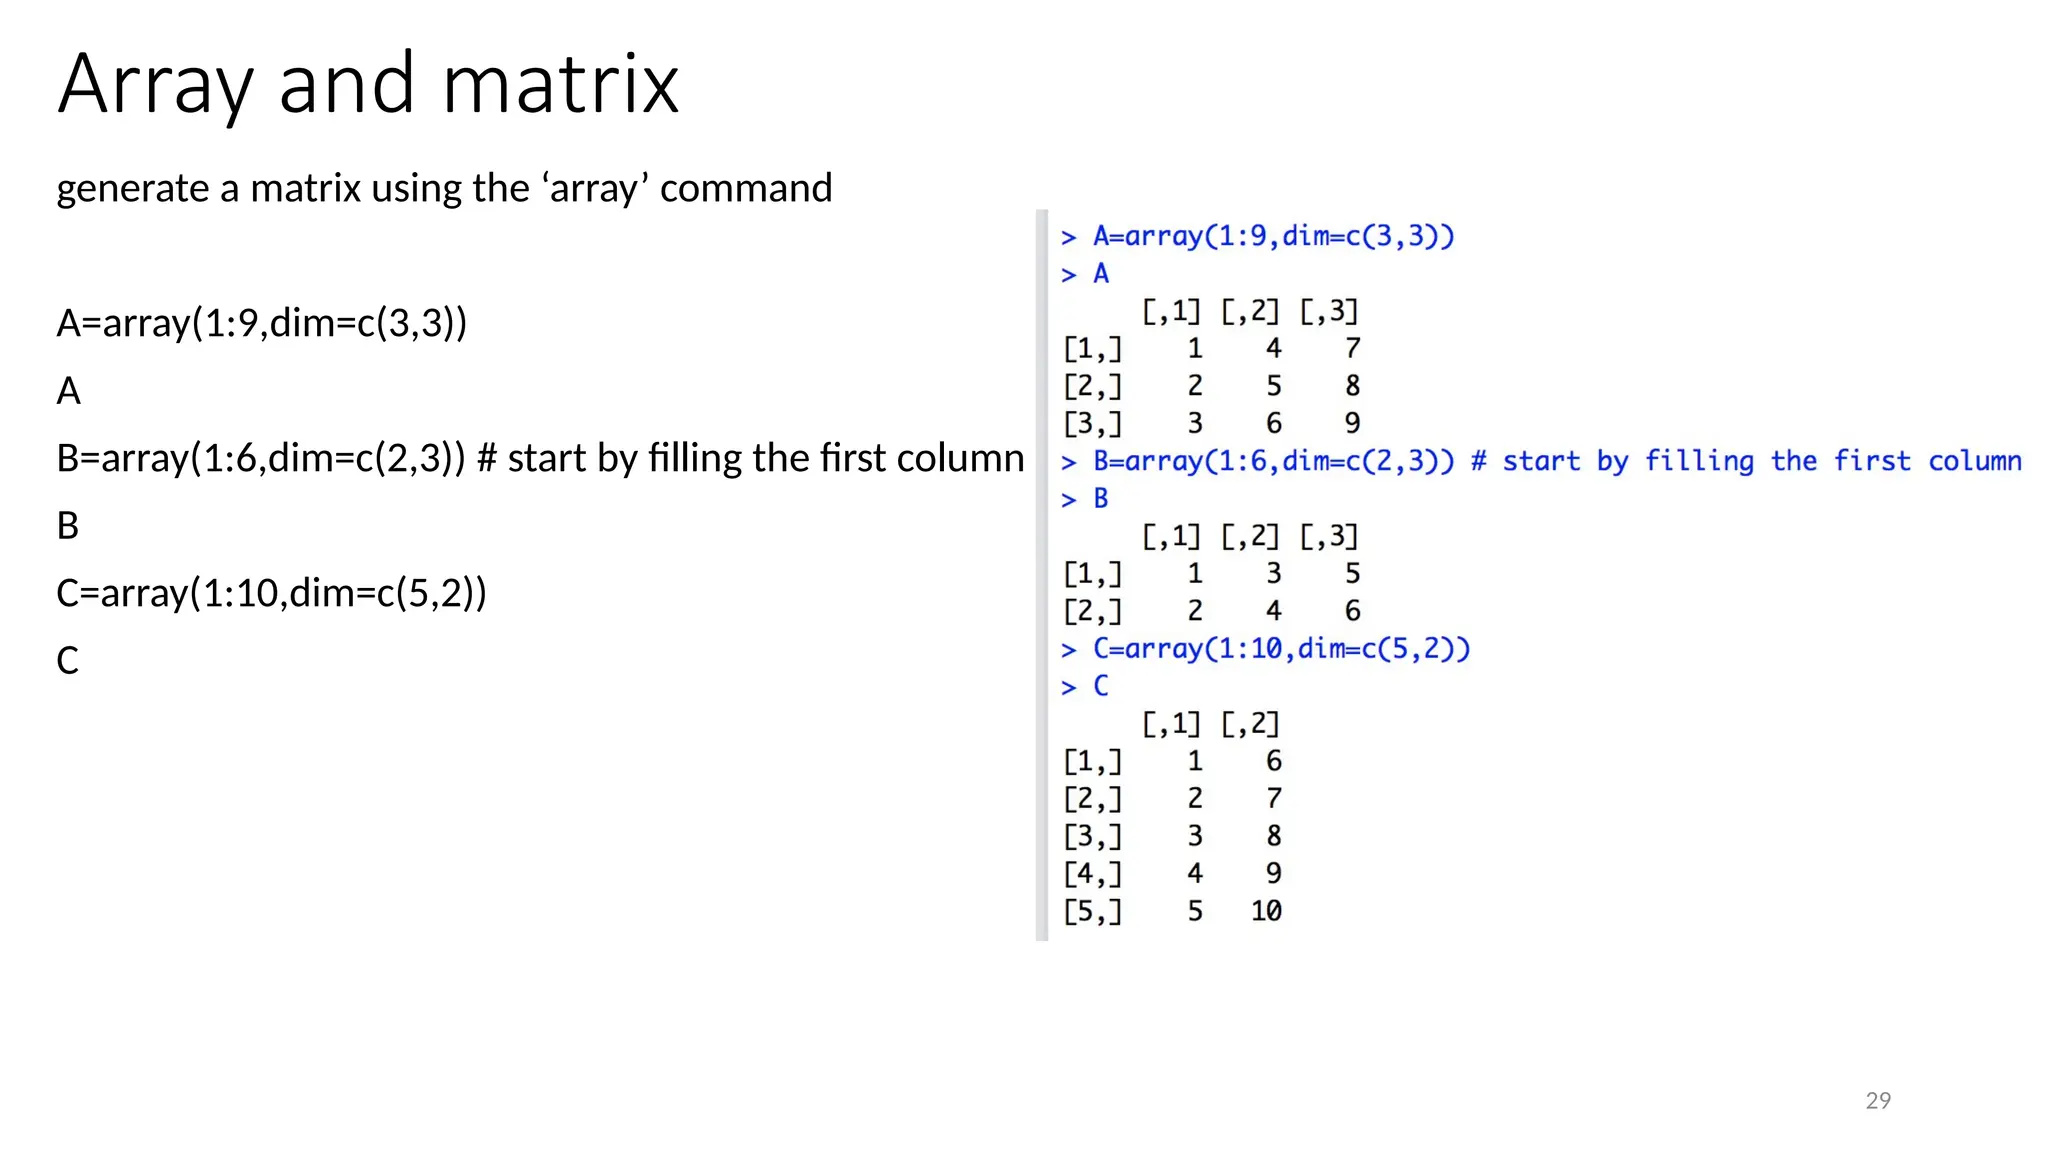
Array and matrix
generatea matrix using the ‘array’ command
A=array(1:9,dim=c(3,3))
A
B=array(1:6,dim=c(2,3)) # start by filling the first column
B
C=array(1:10,dim=c(5,2))
C
30.
30
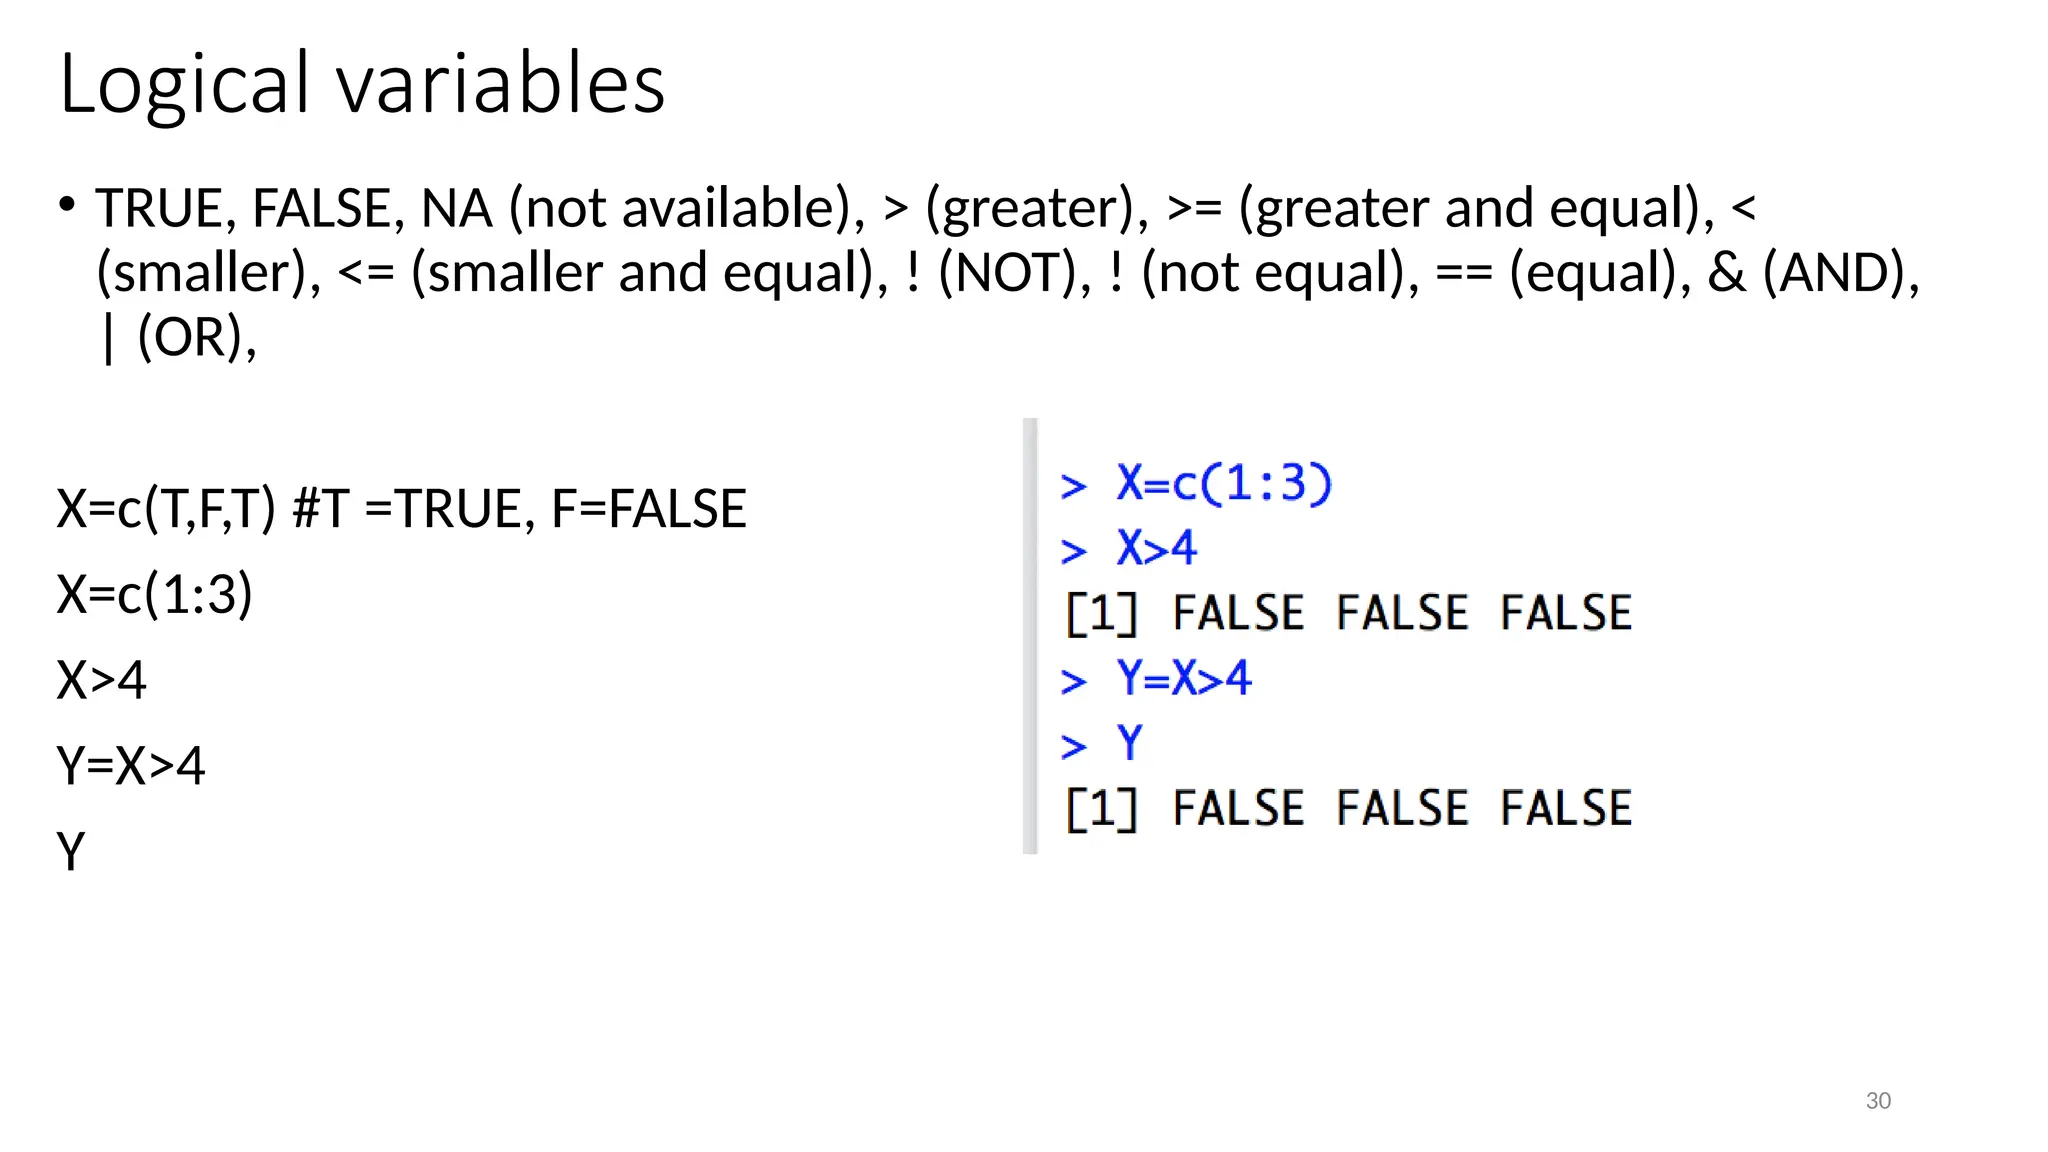
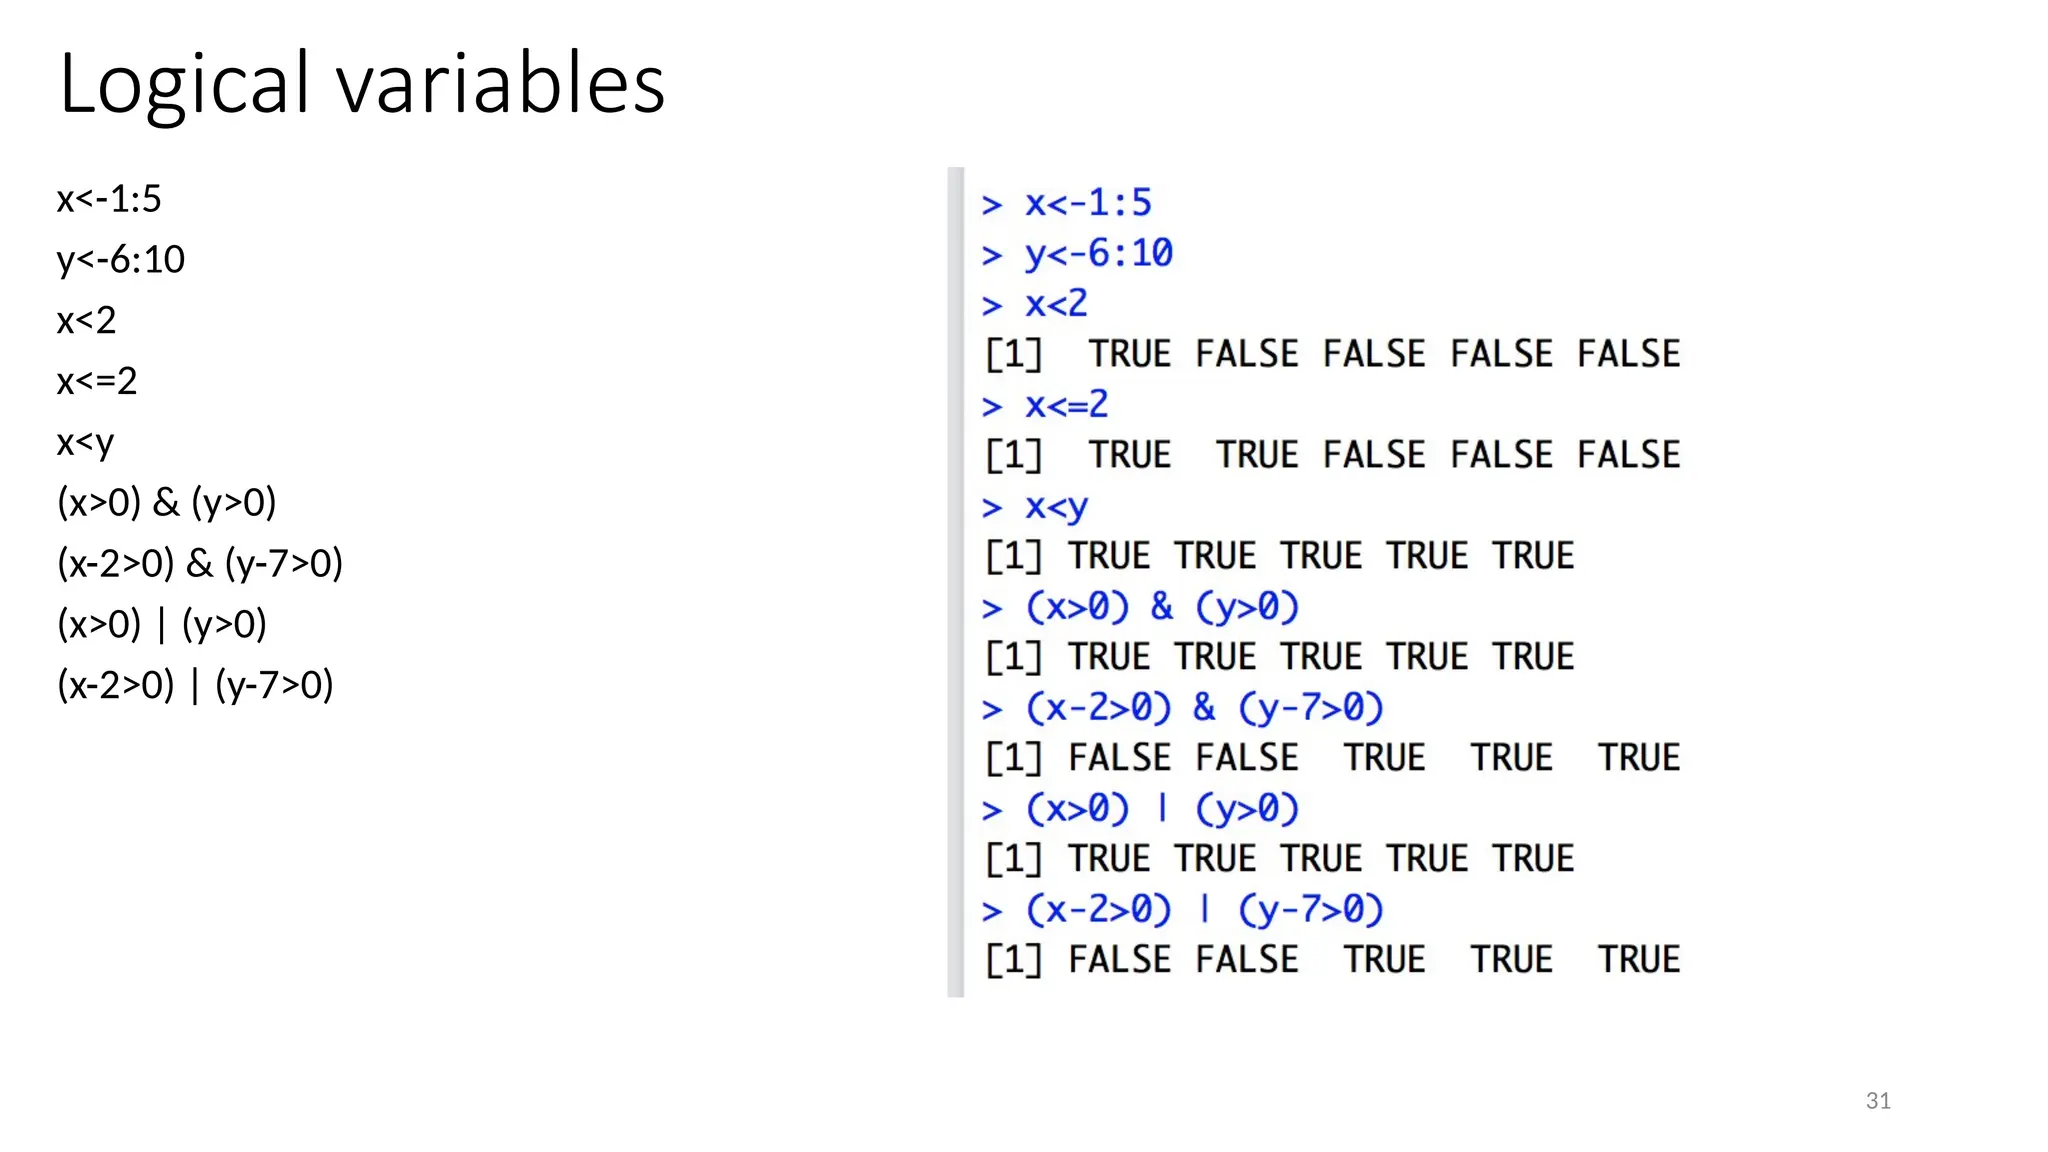
Logical variables
• TRUE,FALSE, NA (not available), > (greater), >= (greater and equal), <
(smaller), <= (smaller and equal), ! (NOT), ! (not equal), == (equal), & (AND),
| (OR),
X=c(T,F,T) #T =TRUE, F=FALSE
X=c(1:3)
X>4
Y=X>4
Y
32
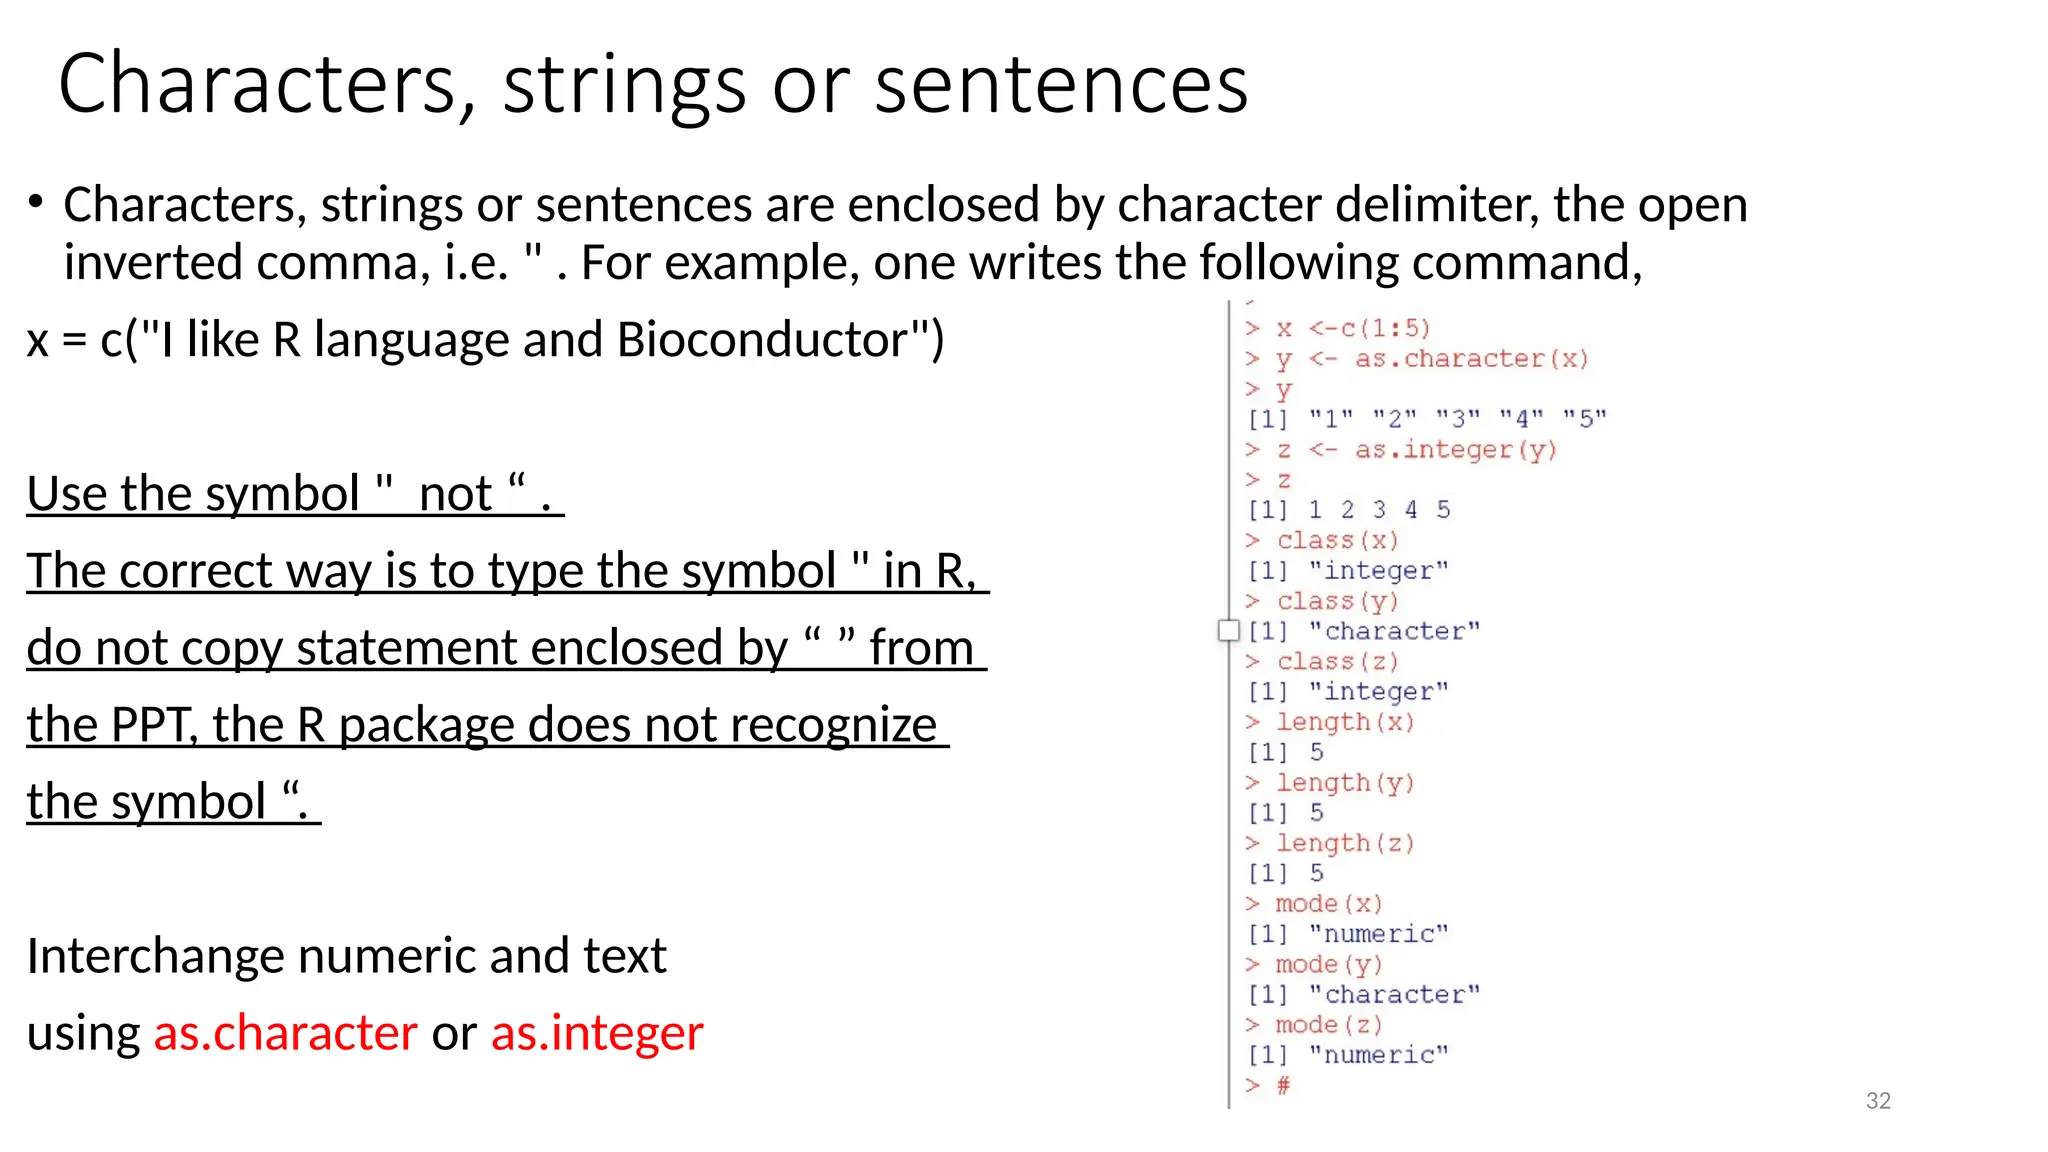
Characters, strings orsentences
• Characters, strings or sentences are enclosed by character delimiter, the open
inverted comma, i.e. " . For example, one writes the following command,
x = c("I like R language and Bioconductor")
Use the symbol " not “ .
The correct way is to type the symbol " in R,
do not copy statement enclosed by “ ” from
the PPT, the R package does not recognize
the symbol “.
Interchange numeric and text
using as.character or as.integer
33.
33
Objects – character,array, data.frame
letter=c("a","b","c","d")
y<-matrix(letter,2,2)
y
y<-matrix(letter,2,2,byrow=T)
y
z=c(T,F,T,F)
z
# character > complex > numeric > logical , any array consists of character, every element are treated as
character
x<-c("help", 3+6i, 5.42, FALSE) # coerce [force] to character
x
y<-c(3+6i, 5.42, FALSE) # coerce to complex
y
z<-c(5.42, FALSE) # coerce to numerical
z
35
Basic descriptive statistics
•With R package, you can compute mean, median, sum, standard deviation,
variance, range, quantile and interquartile range (IQR) for a vector y using the
R commands; i.e. mean(y), median(y), sum(y), sd(y), var(y), range(y), min(y),
max(y), quantile(y) and IQR(y).
36.
36
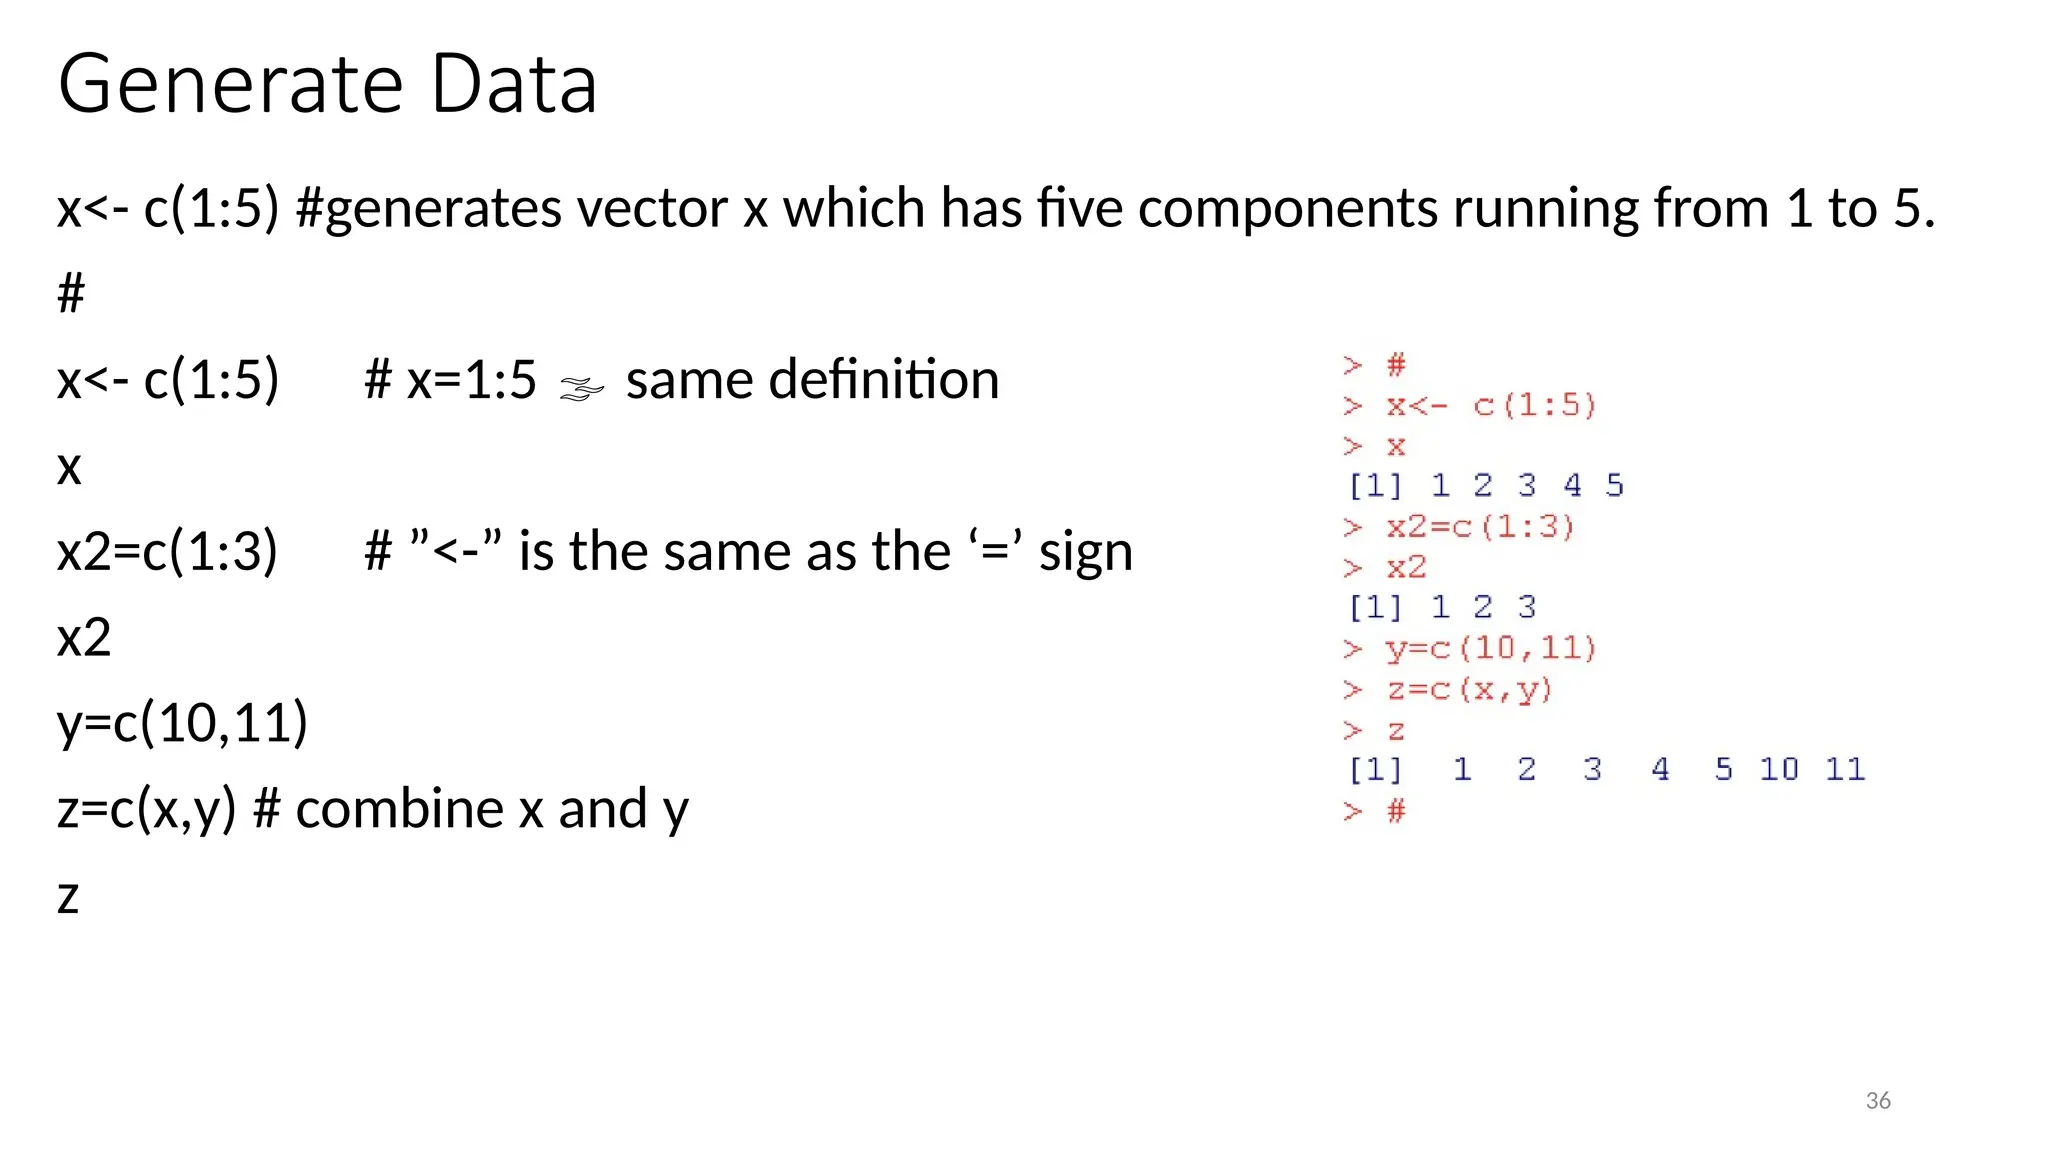
Generate Data
x<- c(1:5)#generates vector x which has five components running from 1 to 5.
#
x<- c(1:5) # x=1:5 same definition
x
x2=c(1:3) # ”<-” is the same as the ‘=’ sign
x2
y=c(10,11)
z=c(x,y) # combine x and y
z
37.
37
random number generator
n=3
x<-runif(n,0,100)# generate three random numbers between 0 and 100
x
y=sort(as.integer(x)) #take the integer part [same as floor] and sorting the data in ascending order
y
mean(y)
median(y)
sum(y)
sd(y) #standard deviation
var(y) #var = (sd)^2
range(y)
quantile(y)
IQR(y)
summary(y)
#list of the summary statistics for dataset y
38.
38
interquartile range (IQR),decile
• interquartile range (IQR) computes interquartile range of the x values. IQR is defined by
• IQR = upper quantile – lower quantile
• where upper quantile and lower quantile denote the 75% and 25% data.
• To determine the percentile position p, given the qth percentile, it is given by
• p = 1 + q(n-1)
• Consider q=0% p=1, q=100%=1 p=n
• here p, q and n denote the position, percentage, and total number of entries.
• data locate within the intervals, (i) upper quantile + (1.5 ~ 3.0)*IQR, or (ii) lower quantile - (1.5 ~ 3.0)*IQR, are possible
outliers. Data locate outside (i) quantile +3.0*IQR, or (ii) lower quantile - 3.0*IQR are absolutely outliers.
• Example 1 Let x={11, 13, 15, 17, 19}, then
• 25% position = 1 + 0.25*(5-1) = 2nd
position 13
• 50% position = 1 + 0.50*(5-1) = 3rd
position 15 (median)
quantile(x, prob = seq(0, 1, length = 11)) # decile
• Example 2 Let x={11, 13, 15, 17, 19, 21}, then
• 25% position = 1 + 0.25*(6-1) = 2.25 position , decimal place 13 + (15-13)*.25 = 13.5 [by proportion]
• 50% position = 1 + 0.50*(6-1) = 3.5 15 + (17-15)*0.5 = 16
• 60% position = 1 + 0.60*(6-1) = 4th position 17
• 60% position also called 6th
decile [ sounds like decimal and percentile together), as they split the data into 10% groups]
39.
39
Two datasets, runif=random uniform
# n= ?
n=6 #sort in ascending order , as.integer take the integer part
A=sort(as.integer(runif(n,0,100)))# generate 6 random numbers between 0 and 100
A
B=sort(sample(0:100,n,replace=T))
B # sample generates integers
C=cbind(A,B)
# cbind, rbind - take a sequence of vector, matrix or
#data-frame arguments and combine by columns or rows,
#respectively.
rownames(C)=c(1:6)
C
summary(C)
summary(C[,1]) #summary of dataset a
summary(C[,2]) #summary of dataset b
sd(C[,"A"]) # var of dataset a
40.
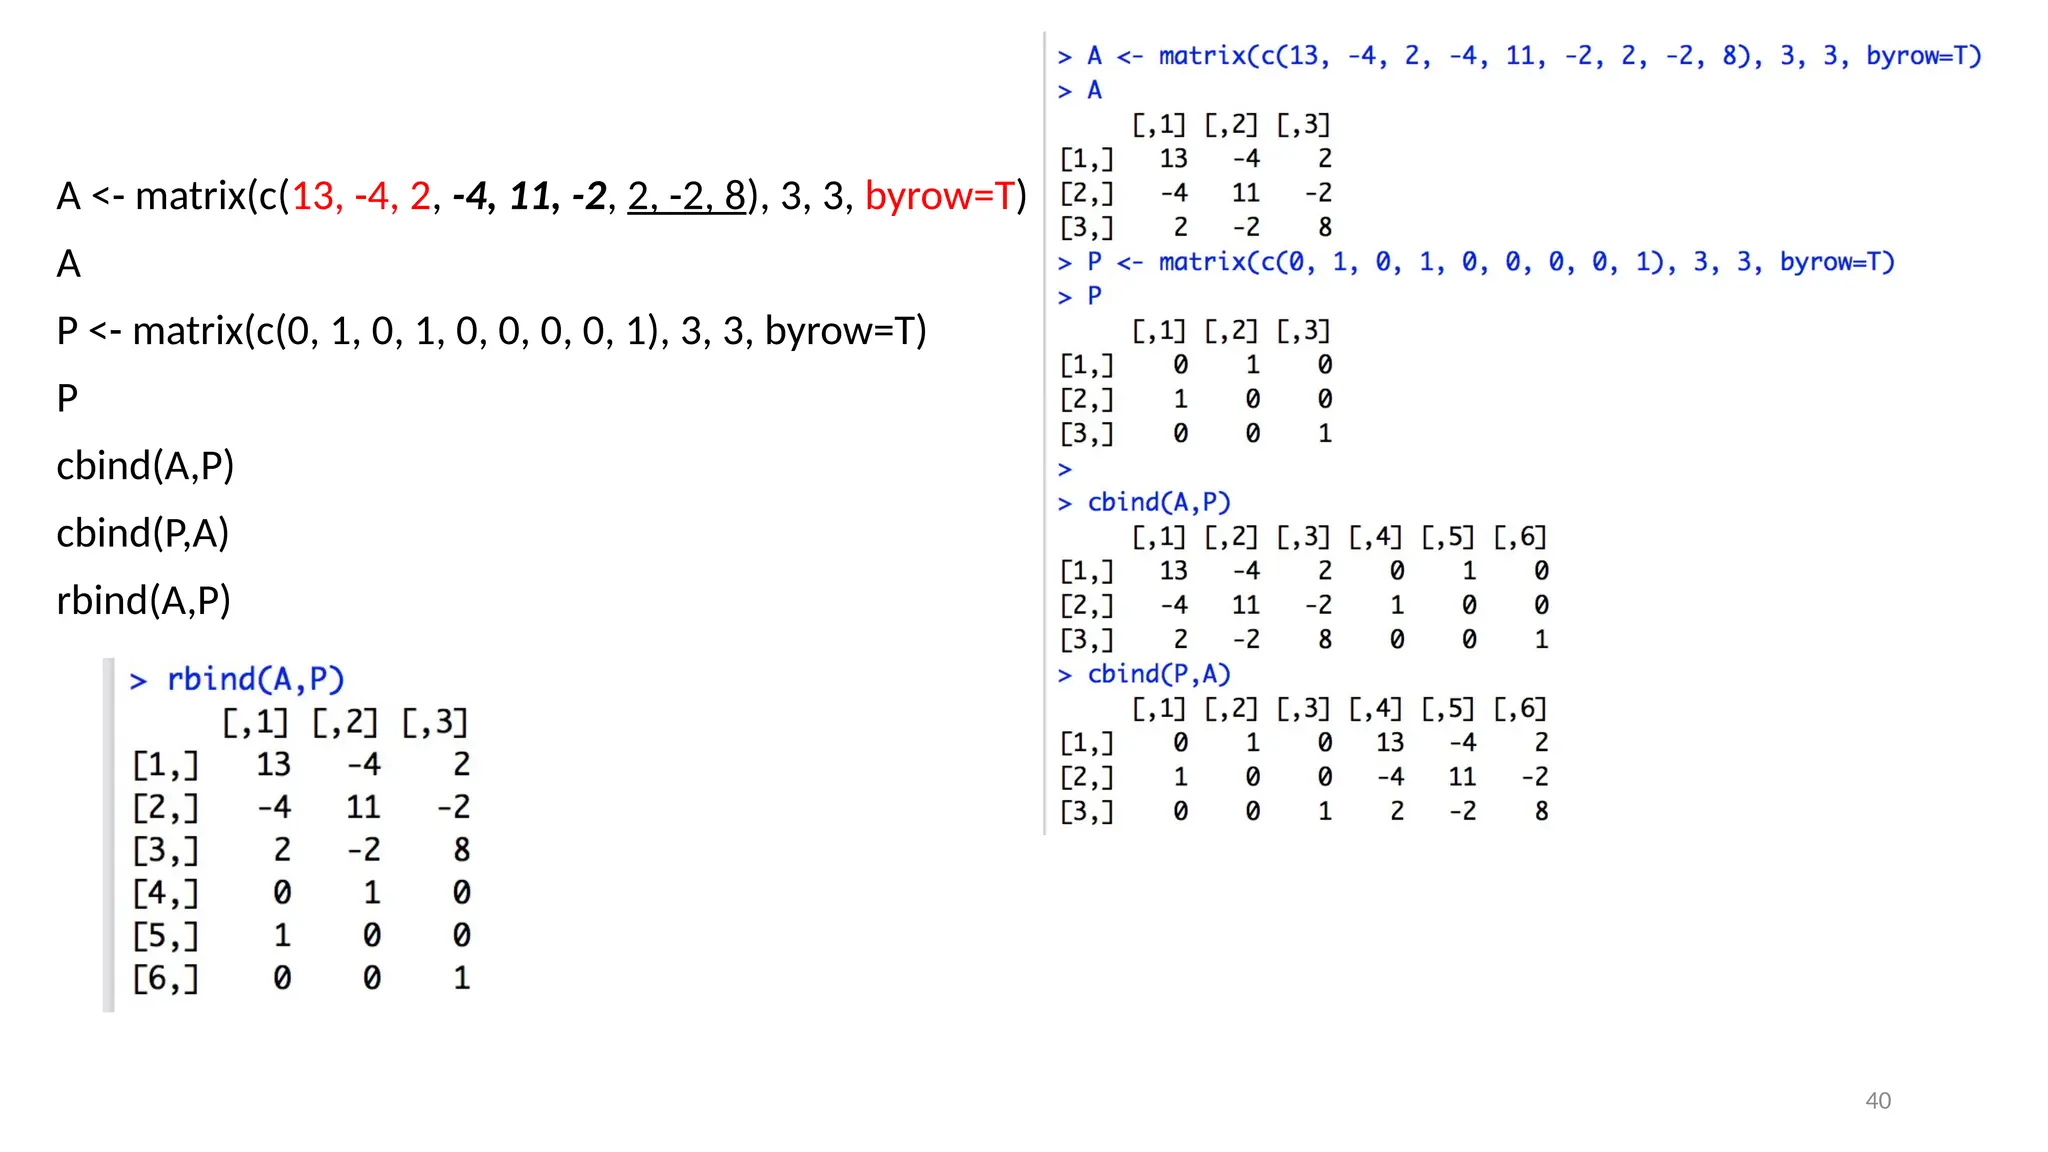
40
A <- matrix(c(13,-4, 2, -4, 11, -2, 2, -2, 8), 3, 3, byrow=T)
A
P <- matrix(c(0, 1, 0, 1, 0, 0, 0, 0, 1), 3, 3, byrow=T)
P
cbind(A,P)
cbind(P,A)
rbind(A,P)
41.
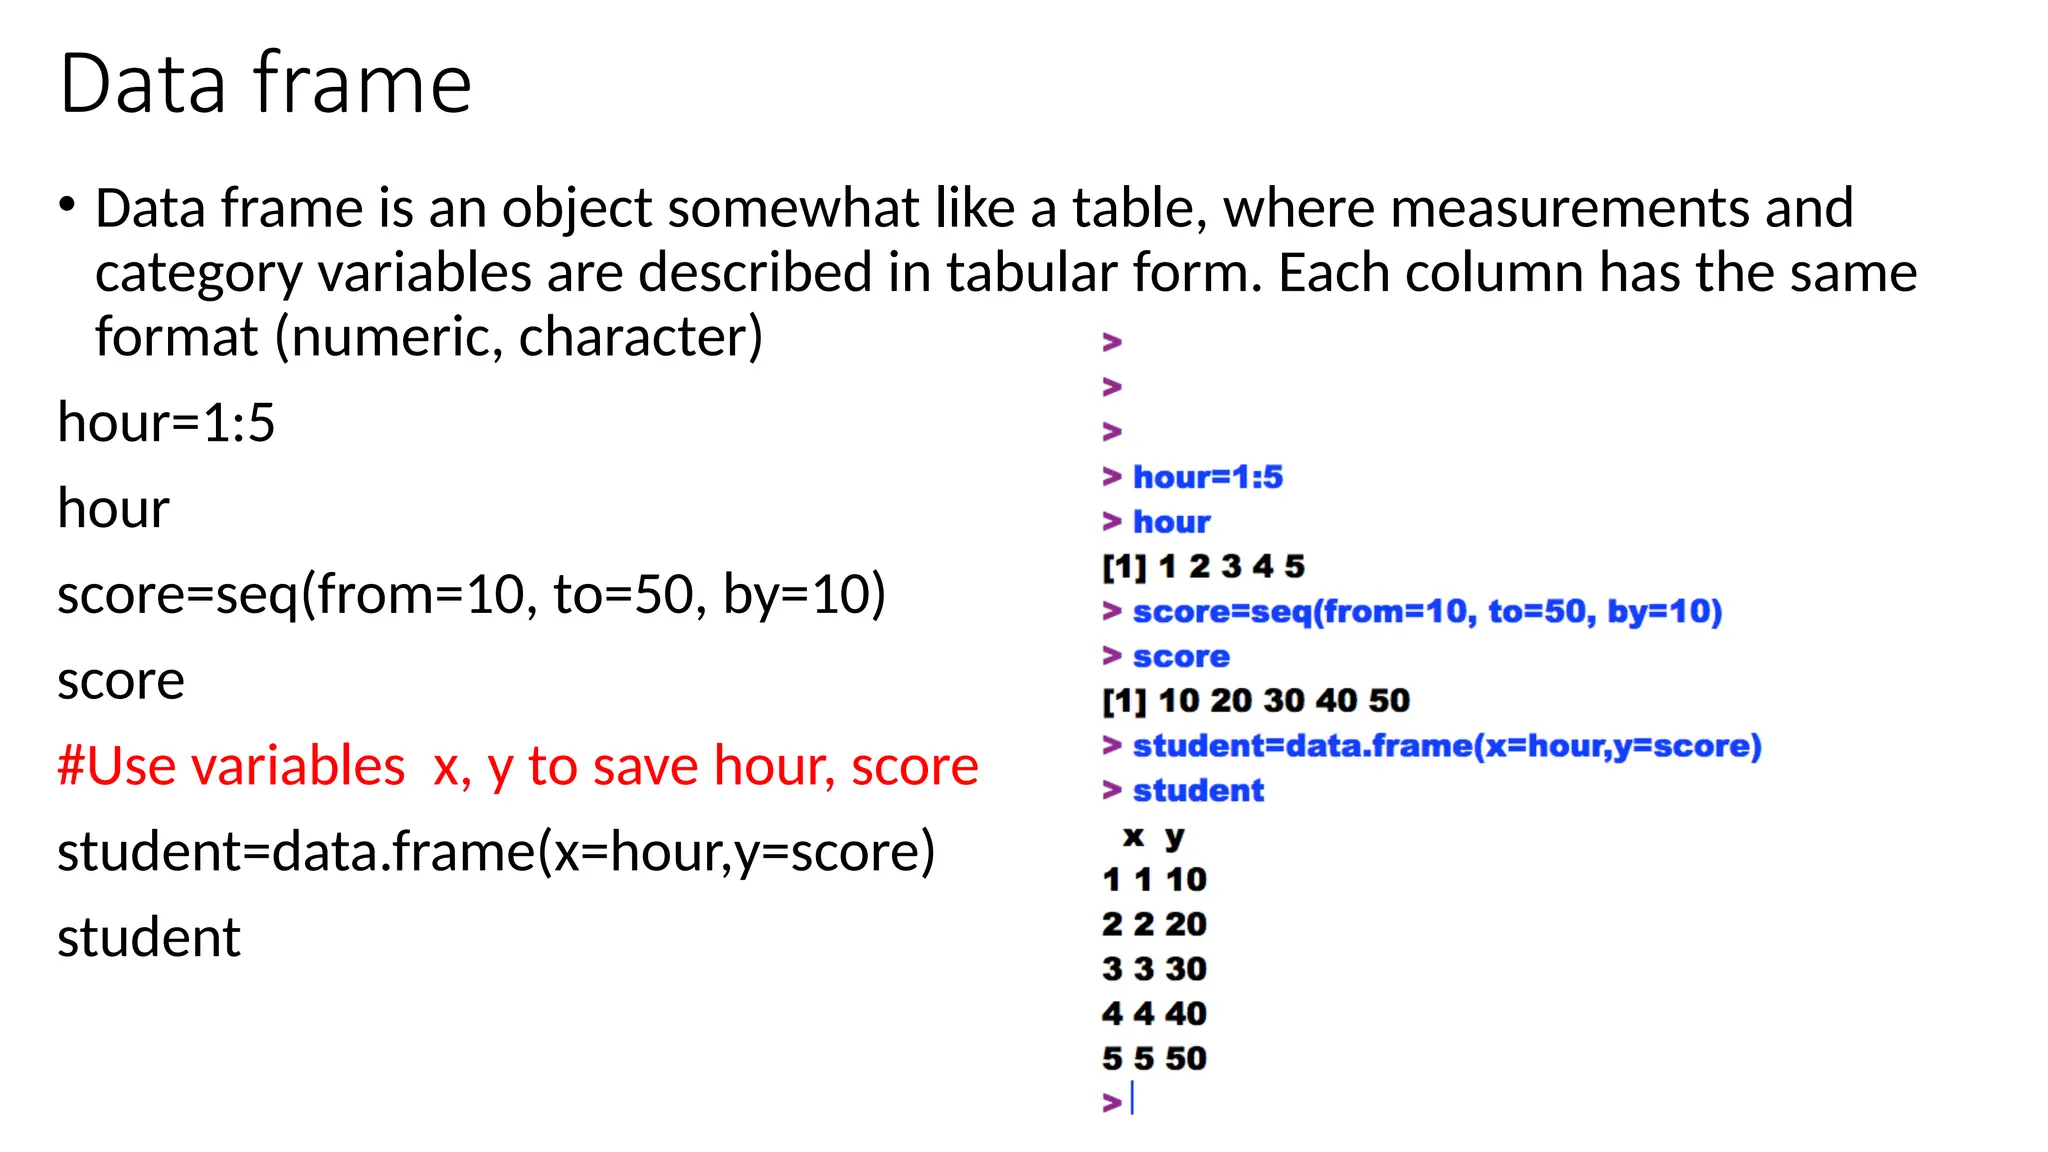
41
Data frame
• Dataframe is an object somewhat like a table, where measurements and
category variables are described in tabular form. Each column has the same
format (numeric, character)
hour=1:5
hour
score=seq(from=10, to=50, by=10)
score
#Use variables x, y to save hour, score
student=data.frame(x=hour,y=score)
student
43
pointer
z=c(11, 12, 13); z[2]; z[4]; z[c(1,3)]
#z(4) is empty, R returns not available ‘NA’
z=z[-2]; z #delete the 2nd
element
#Add the element back
z[2:3]=c(12,13);z

![6
Steps for installation of R
• http://cran.r-project.org/ download R [For Windows, MacOS, Linux]
• Once R is successfully installed, double click on the R icon, the following
console will be shown up](https://image.slidesharecdn.com/lecture-bprog-r-1-basic-eng-250319185202-3bc28b84/75/lecture-Basic-programing-R-1-basic-eng-pptx-6-2048.jpg)
![Steps for installation of Rstudio Desktop [Server]
https://www.rstudio.com/products/rstudio/download/
RStudio is just an IDE (Integrated Development Environment) in which you are using
the R language
Ref: What is the difference between R and RStudio? - Quora
What is the difference between R and R Studio program?
To identify R packages, read https://cran.r-project.org/ Task Views
Many other packages provided on Bioconductor, R-Forge, GitHub, etc.
read
http://www.bioconductor.org/
http://r-forge.r-project.org/
https://github.com/
Useful papers and information from Dr. Yanchang Zhao web site: RDataMining.com
Ref: http://www.rdatamining.com/docs](https://image.slidesharecdn.com/lecture-bprog-r-1-basic-eng-250319185202-3bc28b84/75/lecture-Basic-programing-R-1-basic-eng-pptx-7-2048.jpg)

![15
seq(1,9,length=5)
#generate a sequence from 1 to 9 with 5-1= 4 equal intervals
# 1 3 5 7 9
#Application of ‘seq’: setting the x-axis scale for graphic
#Generate intervals [there are (length – 1) intervals]
A=seq(0,10,length=11);A
rev(A) # reverse the order
rank(A)
B=seq(1,10,length=10);B
C=c(1,2,3,3,4,5)
length(C)
rank(C)
D=c(1,2,3,3,4,4,5); length(D); rank(D)](https://image.slidesharecdn.com/lecture-bprog-r-1-basic-eng-250319185202-3bc28b84/75/lecture-Basic-programing-R-1-basic-eng-pptx-15-2048.jpg)

![24
Matrix
Remark:
[1] matrix multiplication is not commute, AB not equal to BA
[2] zapsmall(A*Ainv) # the symbol ‘*’ DOES NOT mean matrix
multiplication !!](https://image.slidesharecdn.com/lecture-bprog-r-1-basic-eng-250319185202-3bc28b84/75/lecture-Basic-programing-R-1-basic-eng-pptx-24-2048.jpg)
![25
Matrix – eigenvalues and eigenvectors
A <- matrix(c(13, -4, 2, -4, 11, -2, 2, -2, 8), 3, 3, byrow=T)
det(A)
# Eigenvalues and eigenvectors – Wikipedia # geometric meaning
#Ax = l x, given a 3x3 matrix A [3 eigenvalues and 3 eigenvectors ]
#Ax1 = l1 x1, Ax2 = l2 x2 , Ax3 = l3 x3
#[Ax2 = 8 x2 ]
Z=eigen(A); Z$values[2] # the second eigenvalue
Z$vectors[,2] # the second eigenvector
#an eigenvector of a shear mapping does not change direction, and since its length is unchanged, its
eigenvalue is 1.](https://image.slidesharecdn.com/lecture-bprog-r-1-basic-eng-250319185202-3bc28b84/75/lecture-Basic-programing-R-1-basic-eng-pptx-25-2048.jpg)
![26
Matrix
Remark:
[1] matrix multiplication is not commute, AB not equal to BA
[2] zapsmall(A*Ainv) # the symbol ‘*’ DOES NOT mean matrix
multiplication !!
More on matrix algebra in R, read
https://www.statmethods.net/advstats/matrix.html](https://image.slidesharecdn.com/lecture-bprog-r-1-basic-eng-250319185202-3bc28b84/75/lecture-Basic-programing-R-1-basic-eng-pptx-26-2048.jpg)
![27
Multiplication of matrix and vector
Let A [nrow=3, ncol=2] and x [nrow=2, ncol=1]
denote a matrix and a vector respectively.
Need to form Ax [Ax2 = 8 x2 ]
A=matrix(1:6,3,2,byrow=T); A;
dim(A) # A is a matrix with nrow=3, ncol=2
x=c(7,8);x;
dim(x); length(x)
#x is a column vector, that is nrow=2, ncol=1
#‘dim’ command apply for matrix but not for c(7,8),
#one has to use ‘length’
A%*%x
#define a column vector using ‘matrix’
x=matrix(c(7,8),byrow=T); x
dim(x); length(x)](https://image.slidesharecdn.com/lecture-bprog-r-1-basic-eng-250319185202-3bc28b84/75/lecture-Basic-programing-R-1-basic-eng-pptx-27-2048.jpg)
![28
Multiplication of matrix and vector
In-class exercise
Verify the eigenvalue equation, Ax = l x
# Ax2 = l2 x2
A <- matrix(c(13, -4, 2, -4, 11, -2, 2, -2, 8), 3, 3, byrow=T)
Z=eigen(A)
Z$values[2] # the second eigenvalue
Z$vectors[,2] # the second eigenvector
A%*%Z$vectors[,2]
#To verify correctness of the result, use R to
#determine if the following give a ZERO vector [Ax2 - 8 x2 =0]
A%*%Z$vectors[,2]- Z$values[2]*Z$vectors[,2]
zapsmall(A%*%Z$vectors[,2]- Z$values[2]*Z$vectors[,2])
round((A%*%Z$vectors[,2]- Z$values[2]*Z$vectors[,2]),7)](https://image.slidesharecdn.com/lecture-bprog-r-1-basic-eng-250319185202-3bc28b84/75/lecture-Basic-programing-R-1-basic-eng-pptx-28-2048.jpg)
![33
Objects – character, array, data.frame
letter=c("a","b","c","d")
y<-matrix(letter,2,2)
y
y<-matrix(letter,2,2,byrow=T)
y
z=c(T,F,T,F)
z
# character > complex > numeric > logical , any array consists of character, every element are treated as
character
x<-c("help", 3+6i, 5.42, FALSE) # coerce [force] to character
x
y<-c(3+6i, 5.42, FALSE) # coerce to complex
y
z<-c(5.42, FALSE) # coerce to numerical
z](https://image.slidesharecdn.com/lecture-bprog-r-1-basic-eng-250319185202-3bc28b84/75/lecture-Basic-programing-R-1-basic-eng-pptx-33-2048.jpg)
![37
random number generator
n=3
x<-runif(n,0,100) # generate three random numbers between 0 and 100
x
y=sort(as.integer(x)) #take the integer part [same as floor] and sorting the data in ascending order
y
mean(y)
median(y)
sum(y)
sd(y) #standard deviation
var(y) #var = (sd)^2
range(y)
quantile(y)
IQR(y)
summary(y)
#list of the summary statistics for dataset y](https://image.slidesharecdn.com/lecture-bprog-r-1-basic-eng-250319185202-3bc28b84/75/lecture-Basic-programing-R-1-basic-eng-pptx-37-2048.jpg)
![38
interquartile range (IQR), decile
• interquartile range (IQR) computes interquartile range of the x values. IQR is defined by
• IQR = upper quantile – lower quantile
• where upper quantile and lower quantile denote the 75% and 25% data.
• To determine the percentile position p, given the qth percentile, it is given by
• p = 1 + q(n-1)
• Consider q=0% p=1, q=100%=1 p=n
• here p, q and n denote the position, percentage, and total number of entries.
• data locate within the intervals, (i) upper quantile + (1.5 ~ 3.0)*IQR, or (ii) lower quantile - (1.5 ~ 3.0)*IQR, are possible
outliers. Data locate outside (i) quantile +3.0*IQR, or (ii) lower quantile - 3.0*IQR are absolutely outliers.
• Example 1 Let x={11, 13, 15, 17, 19}, then
• 25% position = 1 + 0.25*(5-1) = 2nd
position 13
• 50% position = 1 + 0.50*(5-1) = 3rd
position 15 (median)
quantile(x, prob = seq(0, 1, length = 11)) # decile
• Example 2 Let x={11, 13, 15, 17, 19, 21}, then
• 25% position = 1 + 0.25*(6-1) = 2.25 position , decimal place 13 + (15-13)*.25 = 13.5 [by proportion]
• 50% position = 1 + 0.50*(6-1) = 3.5 15 + (17-15)*0.5 = 16
• 60% position = 1 + 0.60*(6-1) = 4th position 17
• 60% position also called 6th
decile [ sounds like decimal and percentile together), as they split the data into 10% groups]](https://image.slidesharecdn.com/lecture-bprog-r-1-basic-eng-250319185202-3bc28b84/75/lecture-Basic-programing-R-1-basic-eng-pptx-38-2048.jpg)
![39
Two datasets, runif =random uniform
# n= ?
n=6 #sort in ascending order , as.integer take the integer part
A=sort(as.integer(runif(n,0,100)))# generate 6 random numbers between 0 and 100
A
B=sort(sample(0:100,n,replace=T))
B # sample generates integers
C=cbind(A,B)
# cbind, rbind - take a sequence of vector, matrix or
#data-frame arguments and combine by columns or rows,
#respectively.
rownames(C)=c(1:6)
C
summary(C)
summary(C[,1]) #summary of dataset a
summary(C[,2]) #summary of dataset b
sd(C[,"A"]) # var of dataset a](https://image.slidesharecdn.com/lecture-bprog-r-1-basic-eng-250319185202-3bc28b84/75/lecture-Basic-programing-R-1-basic-eng-pptx-39-2048.jpg)
![42
Data frame
student
student$x
student$y
student[,1]
student[,2]
student[,"x"]
student[, "y"]
student=data.frame(hour,score)
student
student$hour](https://image.slidesharecdn.com/lecture-bprog-r-1-basic-eng-250319185202-3bc28b84/75/lecture-Basic-programing-R-1-basic-eng-pptx-42-2048.jpg)
![43
pointer
z=c(11, 12, 13) ; z[2]; z[4]; z[c(1,3)]
#z(4) is empty, R returns not available ‘NA’
z=z[-2]; z #delete the 2nd
element
#Add the element back
z[2:3]=c(12,13);z](https://image.slidesharecdn.com/lecture-bprog-r-1-basic-eng-250319185202-3bc28b84/75/lecture-Basic-programing-R-1-basic-eng-pptx-43-2048.jpg)


![Vibe Coding vs. Spec-Driven Development [Free Meetup]](https://cdn.slidesharecdn.com/ss_thumbnails/vibecodingvsspecdrivendevelopment-251209105622-43f455e7-thumbnail.jpg?width=640&height=640&fit=bounds)


