phenotype
frequency
phenotype
frequency
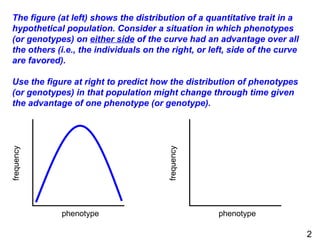
The figure (atleft) shows the distribution of a quantitative trait in a
hypothetical population. Consider a situation in which phenotypes
(or genotypes) on either side of the curve had an advantage over all
the others (i.e., the individuals on the right, or left, side of the curve
are favored).
Use the figure at right to predict how the distribution of phenotypes
(or genotypes) in that population might change through time given
the advantage of one phenotype (or genotype).
2
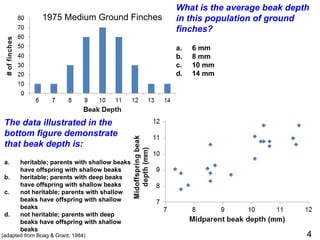
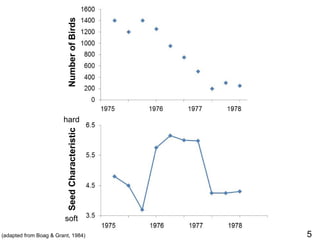
1975 Medium GroundFinches
(adapted from Boag & Grant, 1984)
What is the average beak depth
in this population of ground
finches?
a. 6 mm
b. 8 mm
c. 10 mm
d. 14 mm
The data illustrated in the
bottom figure demonstrate
that beak depth is:
a. heritable; parents with shallow beaks
have offspring with shallow beaks
b. heritable; parents with deep beaks
have offspring with shallow beaks
c. not heritable; parents with shallow
beaks have offspring with shallow
beaks
d. not heritable; parents with deep
beaks have offspring with shallow
beaks
4
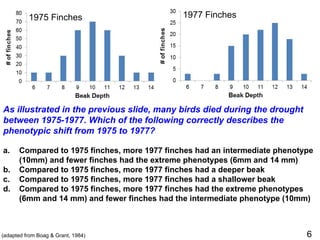
1975 Finches
As illustratedin the previous slide, many birds died during the drought
between 1975-1977. Which of the following correctly describes the
phenotypic shift from 1975 to 1977?
a. Compared to 1975 finches, more 1977 finches had an intermediate phenotype
(10mm) and fewer finches had the extreme phenotypes (6mm and 14 mm)
b. Compared to 1975 finches, more 1977 finches had a deeper beak
c. Compared to 1975 finches, more 1977 finches had a shallower beak
d. Compared to 1975 finches, more 1977 finches had the extreme phenotypes
(6mm and 14 mm) and fewer finches had the intermediate phenotype (10mm)
1977 Finches
(adapted from Boag & Grant, 1984) 6
7.
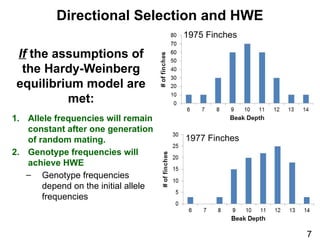
Directional Selection andHWE
7
1. Allele frequencies will remain
constant after one generation
of random mating.
2. Genotype frequencies will
achieve HWE
‒ Genotype frequencies
depend on the initial allele
frequencies
If the assumptions of
the Hardy-Weinberg
equilibrium model are
met:
1977 Finches
1975 Finches
8.
phenotype
frequency
phenotype
frequency
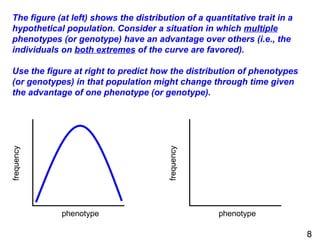
The figure (atleft) shows the distribution of a quantitative trait in a
hypothetical population. Consider a situation in which multiple
phenotypes (or genotype) have an advantage over others (i.e., the
individuals on both extremes of the curve are favored).
Use the figure at right to predict how the distribution of phenotypes
(or genotypes) in that population might change through time given
the advantage of one phenotype (or genotype).
8
9.
(adapted from Benkman,2003, Evolution)
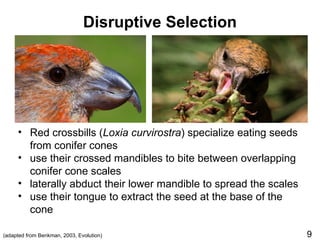
Disruptive Selection
• Red crossbills (Loxia curvirostra) specialize eating seeds
from conifer cones
• use their crossed mandibles to bite between overlapping
conifer cone scales
• laterally abduct their lower mandible to spread the scales
• use their tongue to extract the seed at the base of the
cone
9
10.
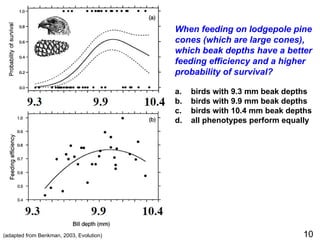
When feeding onlodgepole pine
cones (which are large cones),
which beak depths have a better
feeding efficiency and a higher
probability of survival?
a. birds with 9.3 mm beak depths
b. birds with 9.9 mm beak depths
c. birds with 10.4 mm beak depths
d. all phenotypes perform equally
(adapted from Benkman, 2003, Evolution) 10
11.
(adapted from Benkman,2003, Evolution)
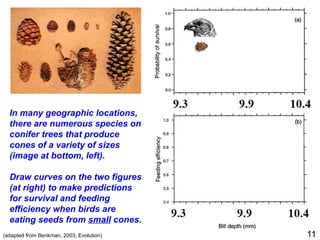
In many geographic locations,
there are numerous species on
conifer trees that produce
cones of a variety of sizes
(image at bottom, left).
Draw curves on the two figures
(at right) to make predictions
for survival and feeding
efficiency when birds are
eating seeds from small cones.
11
12.
(adapted from Benkman,2003, Evolution) 12
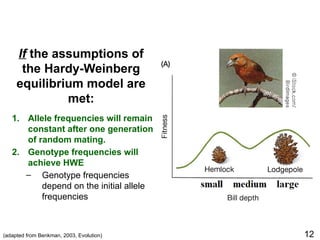
1. Allele frequencies will remain
constant after one generation
of random mating.
2. Genotype frequencies will
achieve HWE
‒ Genotype frequencies
depend on the initial allele
frequencies
If the assumptions of
the Hardy-Weinberg
equilibrium model are
met:
13.
phenotype
frequency
phenotype
frequency
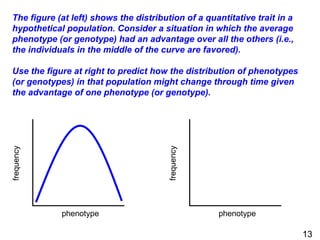
The figure (atleft) shows the distribution of a quantitative trait in a
hypothetical population. Consider a situation in which the average
phenotype (or genotype) had an advantage over all the others (i.e.,
the individuals in the middle of the curve are favored).
Use the figure at right to predict how the distribution of phenotypes
(or genotypes) in that population might change through time given
the advantage of one phenotype (or genotype).
13
14.
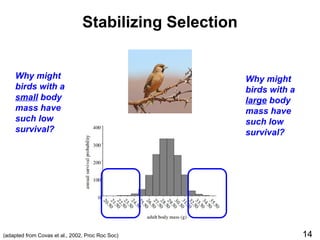
Stabilizing Selection
(adapted fromCovas et al., 2002, Proc Roc Soc)
Why might
birds with a
small body
mass have
such low
survival?
Why might
birds with a
large body
mass have
such low
survival?
14