Download as PDF, PPTX


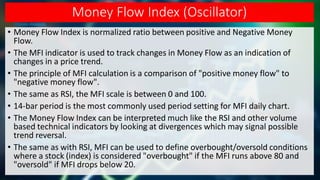
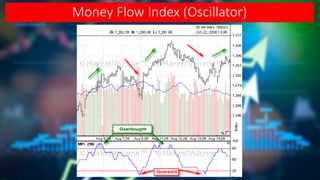
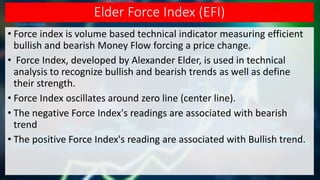
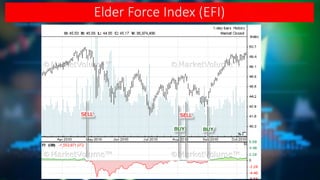
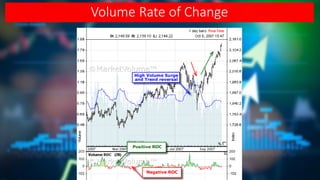

The document discusses several volume-based technical indicators: - Money Flow Index (MFI) which tracks changes in money flow as an indication of price trend changes. A 14-period setting is commonly used on daily charts. MFI can indicate overbought (>80) and oversold (<20) conditions. - Elder Force Index (EFI) which measures bullish and bearish money flow forcing price changes. Positive readings indicate bullish trends and negative readings bearish trends. - Ease of Movement (EMV) which measures money flow using middle price instead of close. Positive readings indicate positive money flow and buying pressure while negative readings indicate selling pressure. - Volume Rate of Change (ROC) which


