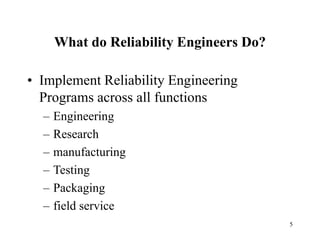
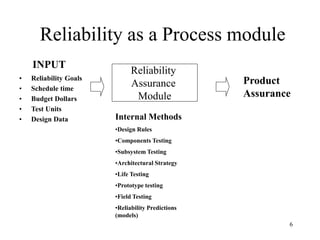
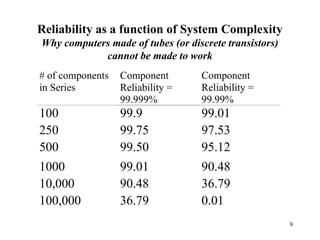
1. The document discusses reliability engineering and strategies to improve product reliability. It covers topics like reliability goals, testing approaches, common failure modes, and analysis techniques.
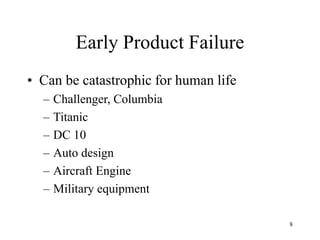
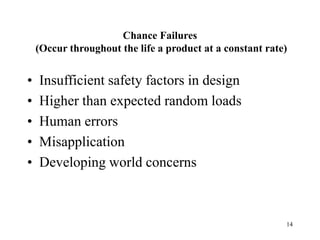
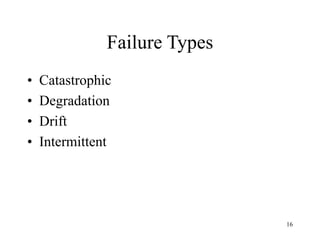
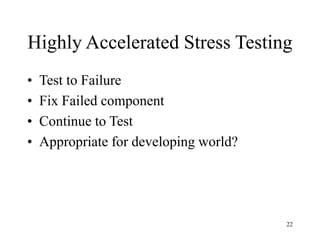
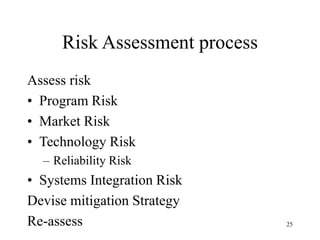
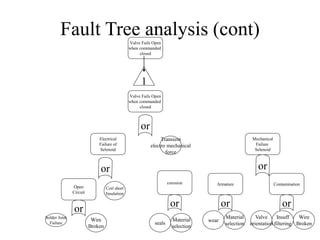
2. Specific points discussed include the bathtub curve for failure rates, approaches to address infant mortality, wear-out, and chance failures, and analyses like FMEA and fault tree analysis to understand potential failures.
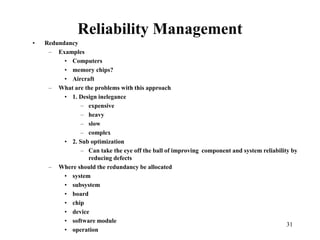
3. Best practices mentioned are implementing redundancy carefully, using fewer components, better material selection, starting reliability efforts earlier, and understanding failure physics to model reliability.