The document provides an overview of key topics related to internet protocols and performance, including:
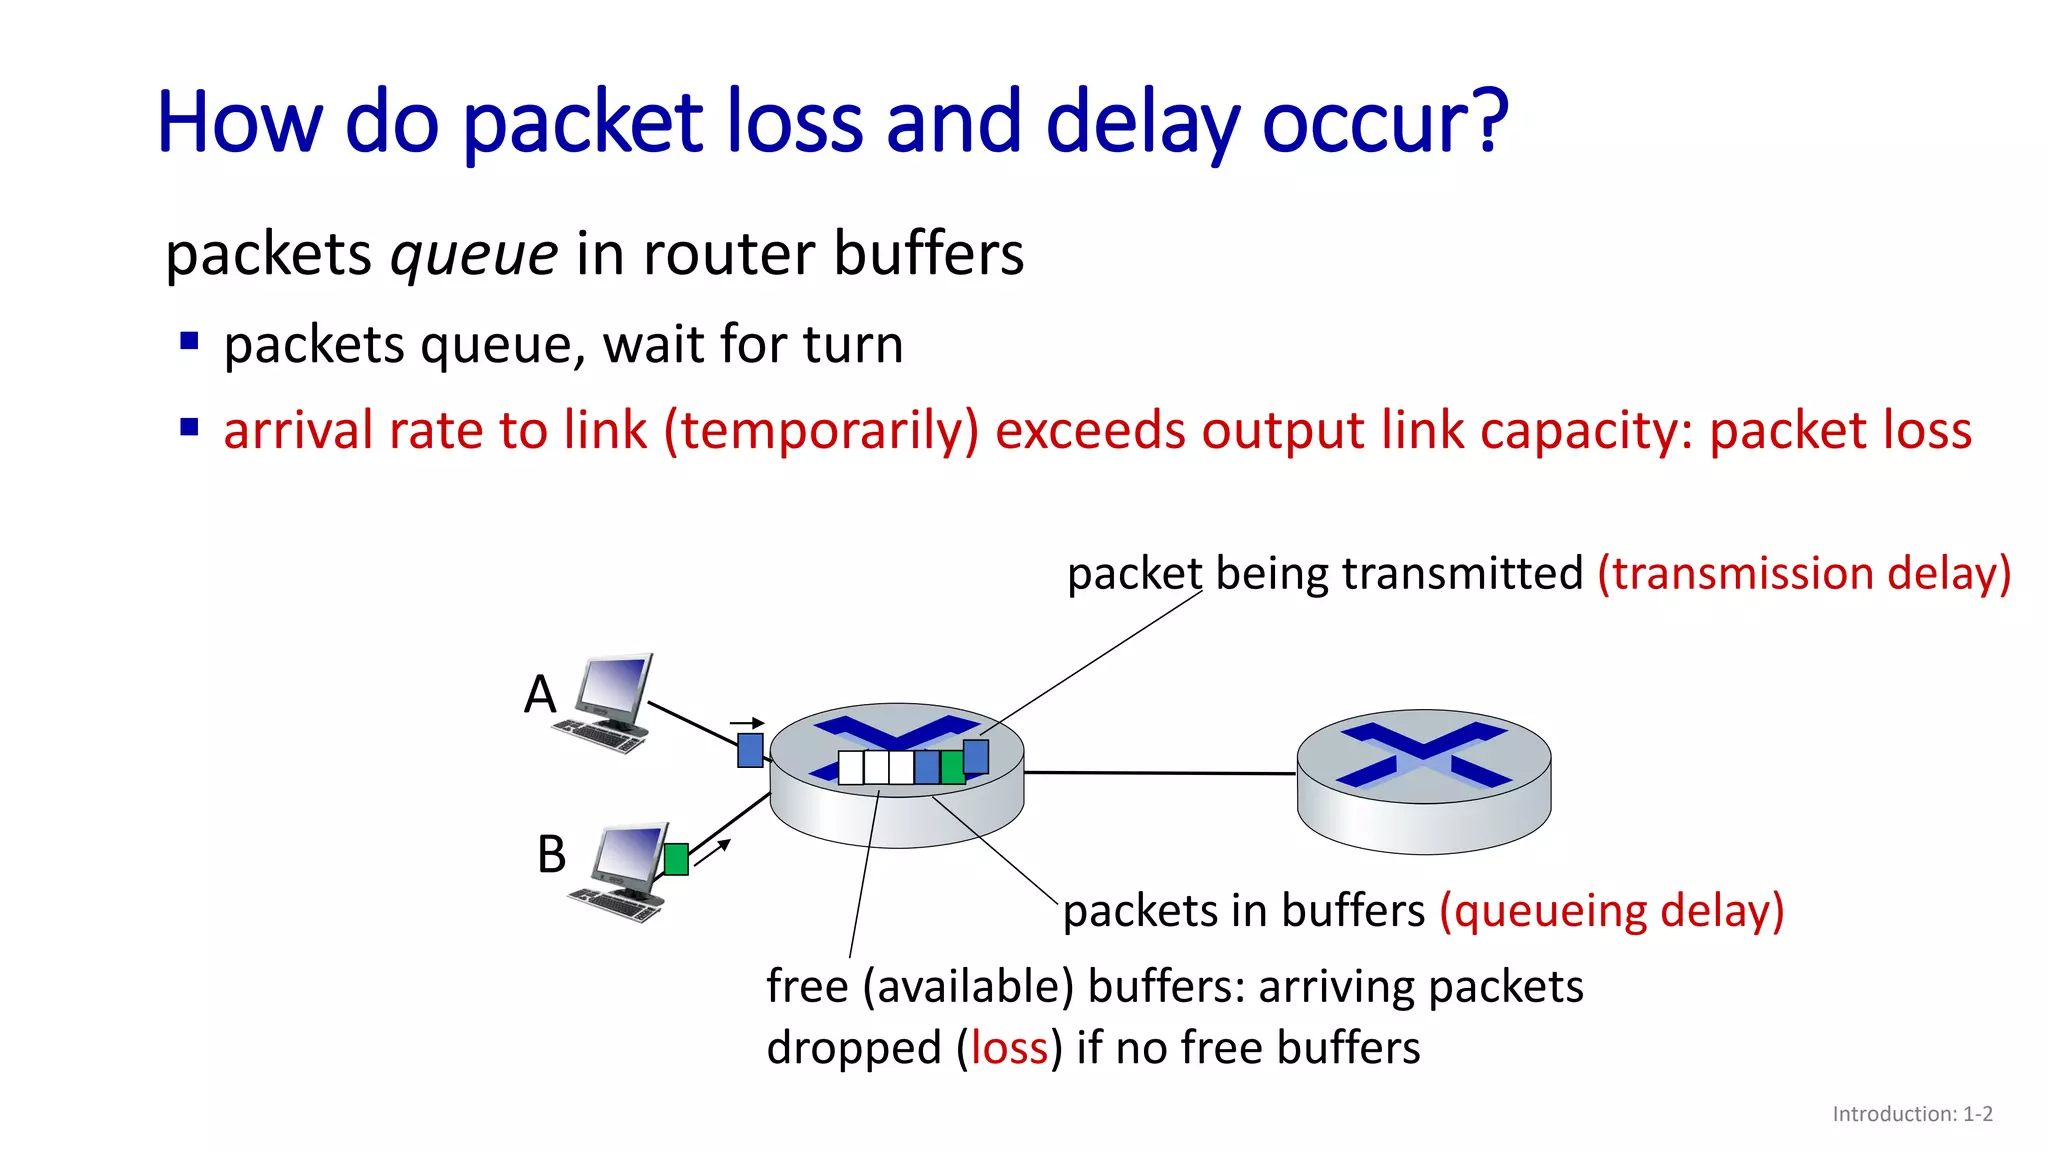
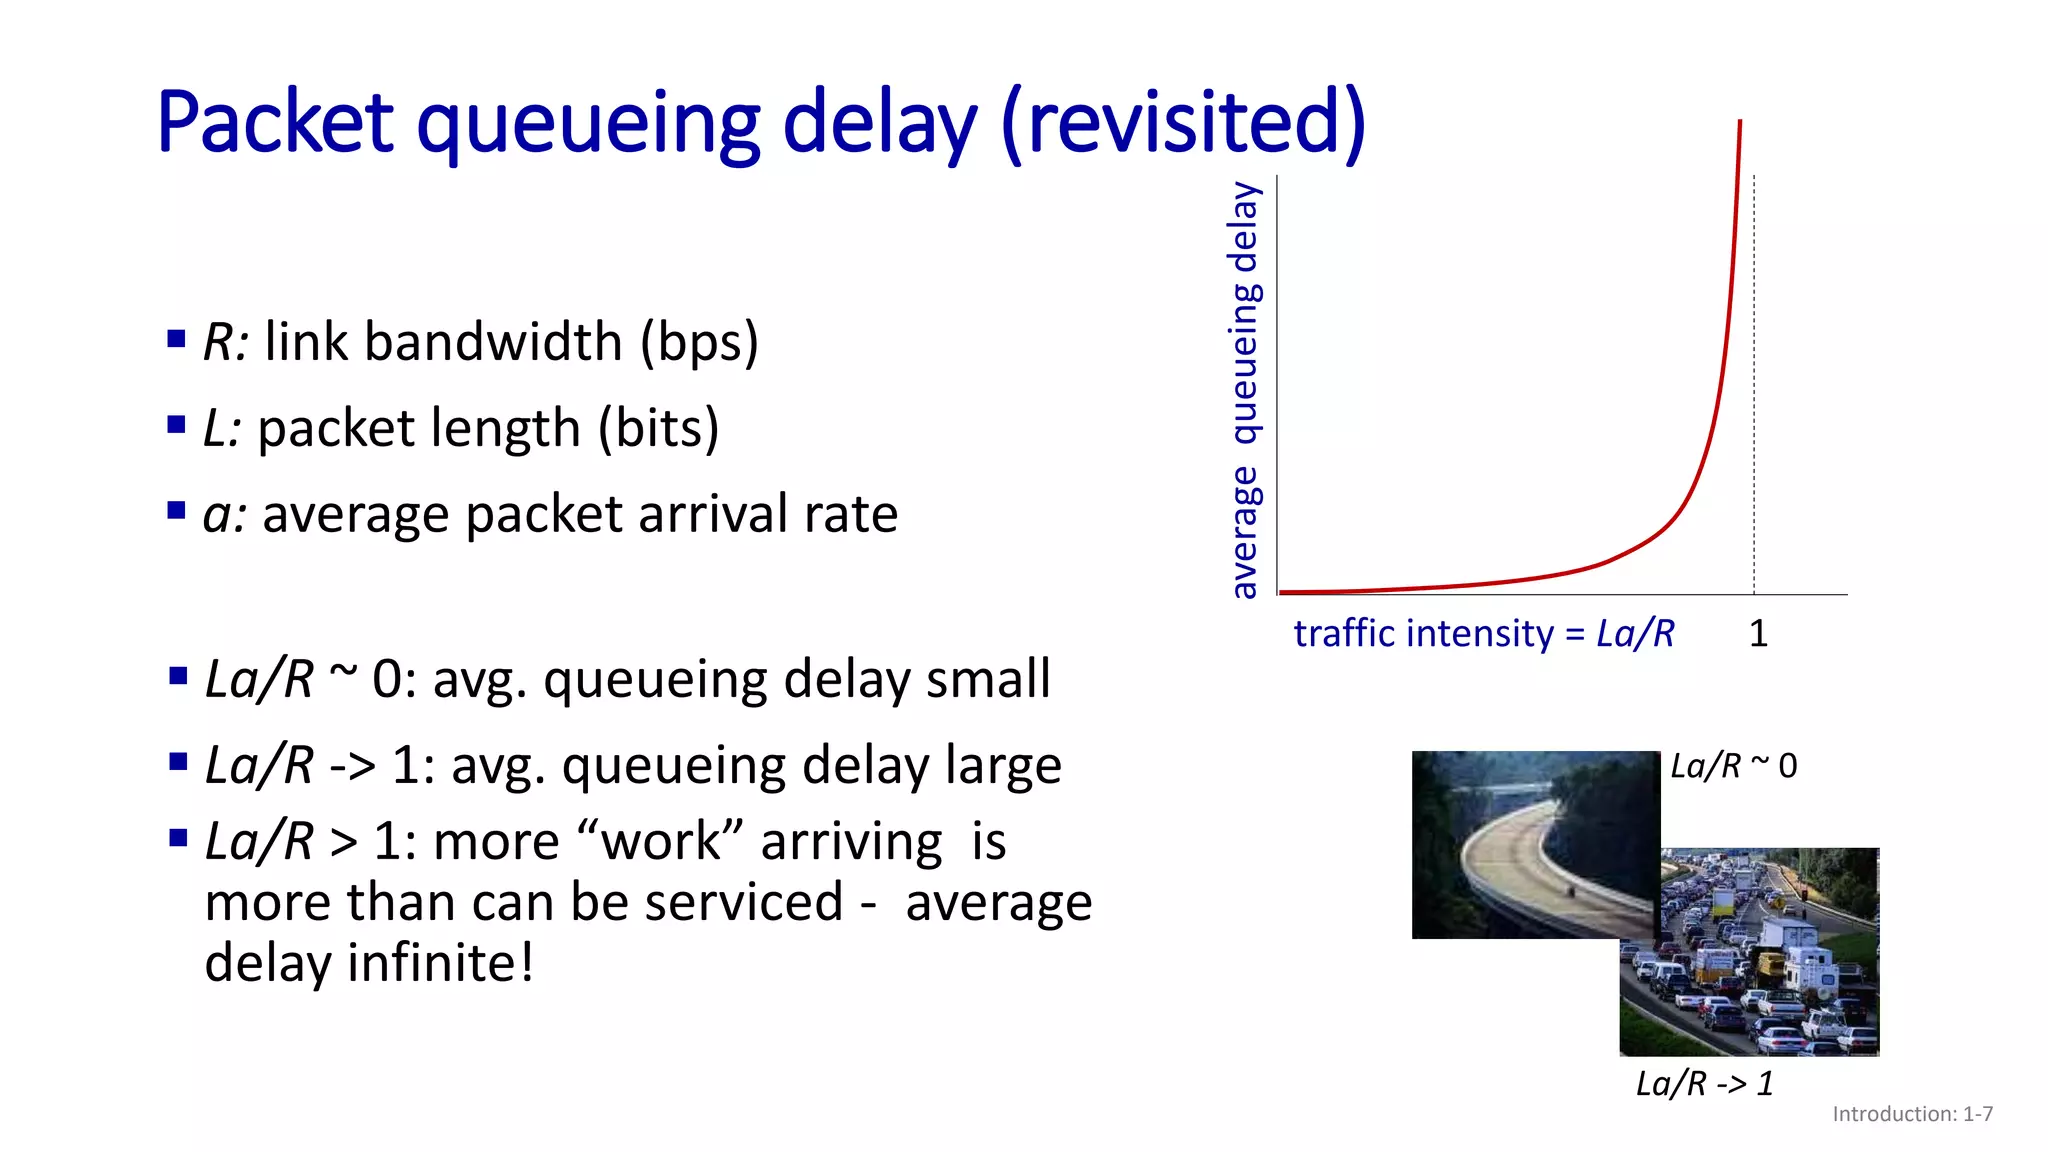
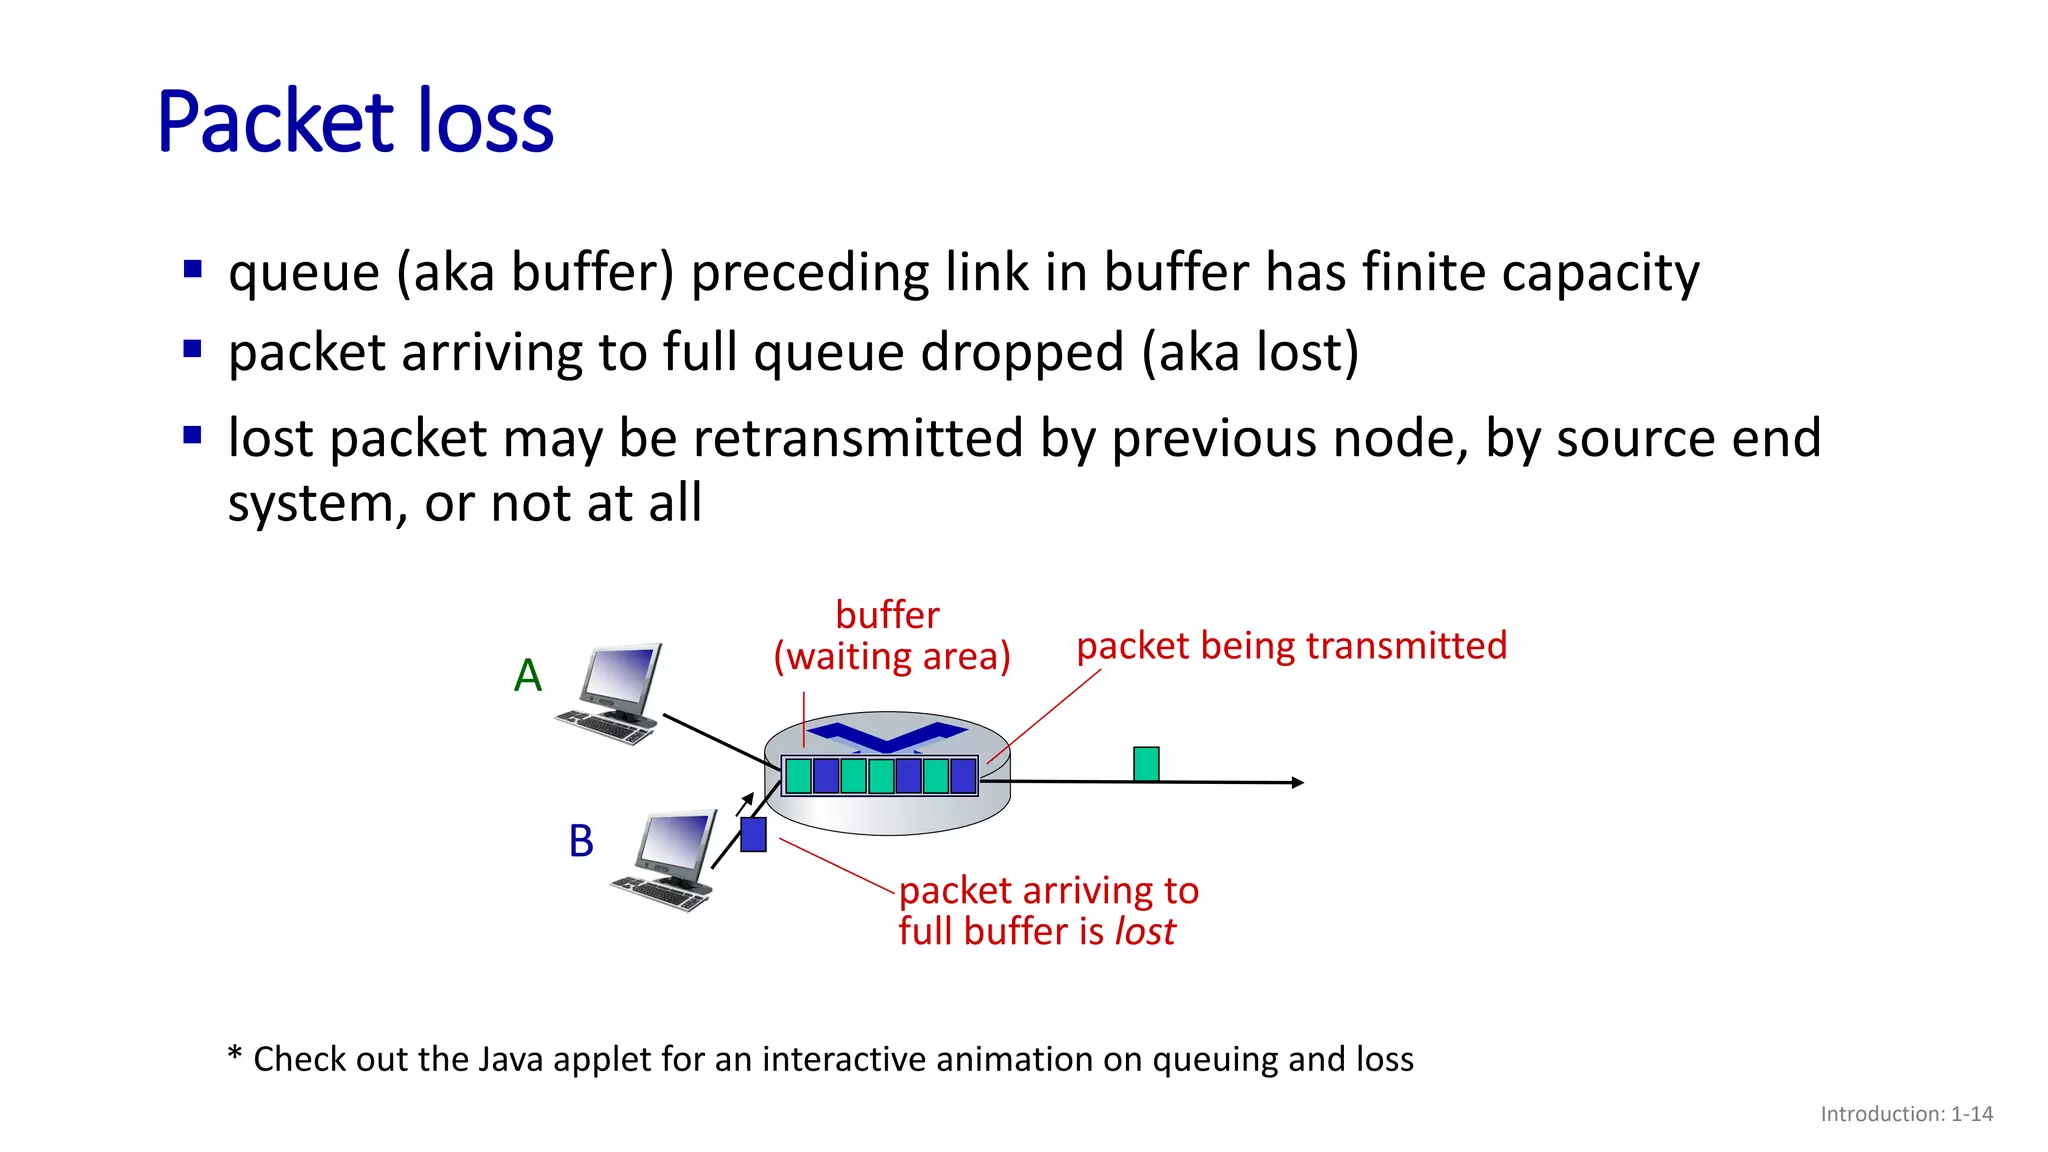
- How packet loss and delay can occur due to queueing in router buffers when arrival rates exceed link capacities;
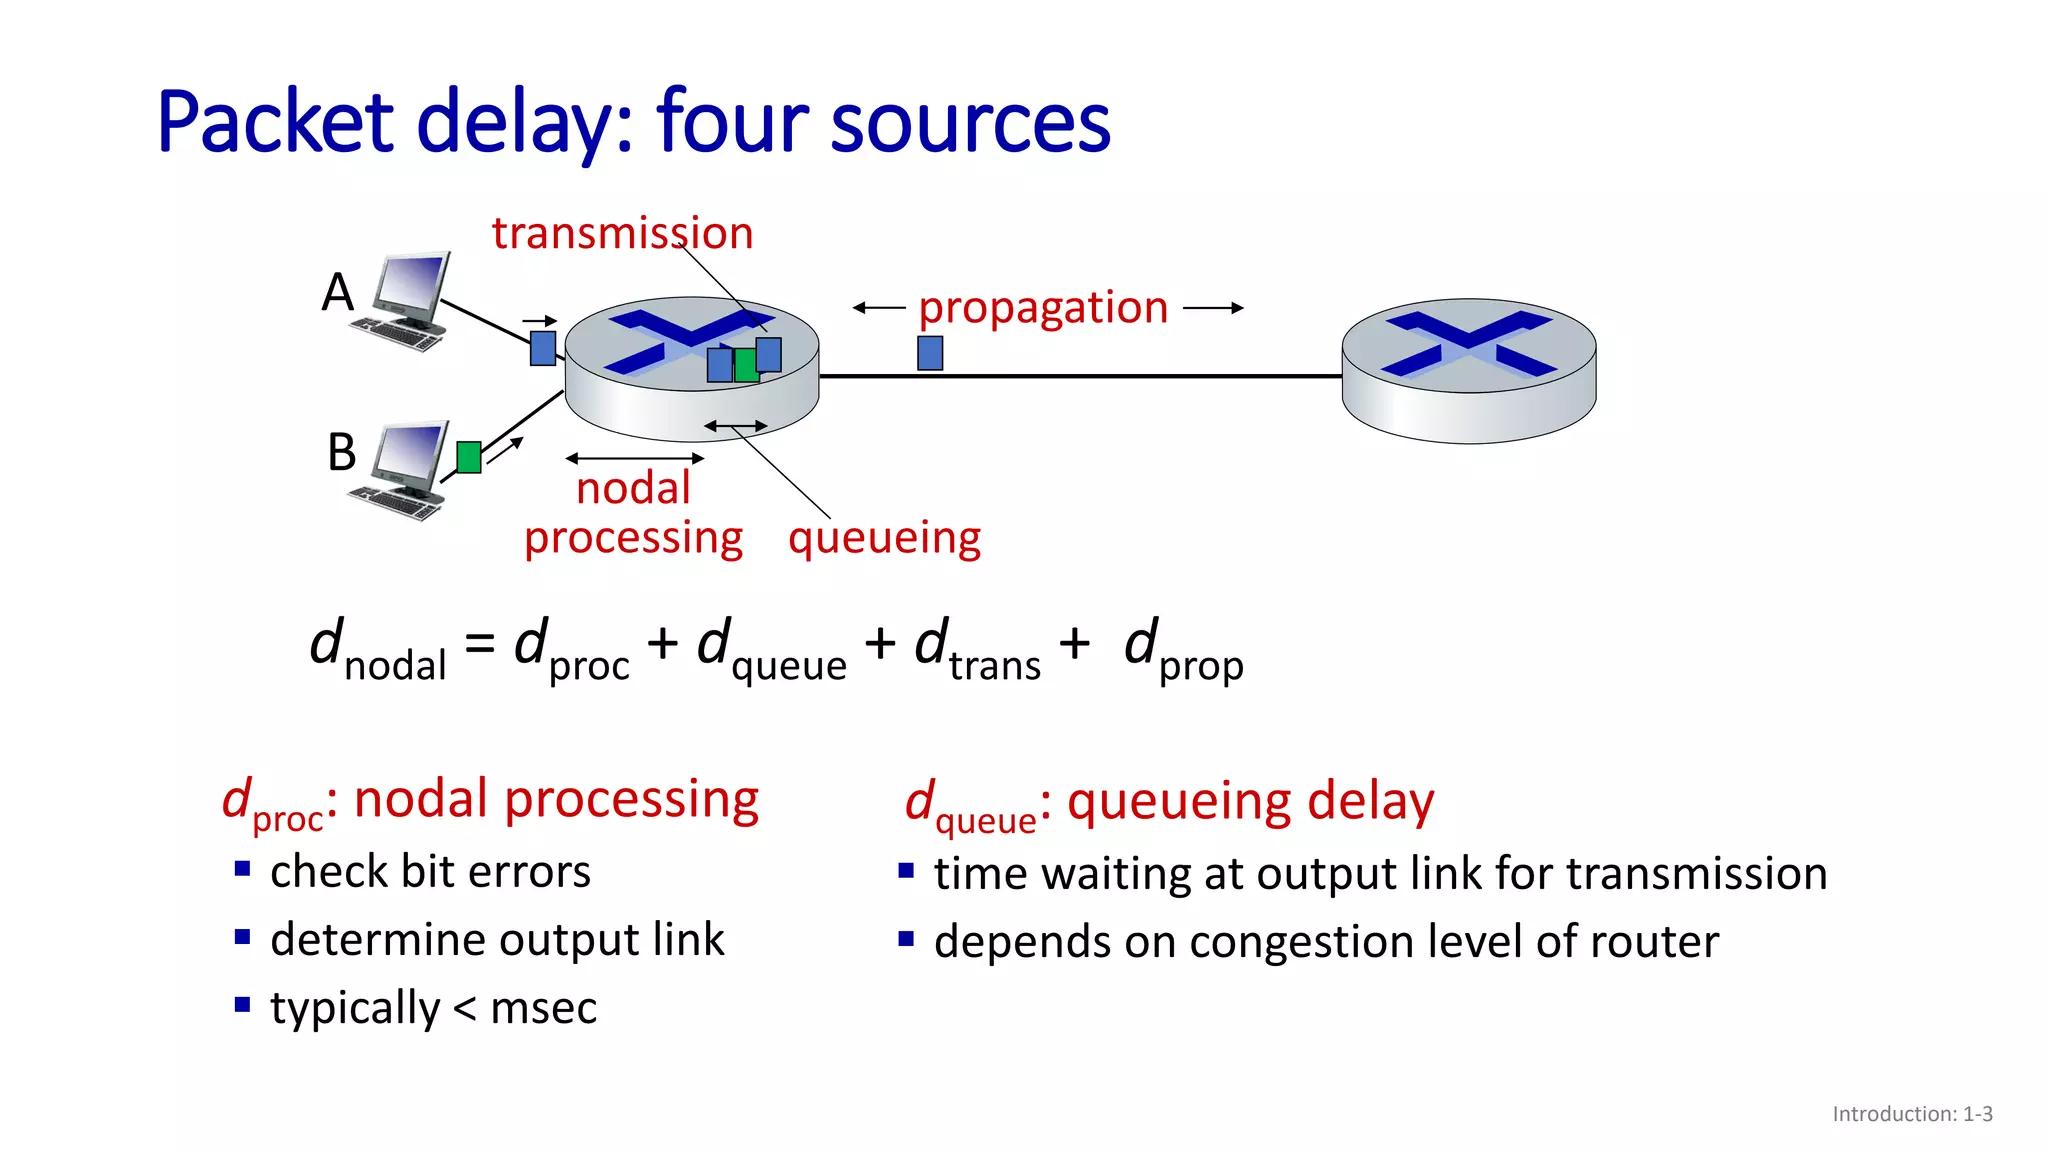
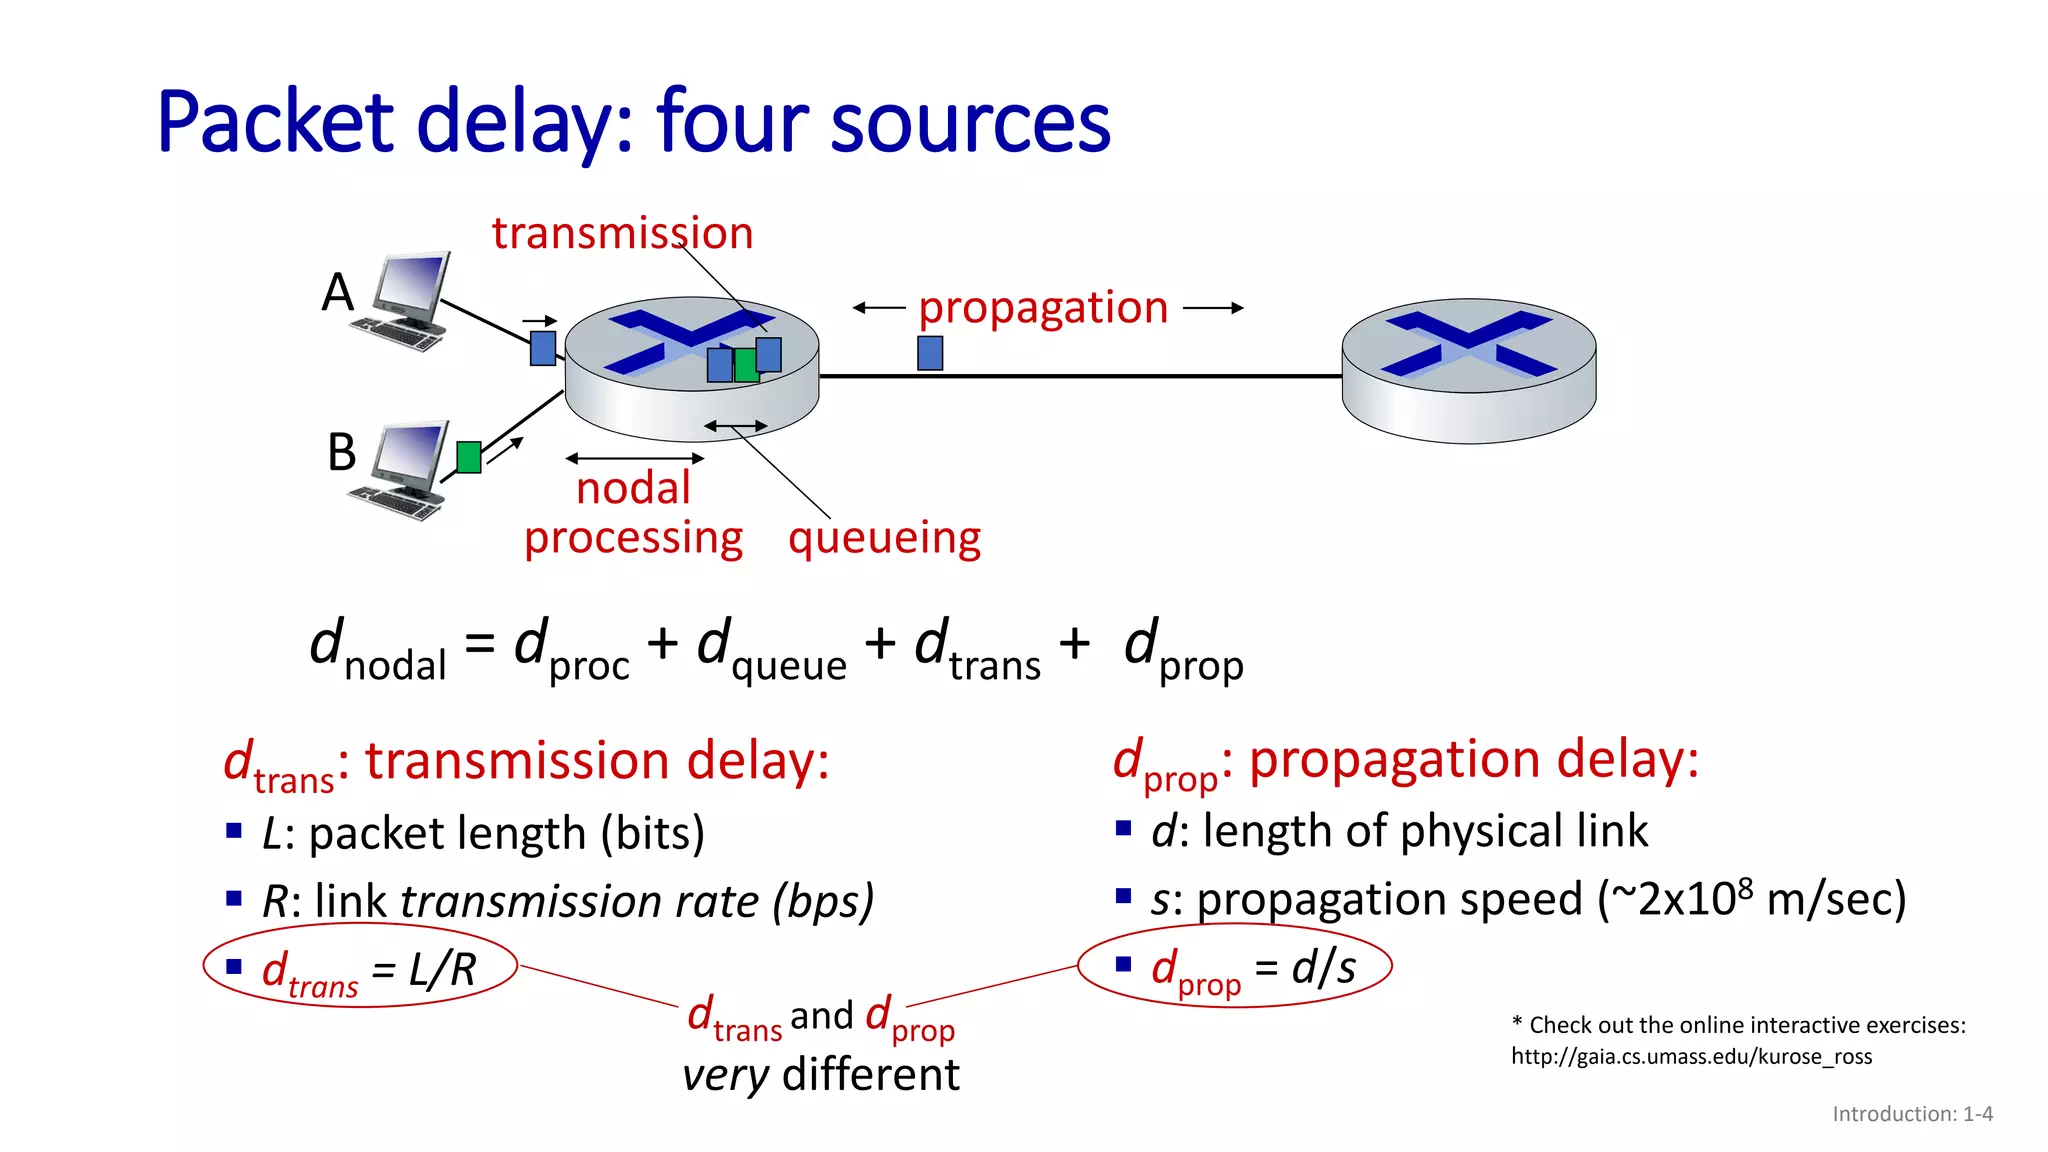
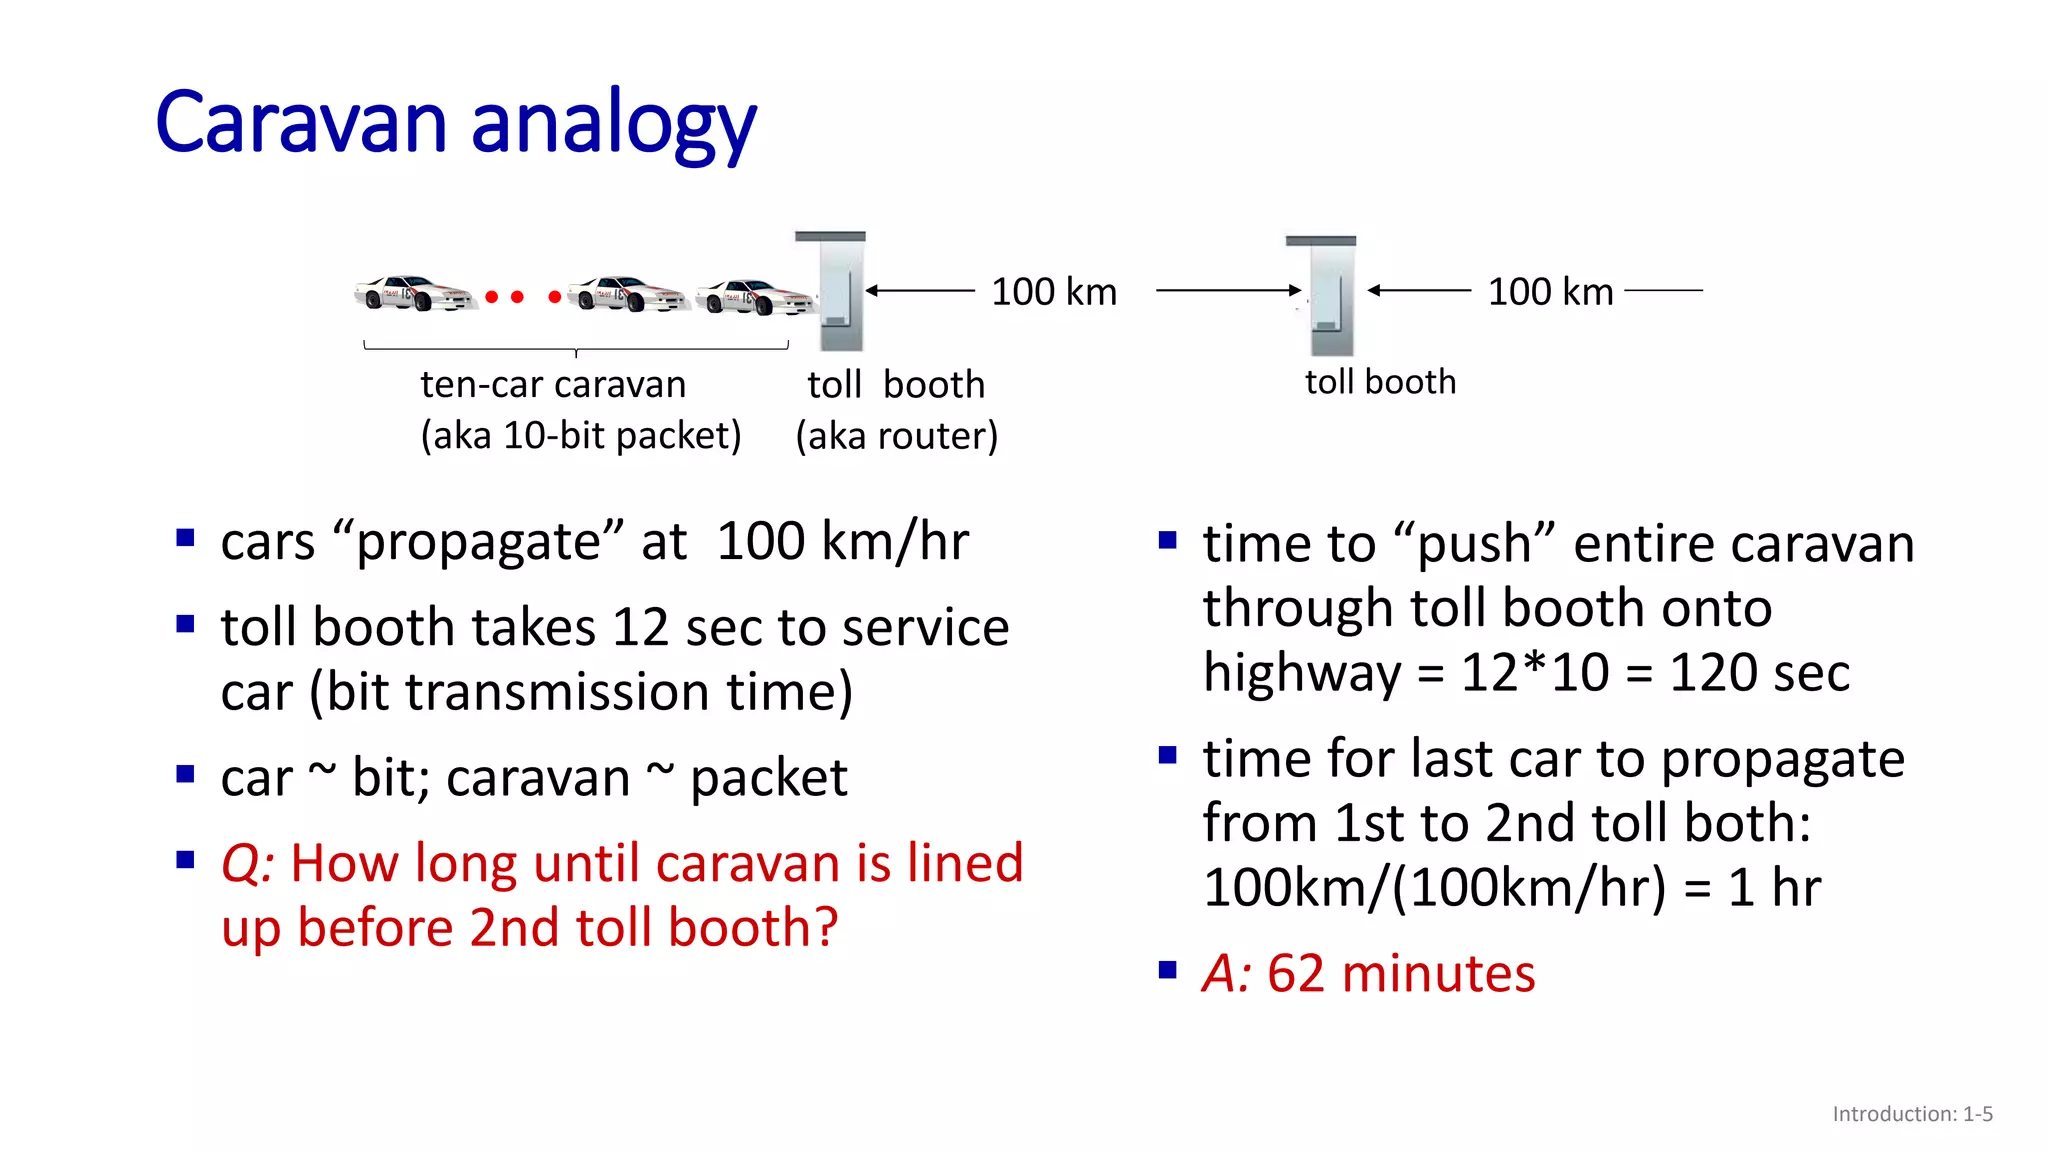
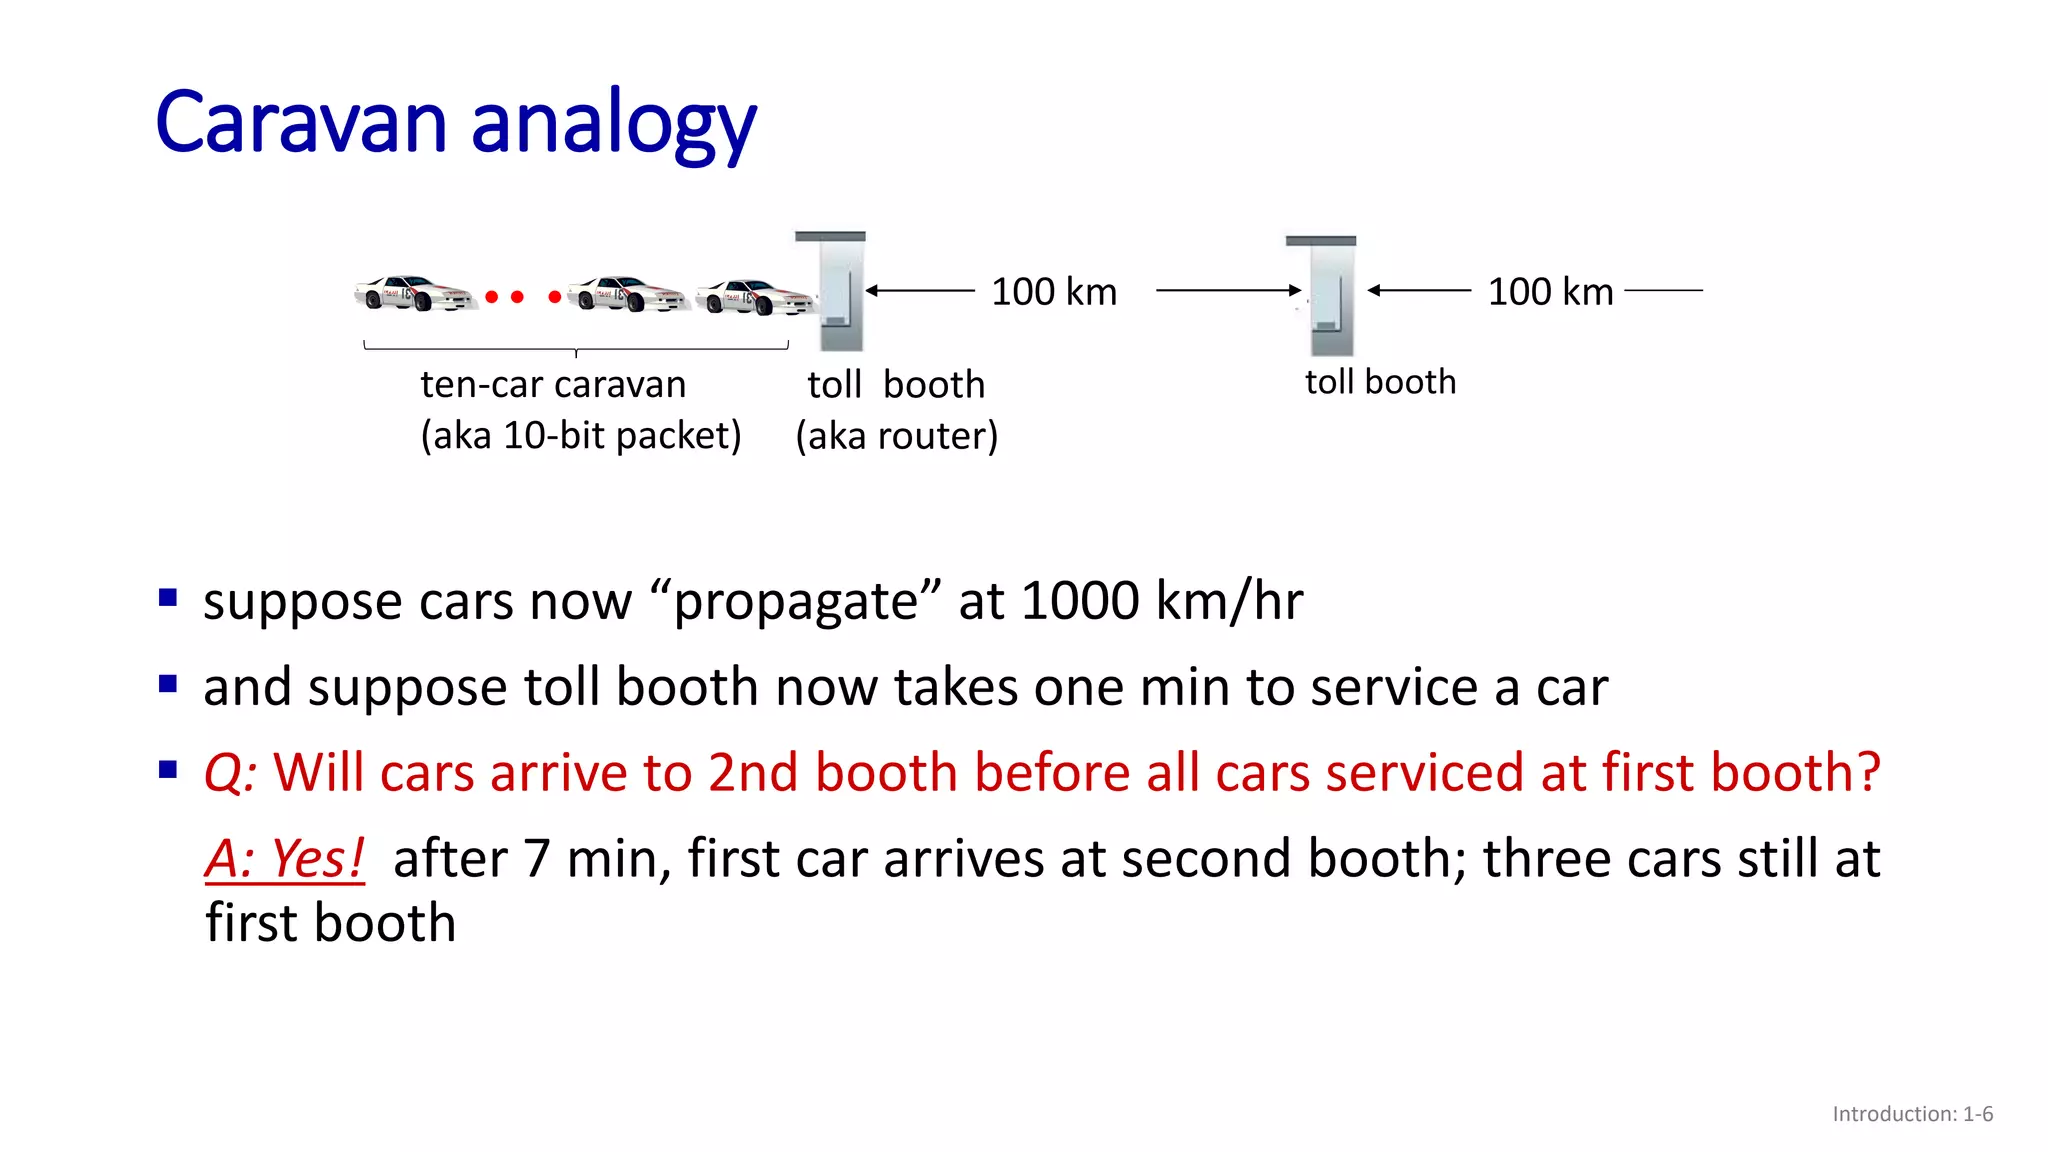
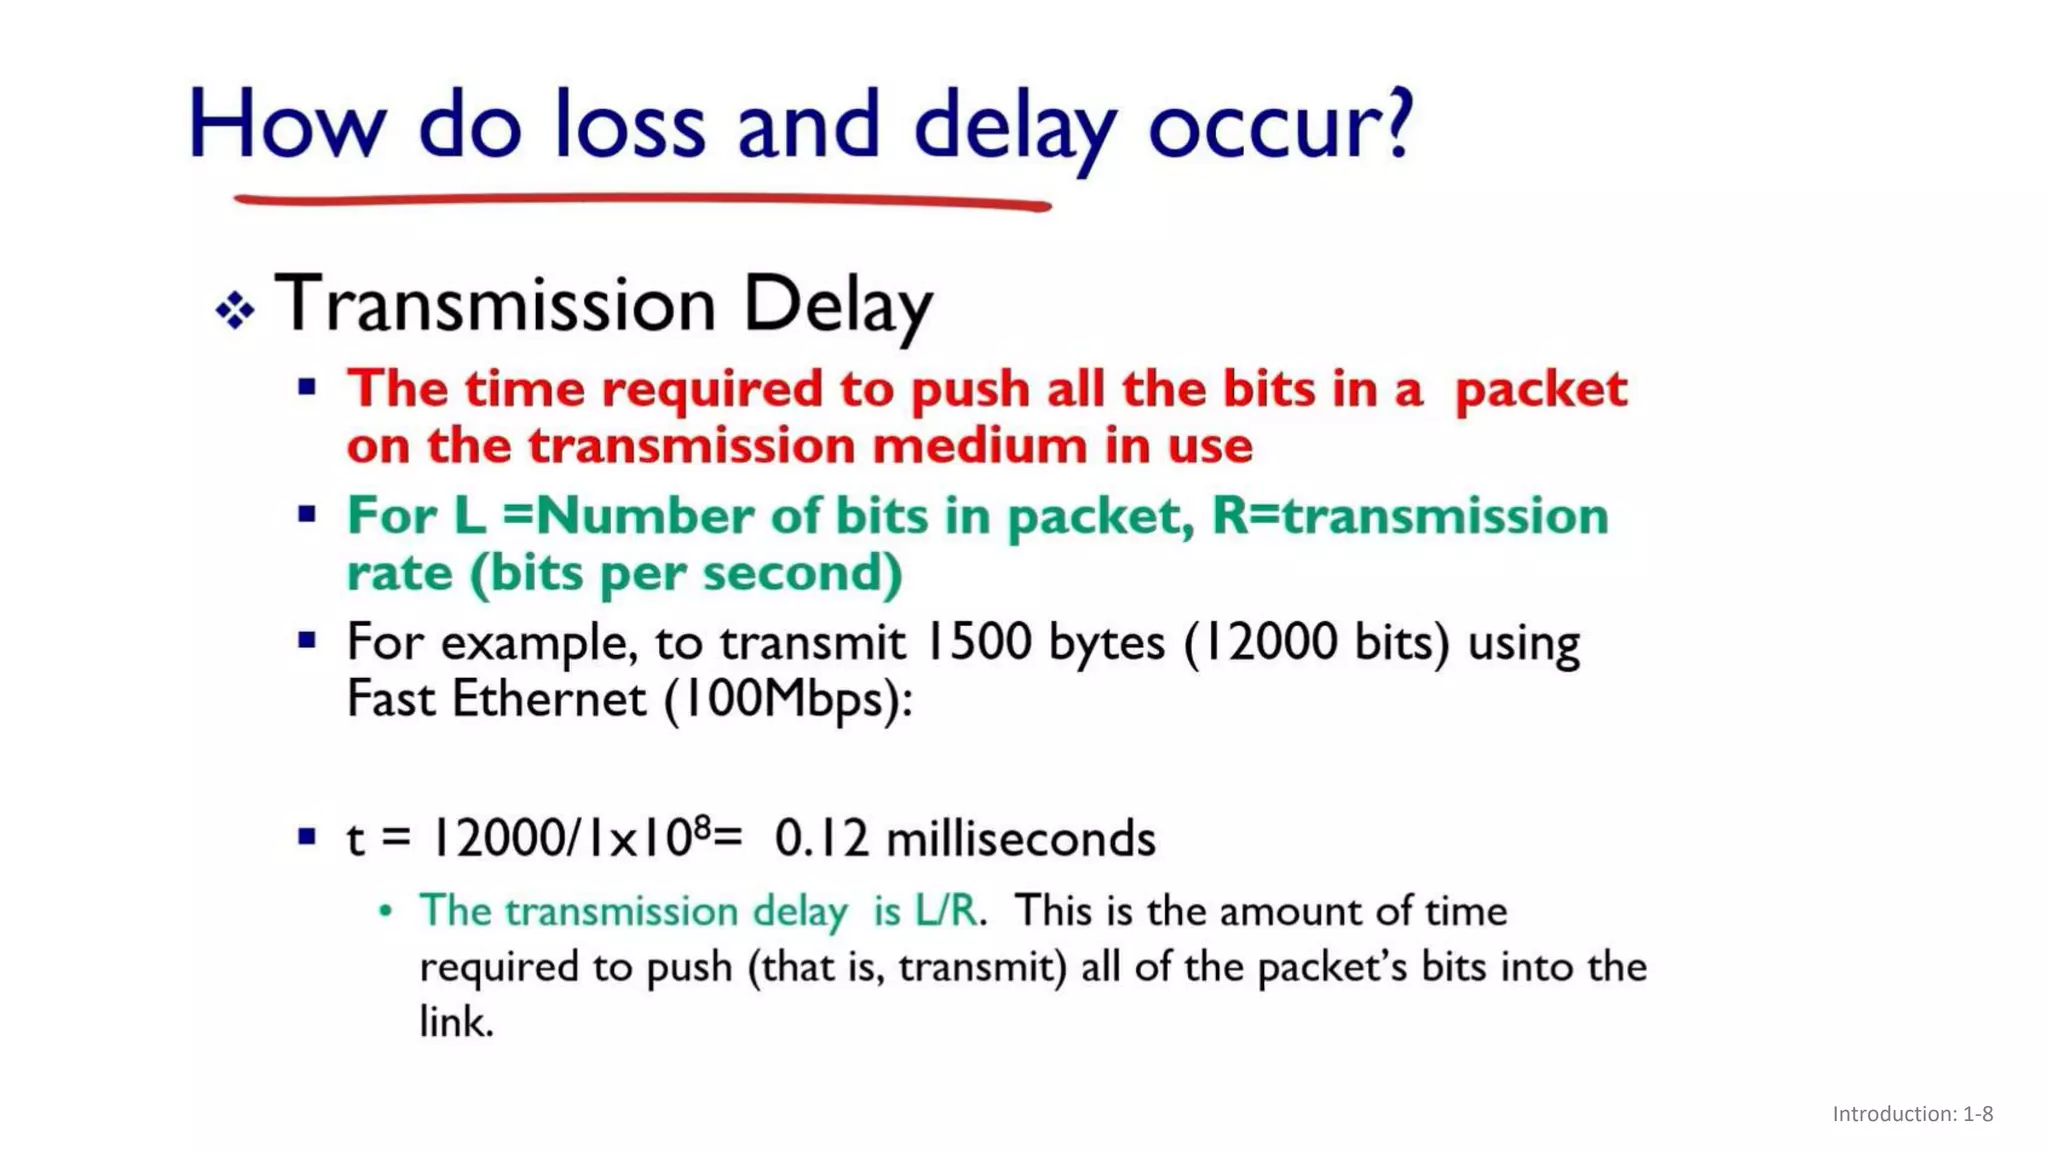
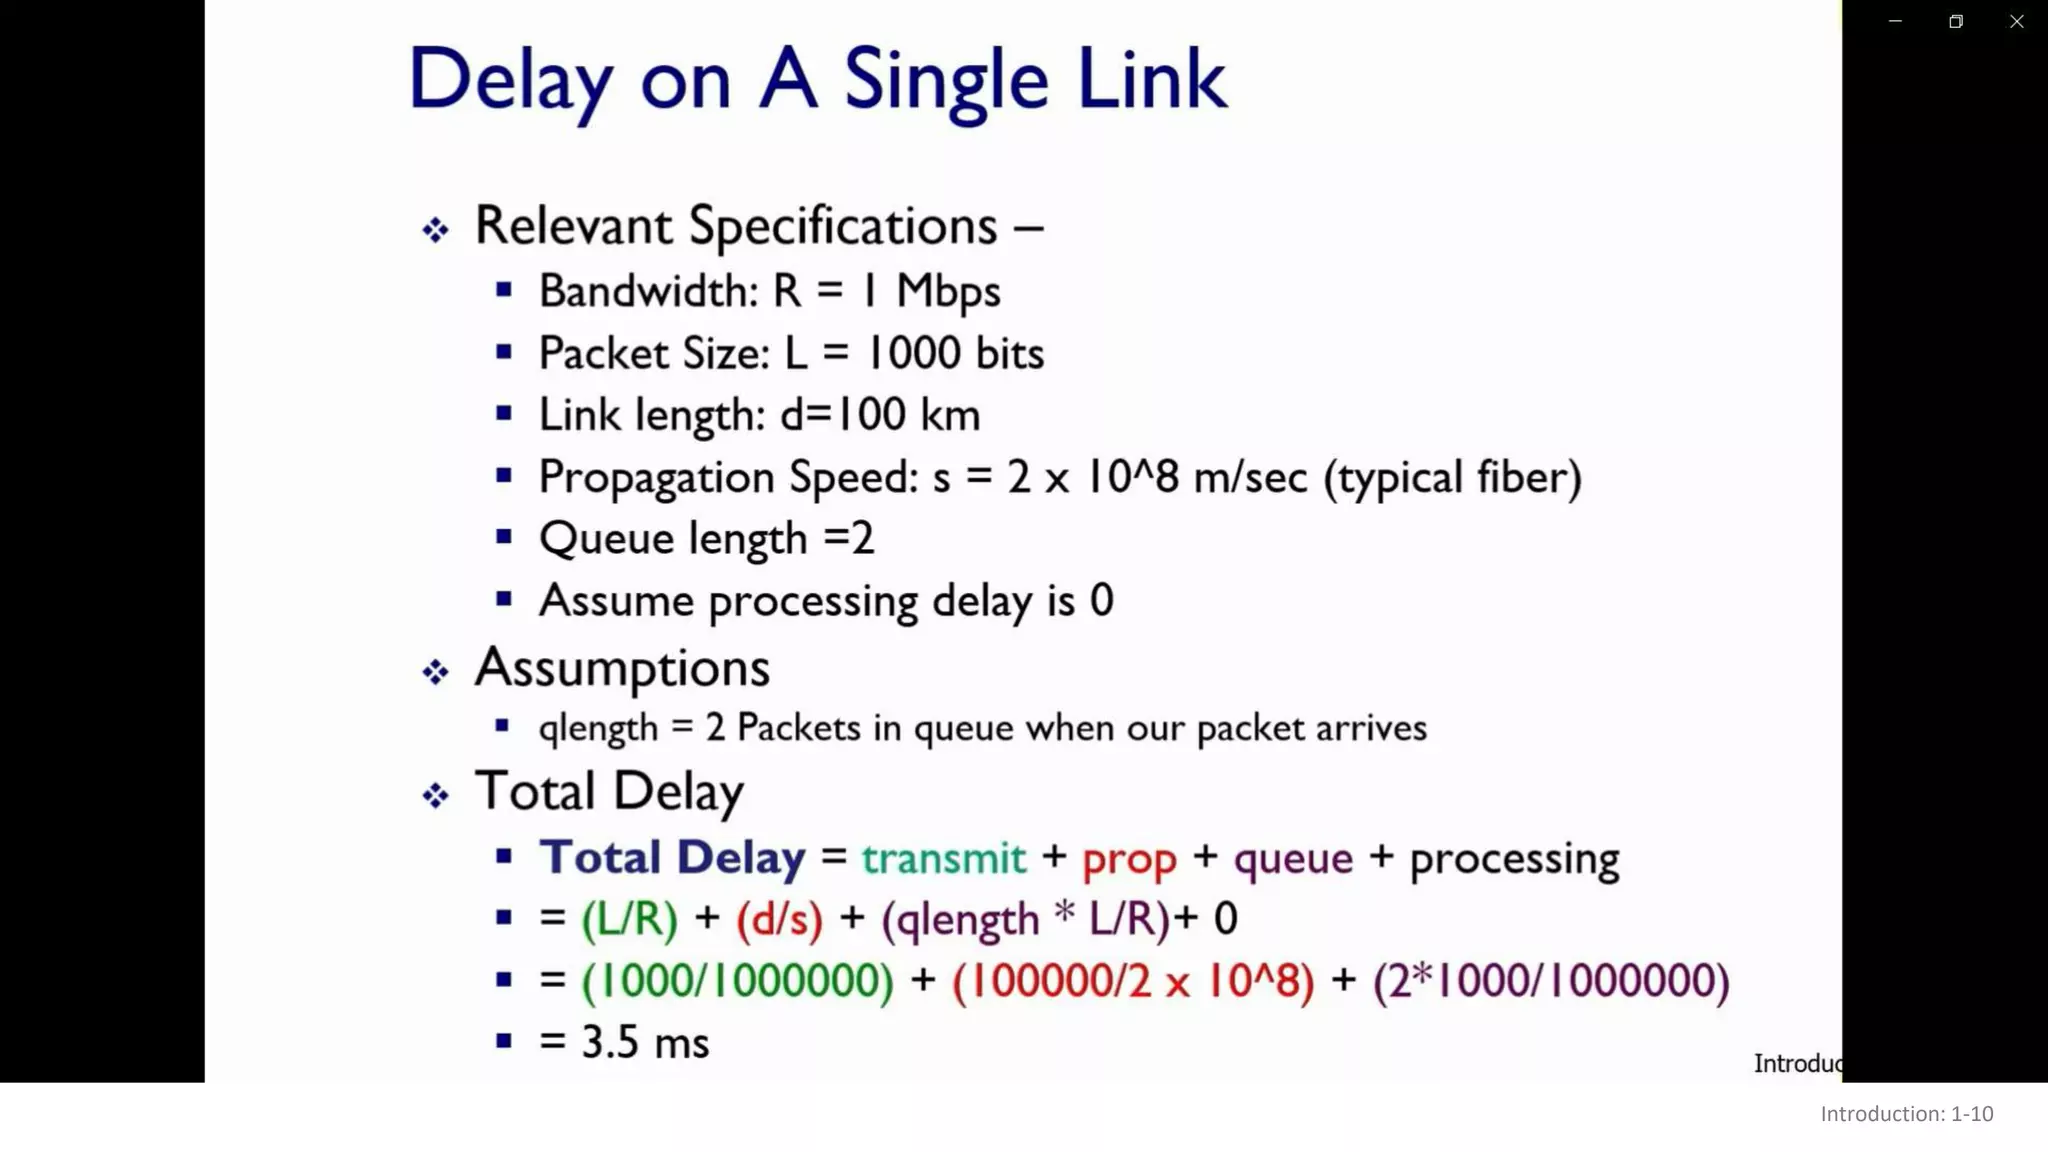
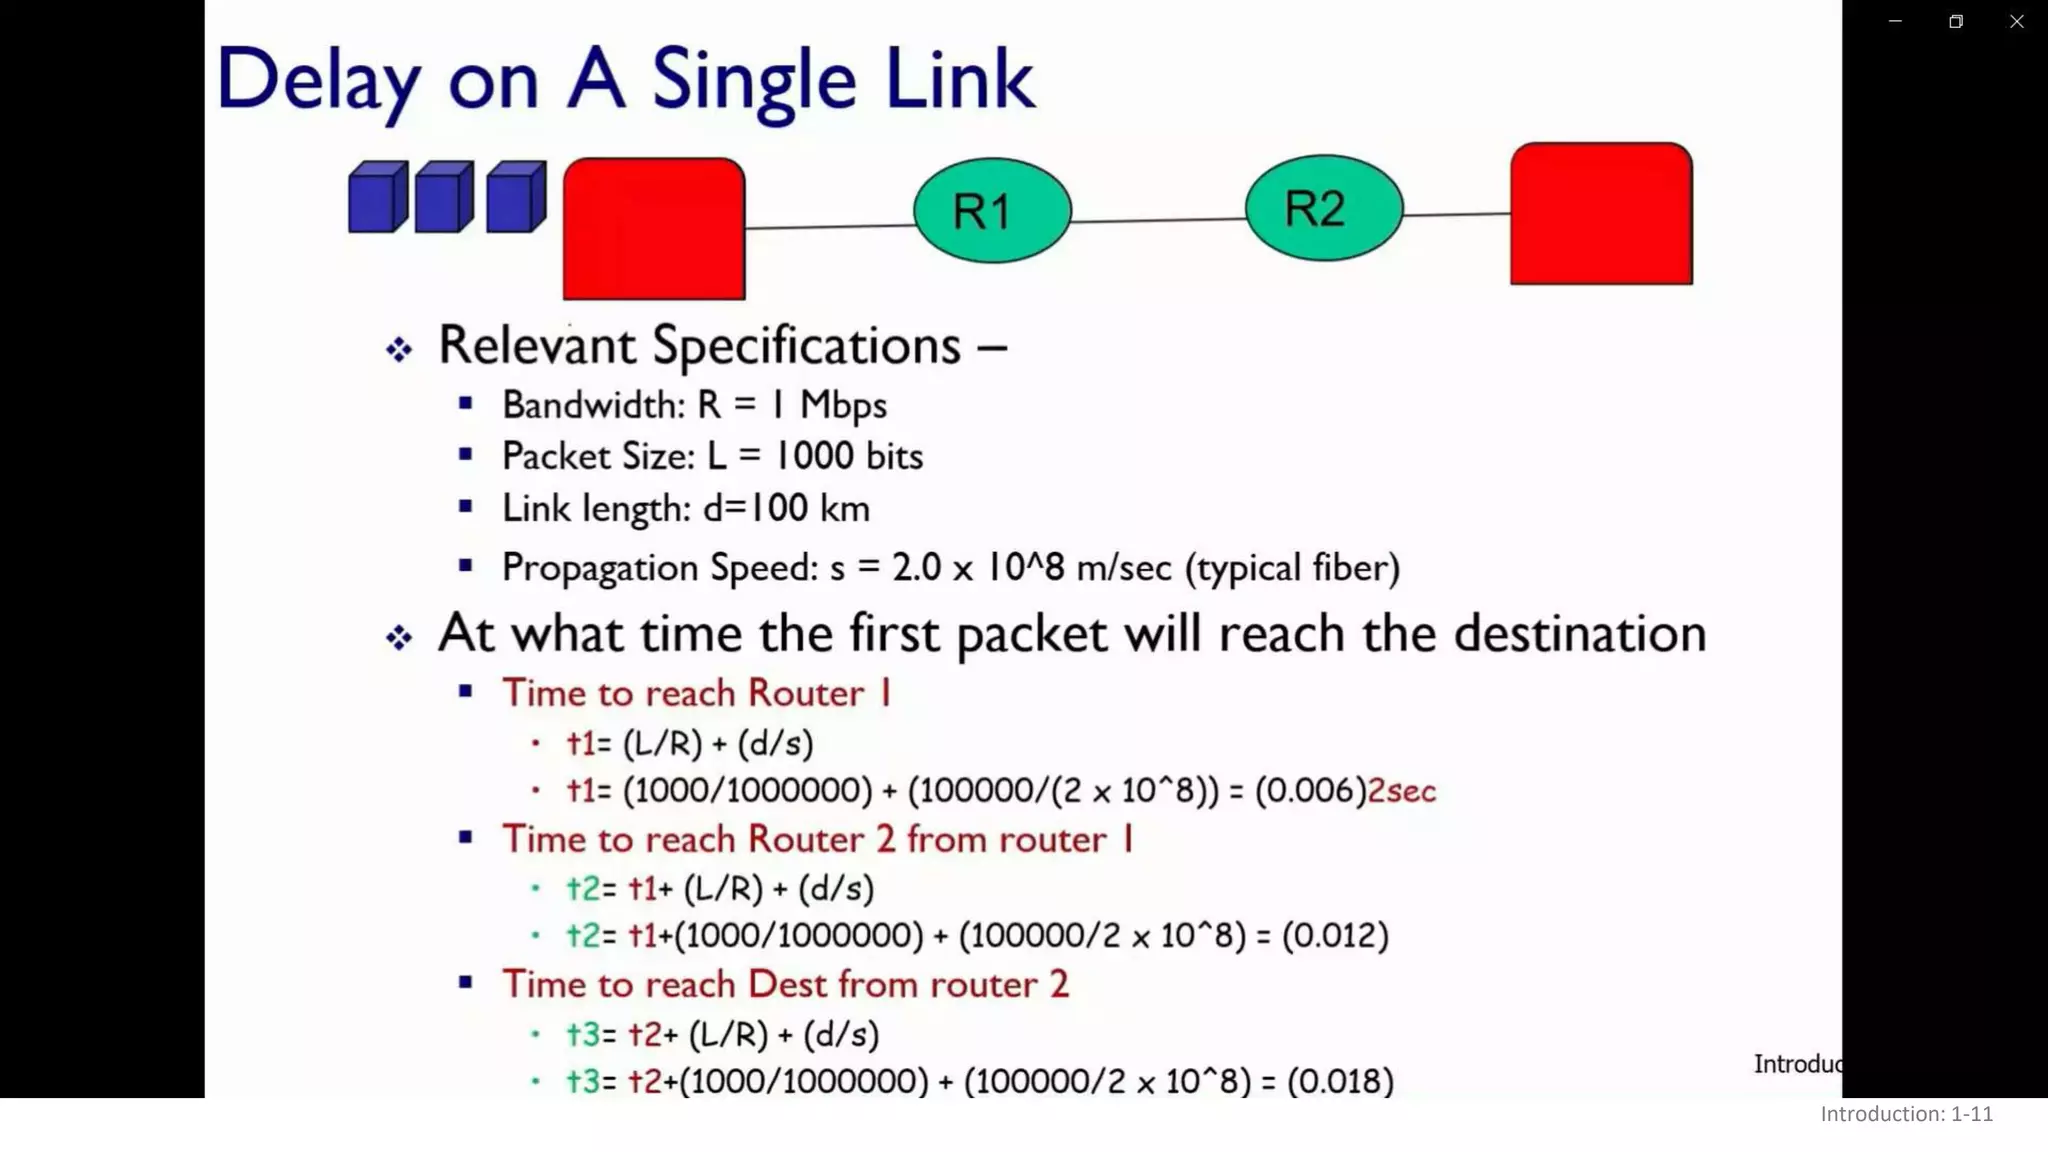
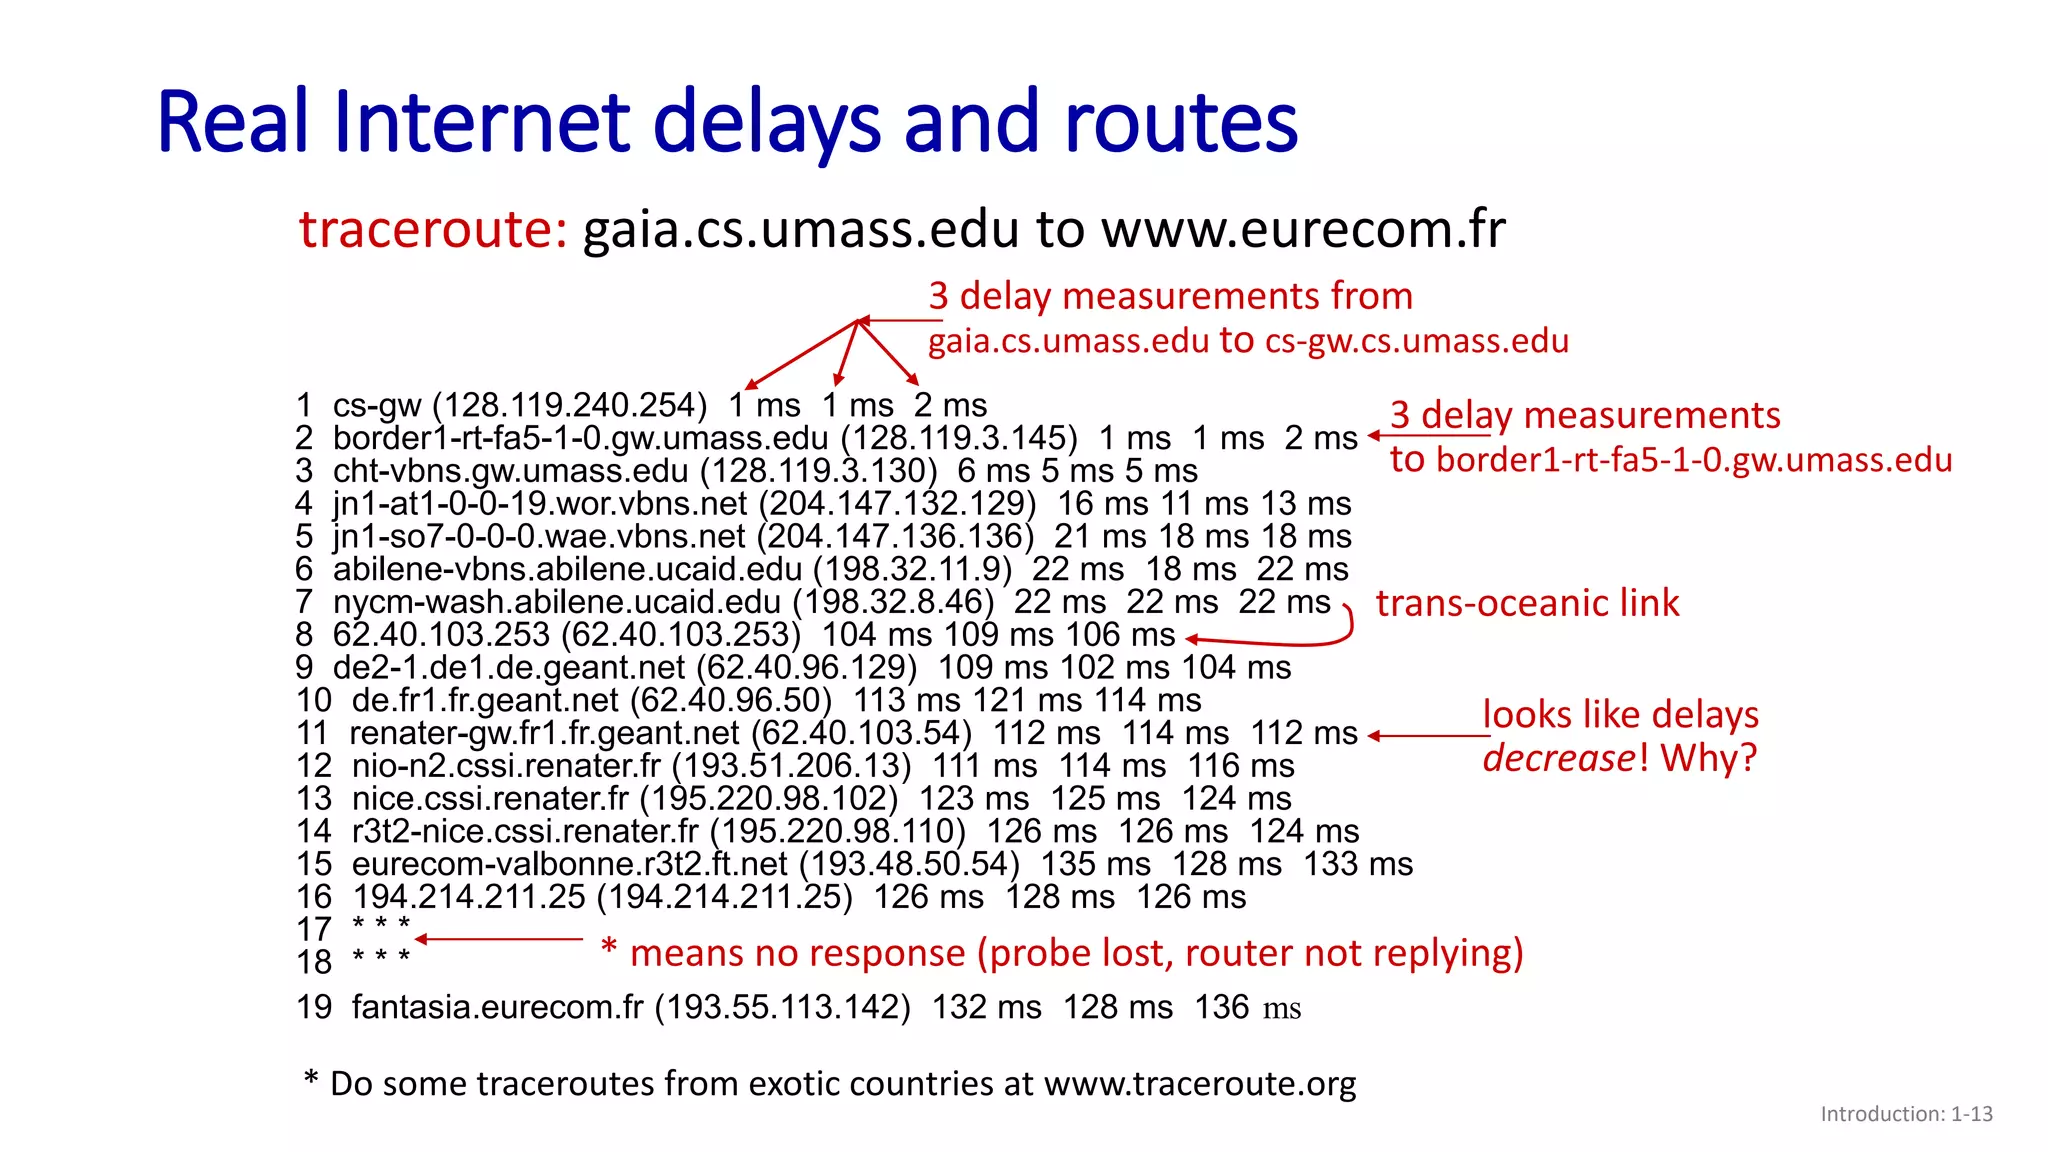
- The four main sources of packet delay: processing, queueing, transmission, and propagation;
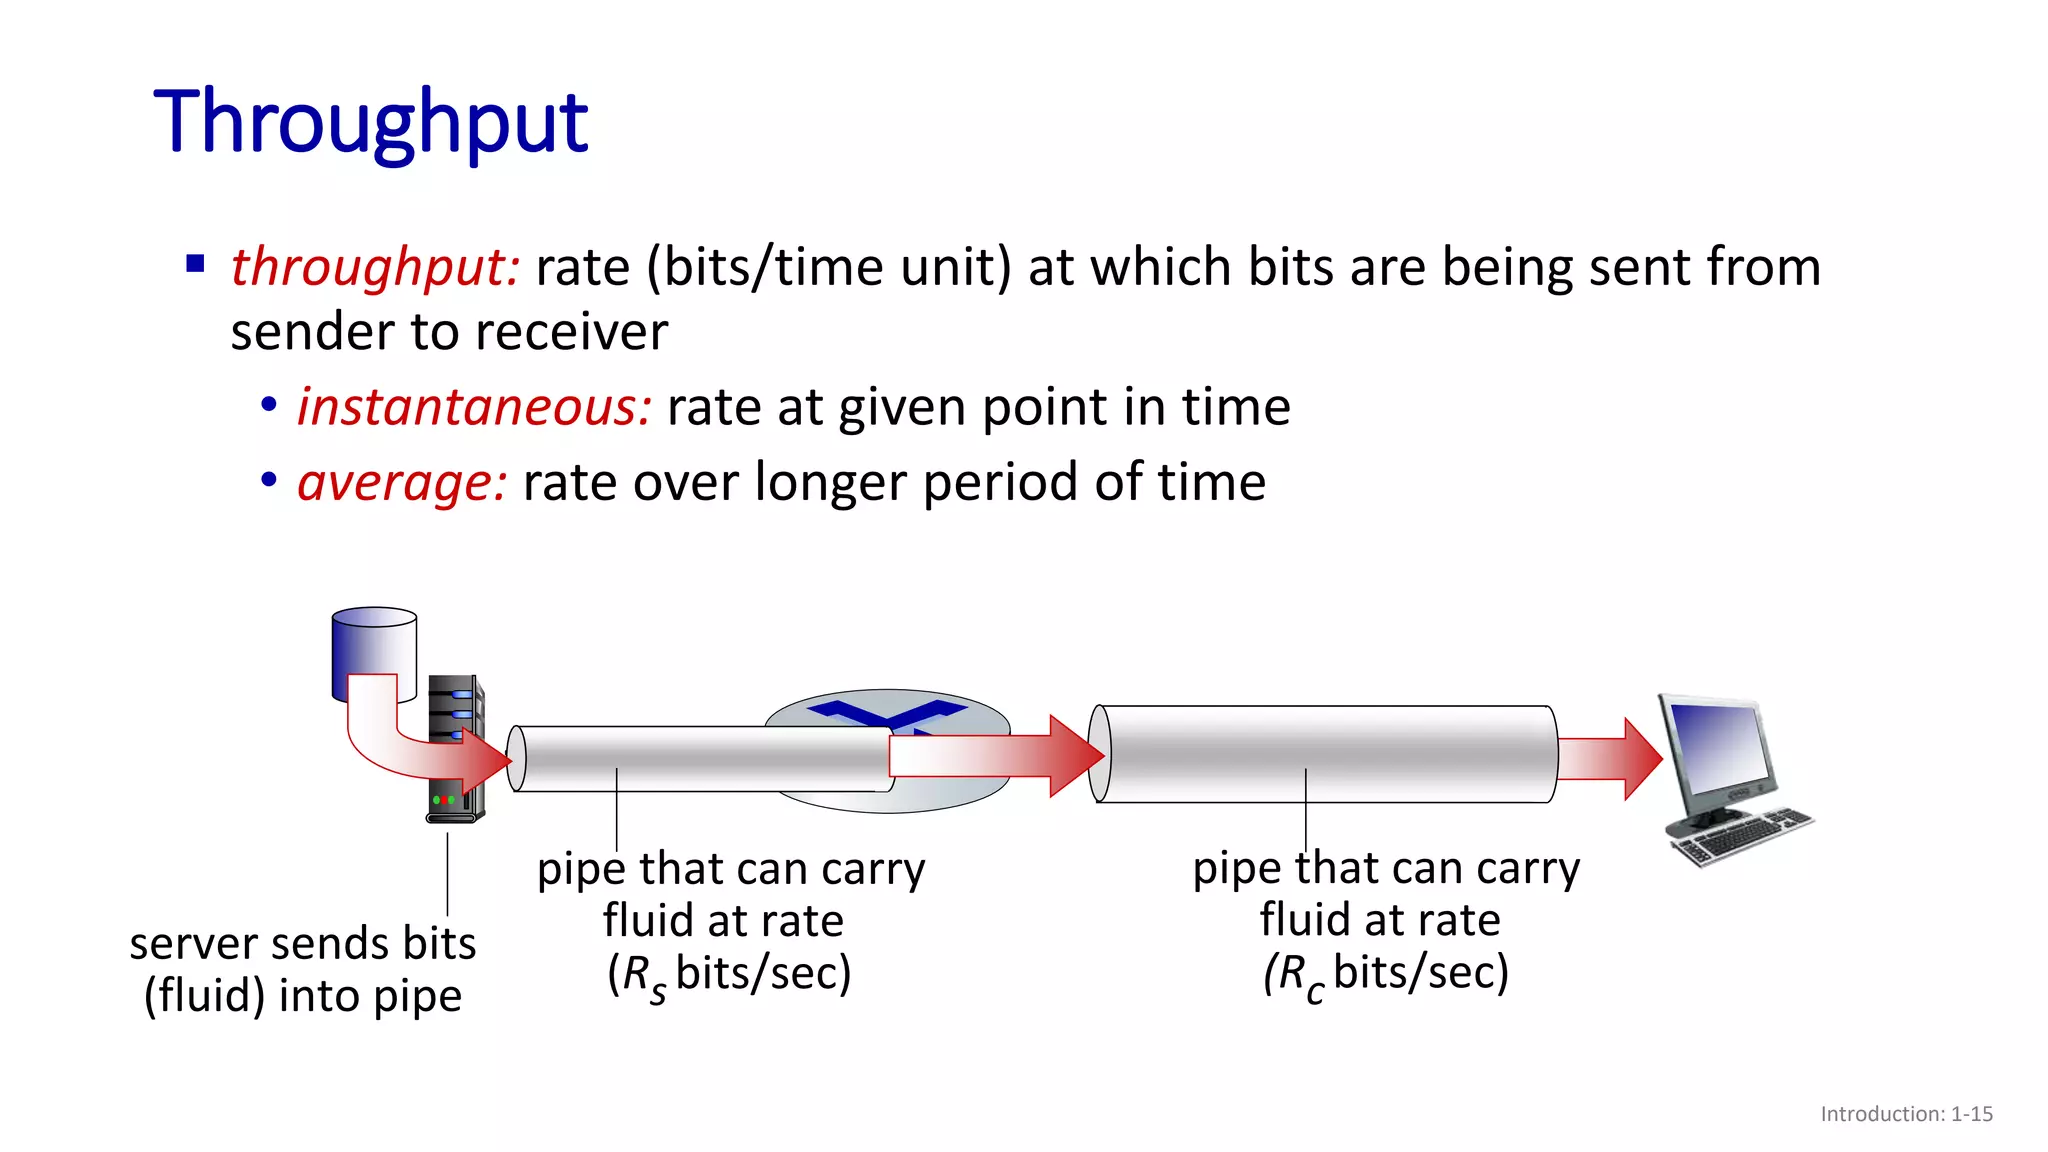
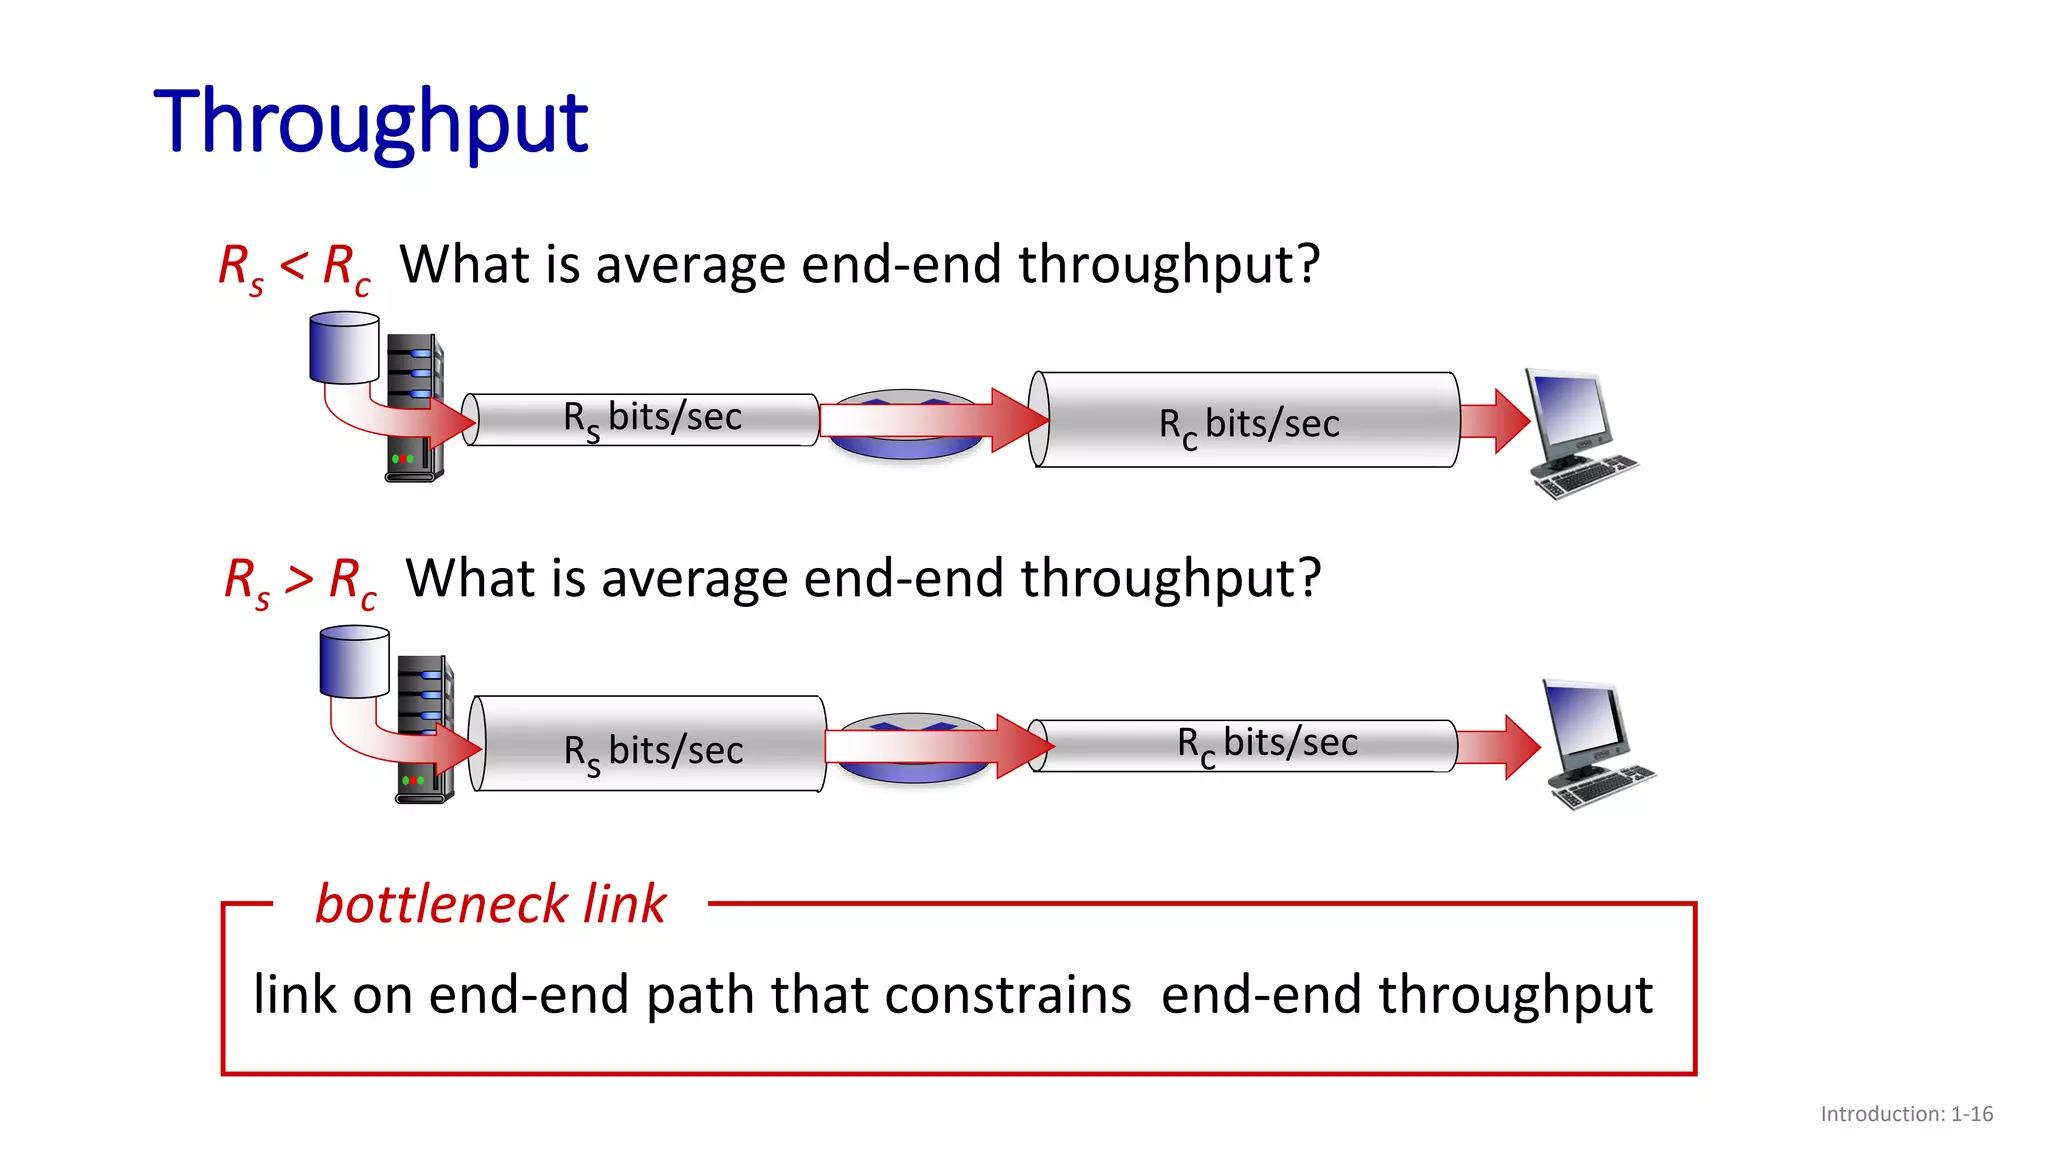
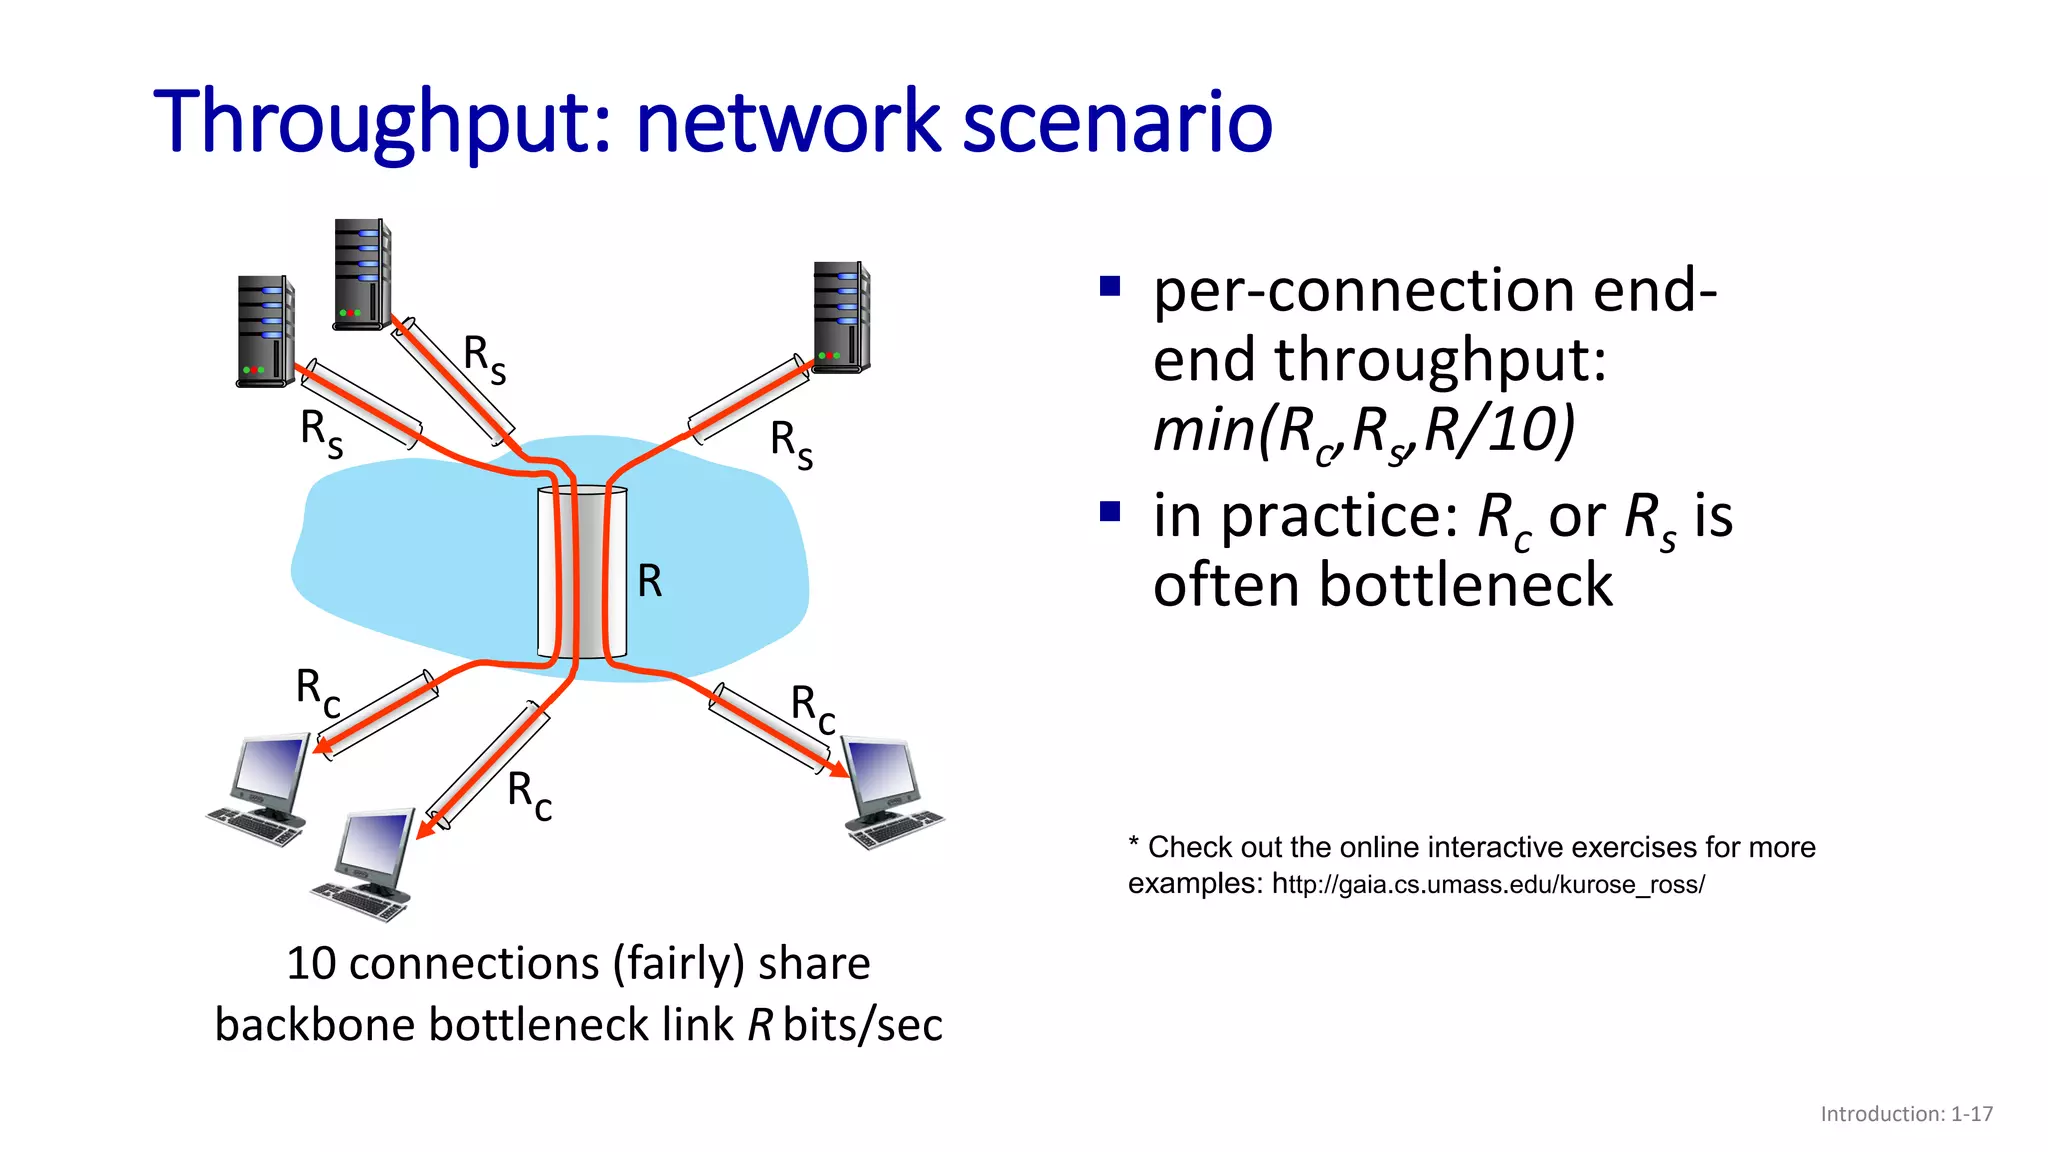
- How throughput is determined by the minimum of the sender and receiver rates or any bottleneck link rate;
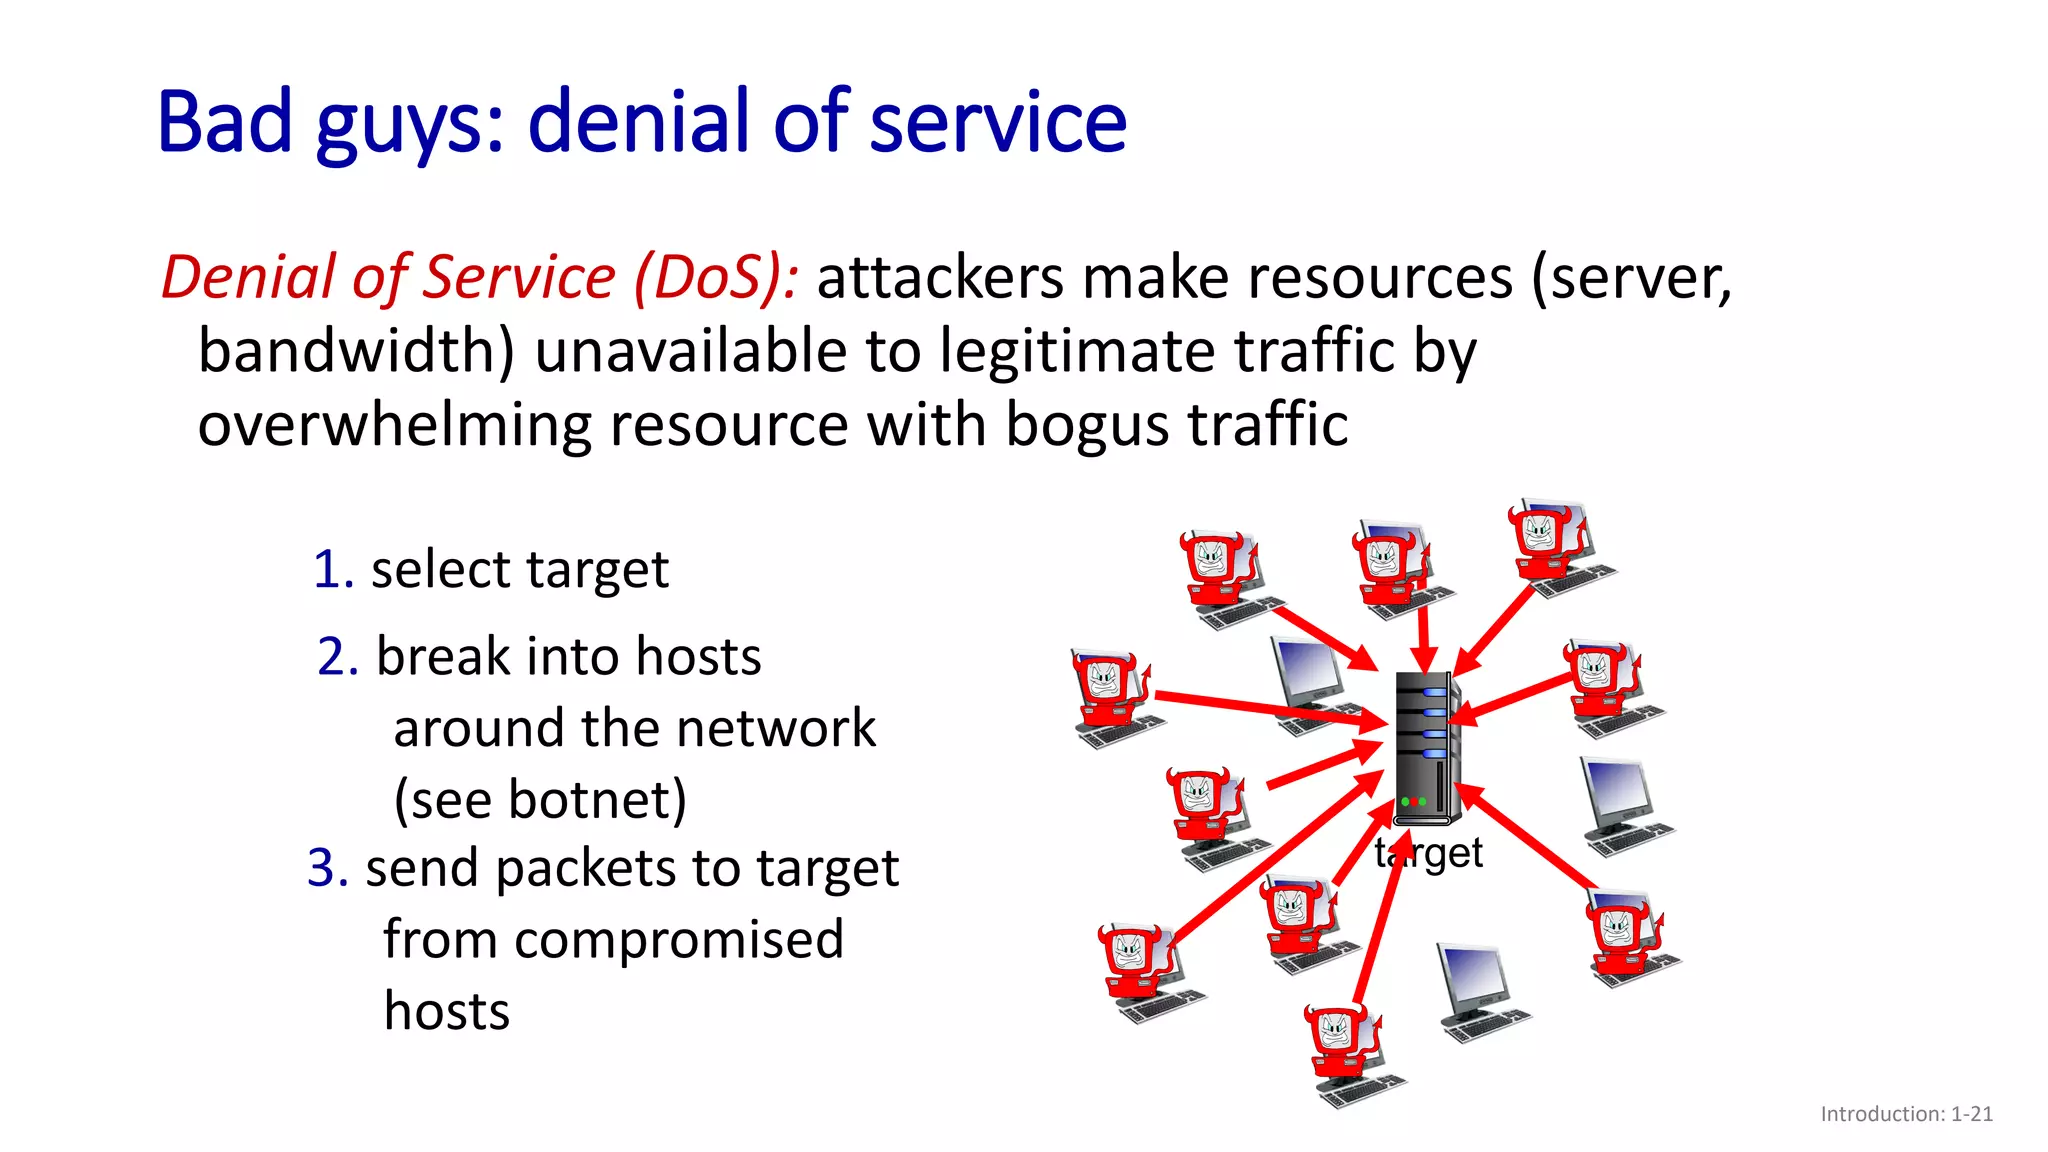
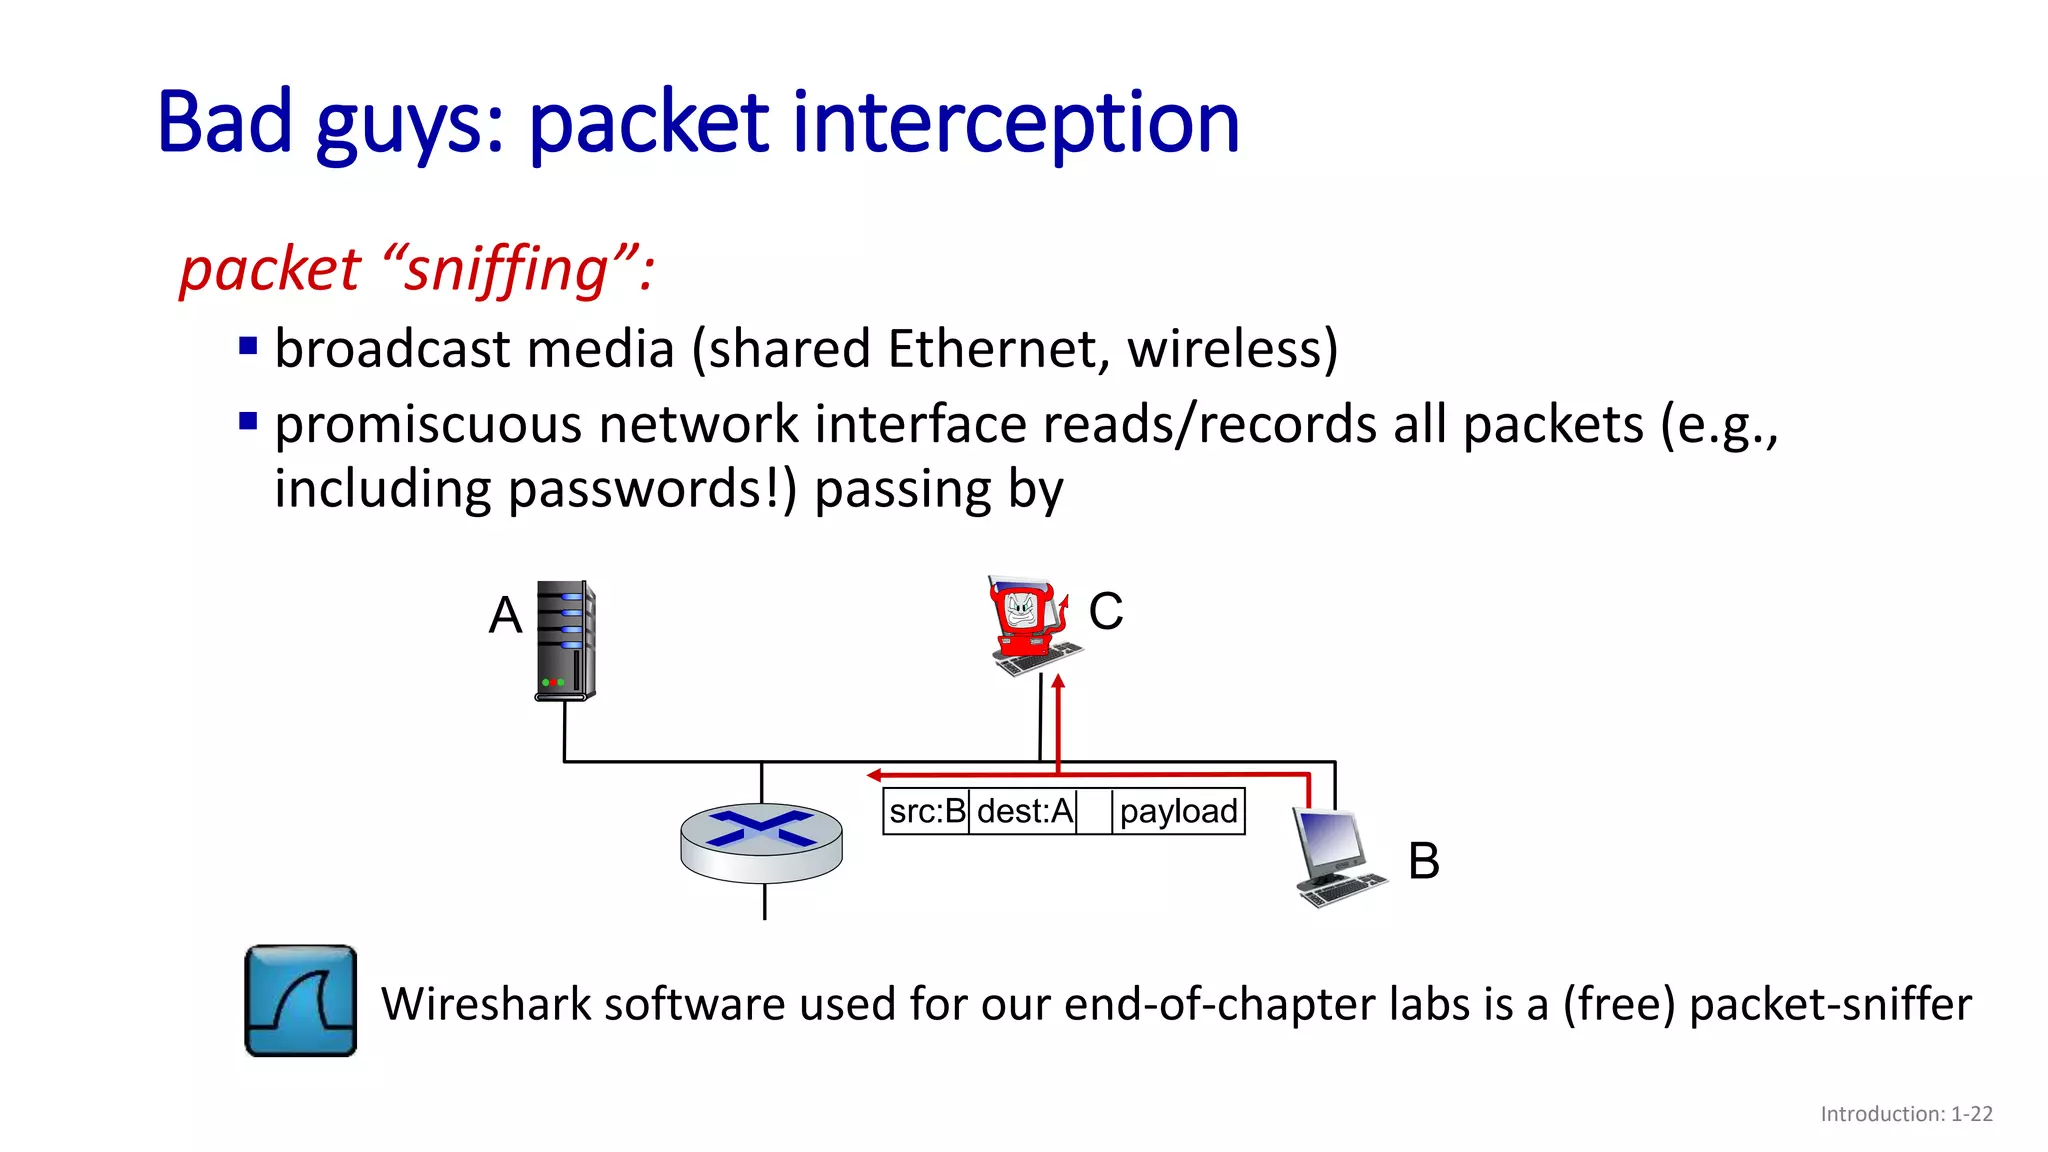
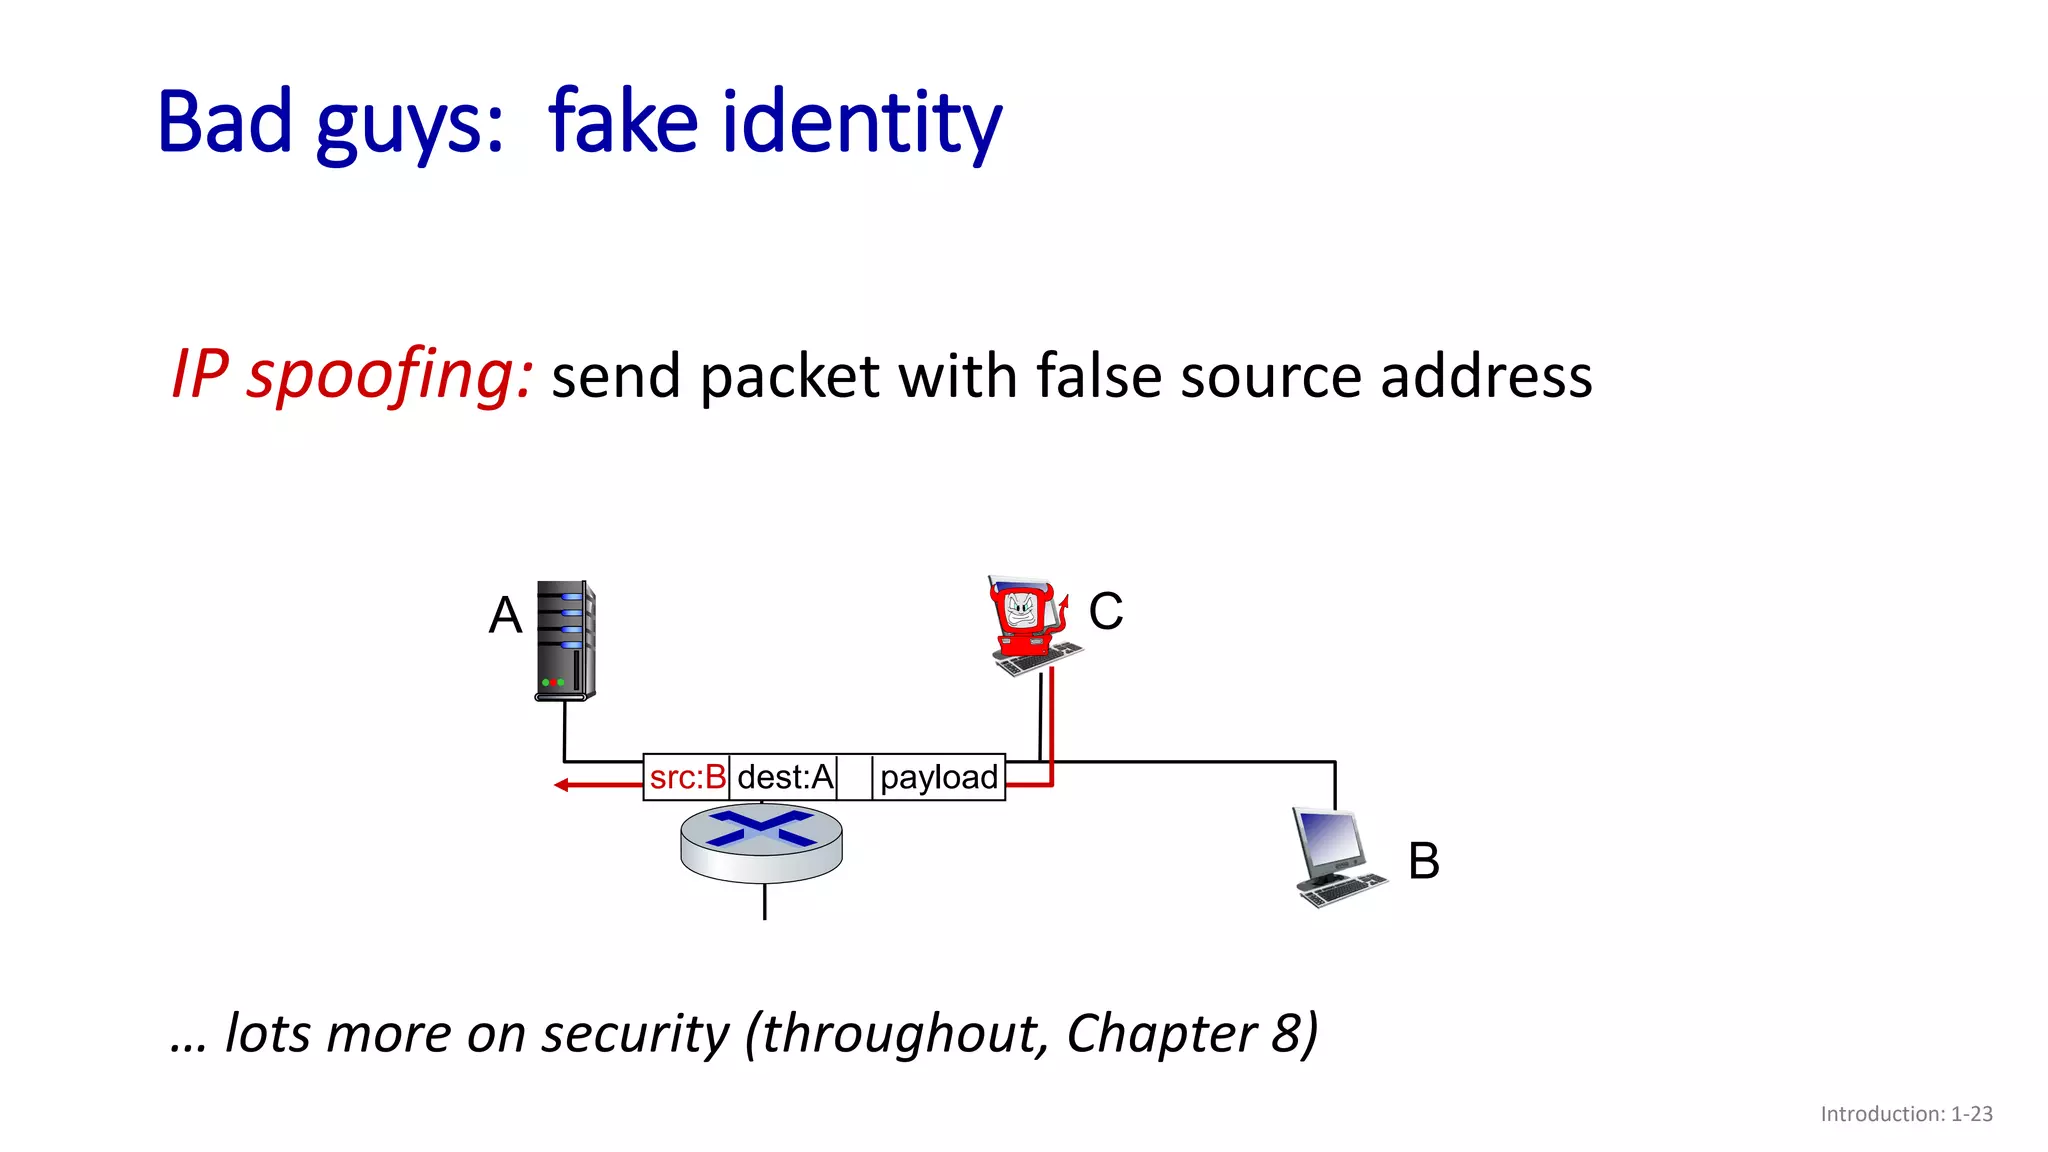
- Examples of security issues like denial of service attacks, packet interception, and IP spoofing;
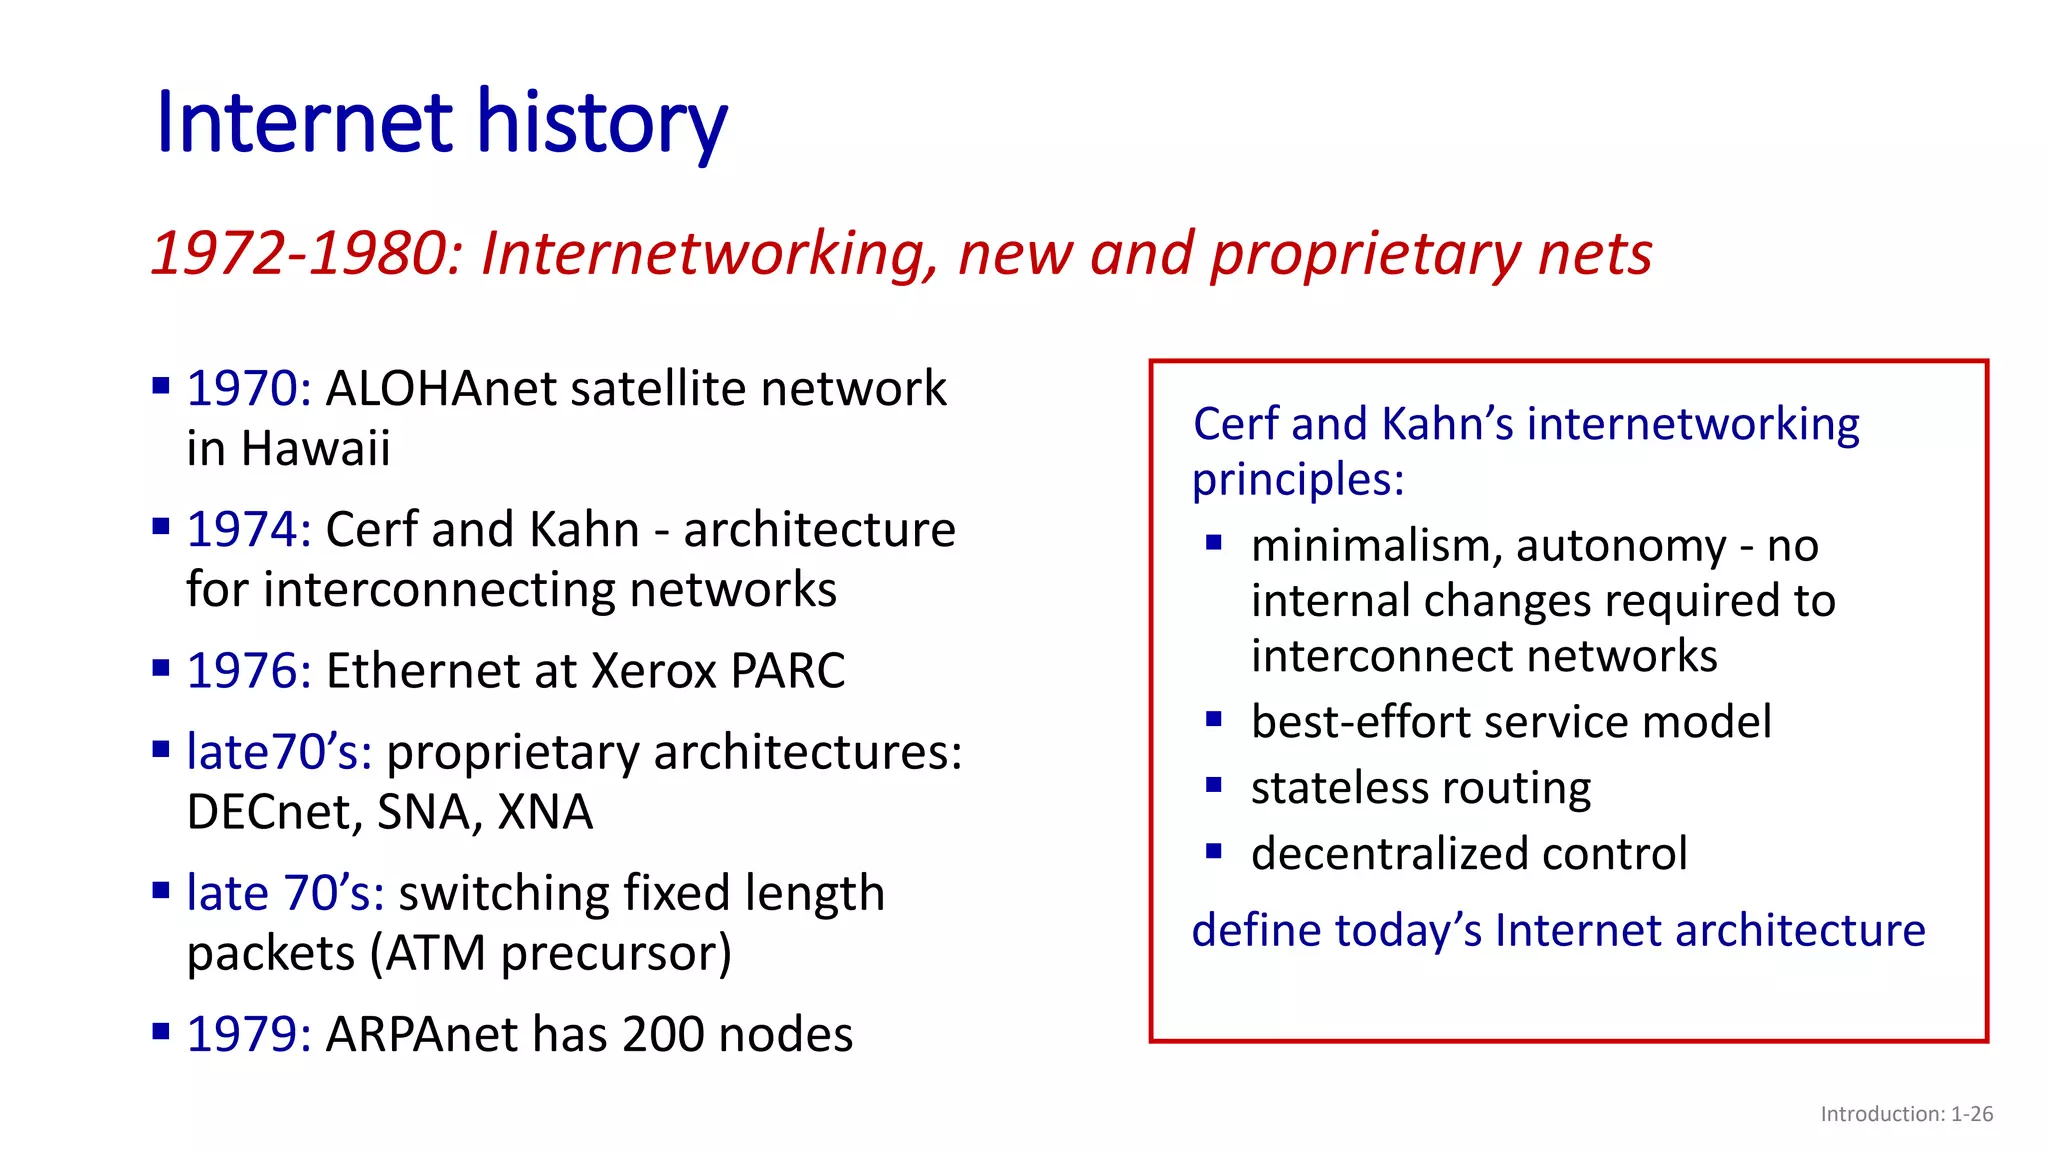
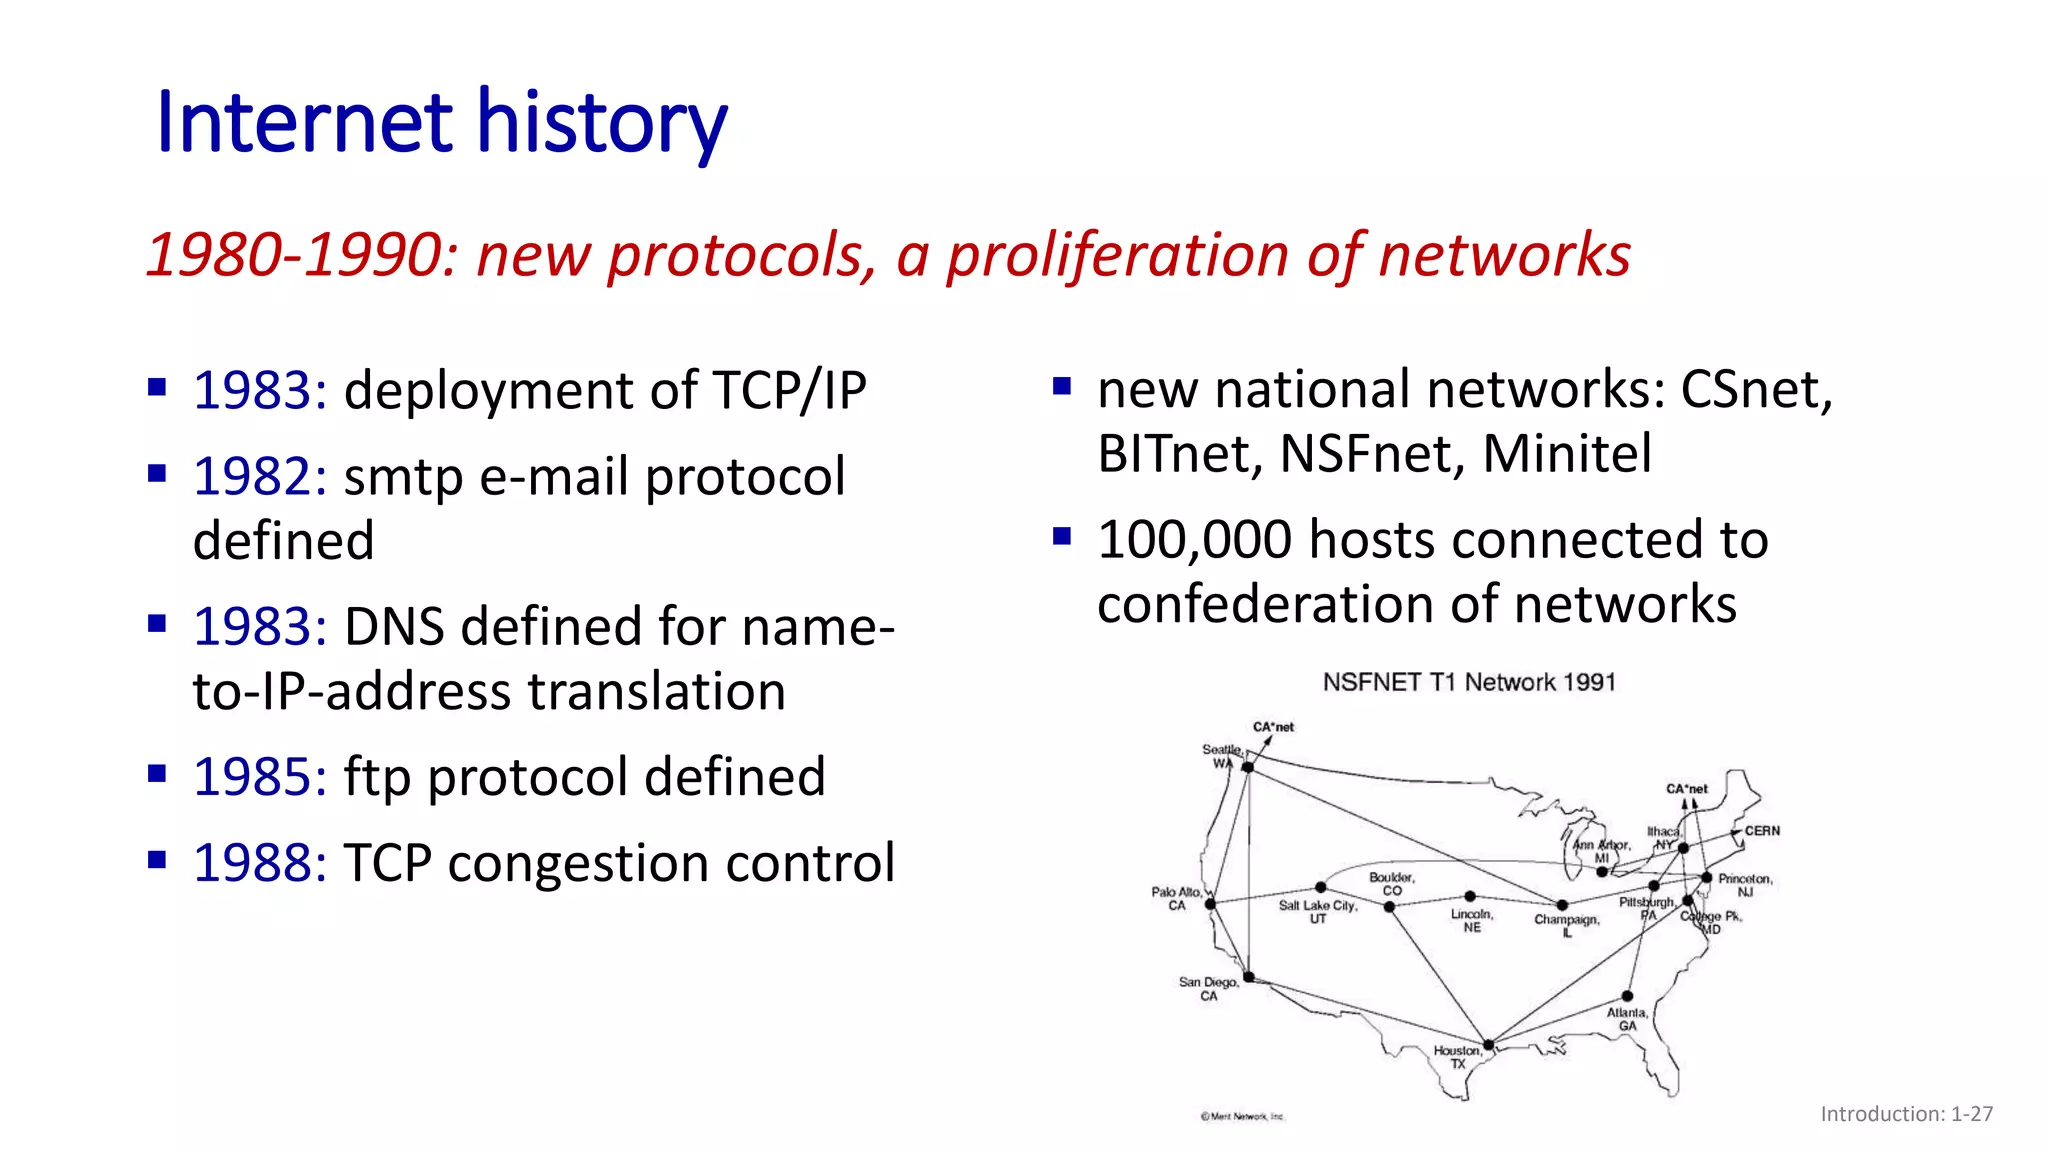
- A brief history of the development of the Internet from the 1960s to the present.


![Internet history
Introduction: 1-28
early 1990s: ARPAnet
decommissioned
1991: NSF lifts restrictions on
commercial use of NSFnet
(decommissioned, 1995)
early 1990s: Web
• hypertext [Bush 1945, Nelson 1960’s]
• HTML, HTTP: Berners-Lee
• 1994: Mosaic, later Netscape
• late 1990s: commercialization of the
Web
late 1990s – 2000s:
more killer apps: instant
messaging, P2P file sharing
network security to forefront
est. 50 million host, 100 million+
users
backbone links running at Gbps
1990, 2000s: commercialization, the Web, new applications](https://image.slidesharecdn.com/lecture06and07-221130155950-5347d13f/75/Lecture-06-and-07-pptx-28-2048.jpg)


![Vibe Coding vs. Spec-Driven Development [Free Meetup]](https://cdn.slidesharecdn.com/ss_thumbnails/vibecodingvsspecdrivendevelopment-251209105622-43f455e7-thumbnail.jpg?width=640&height=640&fit=bounds)
![Coded Agents – with UiPath SDK + LangGraph [Virtual Hands-on Workshop]](https://cdn.slidesharecdn.com/ss_thumbnails/codedagentsdeck-251215155422-5497c599-thumbnail.jpg?width=640&height=640&fit=bounds)


