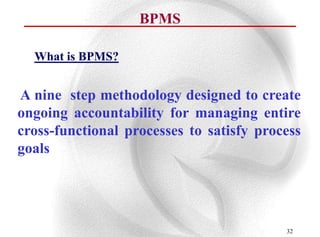
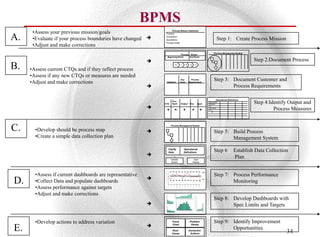
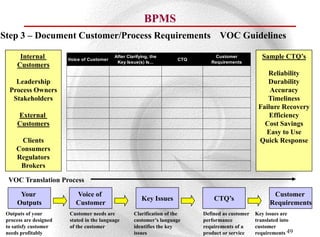
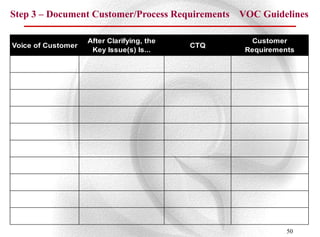
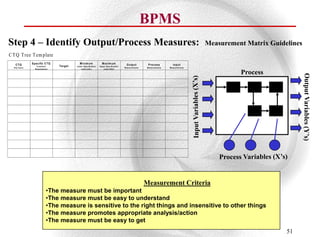
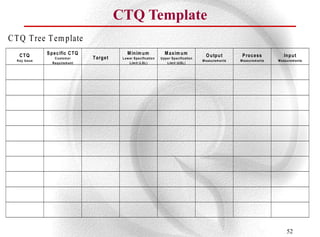
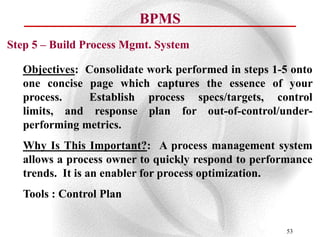
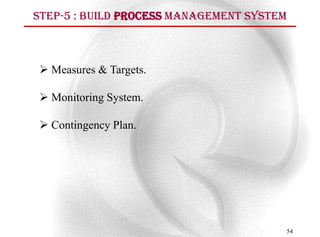
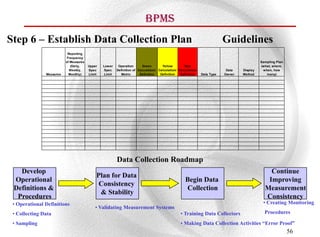
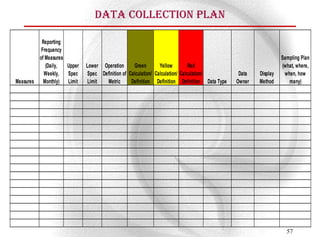
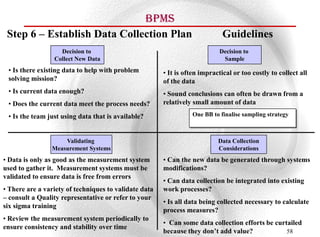
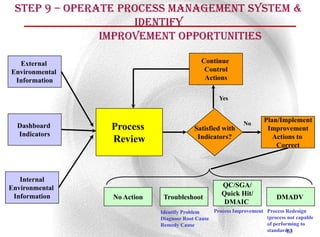
The BPMS (Business Process Management System) is a 9-step methodology to optimize process performance and establish value-added metrics. The steps include: 1) creating a process mission statement, 2) documenting the process, 3) identifying outputs and measures, 4) building a process map, 5) establishing a management system, 6) creating a data collection plan, and 7) ongoing performance monitoring. The goal is to create ongoing accountability for managing cross-functional processes to satisfy goals.


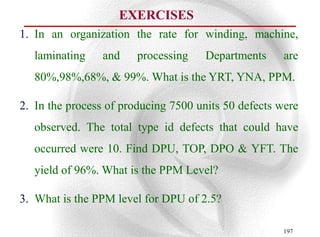
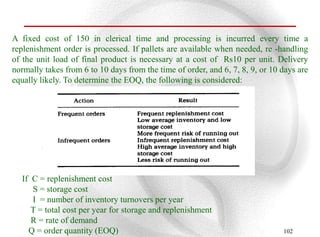
![Leadership Vision
• “Quality . . . is the next opportunity for our Company to
set itself apart from its competitors . . .
... Dramatically improved Quality will increase employee
and customer satisfaction, will improve share and
profitability, and will enhance our reputation.
... “[Six Sigma] is the most important training
thing we have ever had. It’s better than going
to Harvard Business School.”
J.F. Welch
26](https://image.slidesharecdn.com/lean-manufacturing-and-six-sigma-100218051625-phpapp01/85/Lean-Manufacturing-And-Six-Sigma-26-320.jpg)


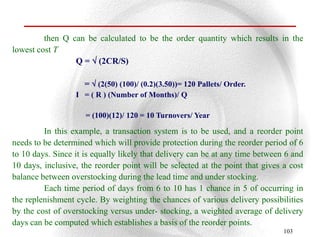
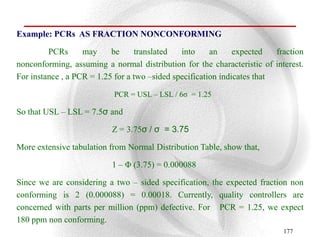
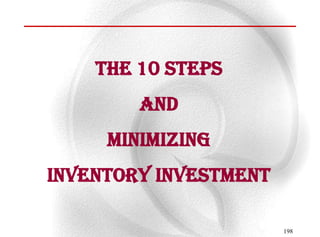
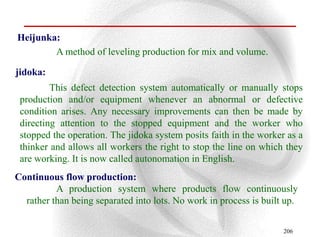
![In this example it may be computed as follows:
Number of items demanded per day = 100/20* = 5 .
*20 days assumes a 5-day workweek
Average cost of overstocking = (5)( 3.50)(1/5)(x- 5)
where x = delivery period between 6 to 10 days
Average cost of under stocking =(10 X 1/5)[10-(x -5)]
Solving for x as the point where the weighted-average overstocking
cost equals the weighted-average under stocking cost:
(5)(3.50)(1/5)(x- 5) = (10)(1/5)(10 -x)
3.5x- 17.5 = 20 -2x
5.5x = 37.5
x= 6.8
104](https://image.slidesharecdn.com/lean-manufacturing-and-six-sigma-100218051625-phpapp01/85/Lean-Manufacturing-And-Six-Sigma-104-320.jpg)