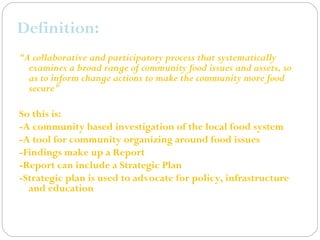
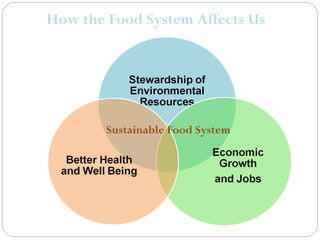
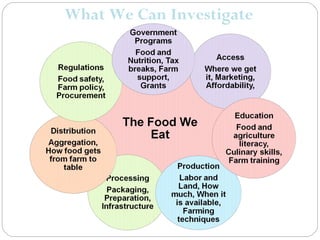
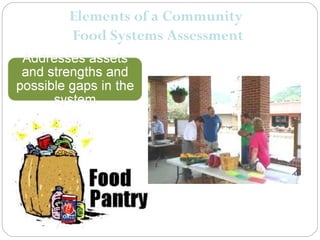
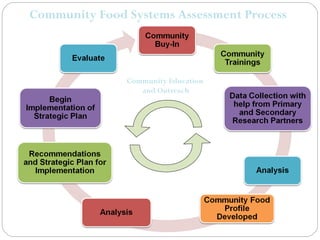
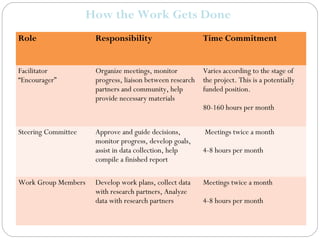
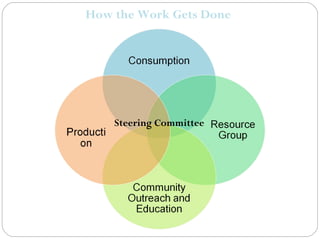
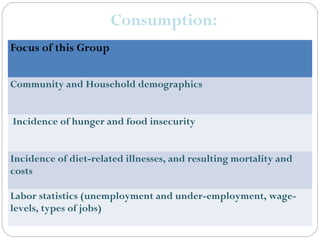
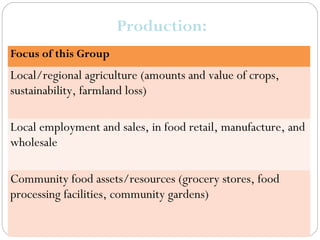
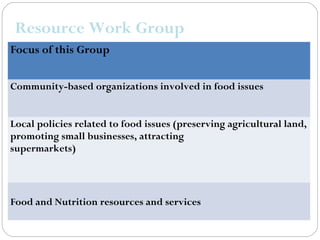
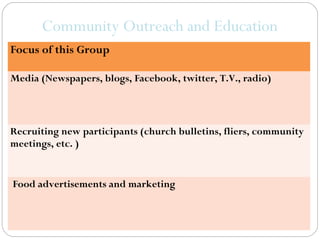
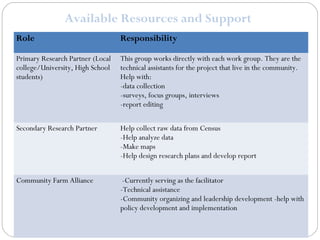
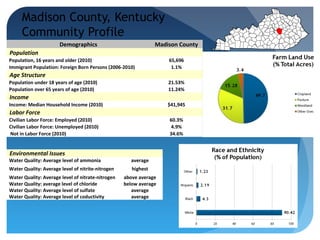
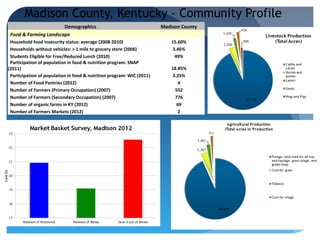
Community Food Systems Assessments

      Community Leadership Training
              Berea, KY
Definition:
“A collaborative and participatory process that systematically
  examines a broad range of community food issues and assets, so
  as to inform change actions to make the community more food
  secure"

So this is:
-A community based investigation of the local food system
-A tool for community organizing around food issues
-Findings make up a Report
-Report can include a Strategic Plan
-Strategic plan is used to advocate for policy, infrastructure
  and education
How the Food System Affects Us


        Sustainable Food System
What We Can Investigate
Elements of a Community
Food Systems Assessment
Community Food Systems Assessment Process


               Community Education
                  and Outreach
How the Work Gets Done
Role                  Responsibility                       Time Commitment


Facilitator           Organize meetings, monitor           Varies according to the stage of
“Encourager”          progress, liaison between research   the project. This is a potentially
                      partners and community, help         funded position.
                      provide necessary materials
                                                           80-160 hours per month


Steering Committee    Approve and guide decisions,         Meetings twice a month
                      monitor progress, develop goals,
                      assist in data collection, help      4-8 hours per month
                      compile a finished report

Work Group Members    Develop work plans, collect data     Meetings twice a month
                      with research partners, Analyze
                      data with research partners          4-8 hours per month
How the Work Gets Done


    Steering Committee
Consumption:
Focus of this Group


Community and Household demographics


Incidence of hunger and food insecurity


Incidence of diet-related illnesses, and resulting mortality and
costs

Labor statistics (unemployment and under-employment, wage-
levels, types of jobs)
Production:
Focus of this Group
Local/regional agriculture (amounts and value of crops,
sustainability, farmland loss)

Local employment and sales, in food retail, manufacture, and
wholesale

Community food assets/resources (grocery stores, food
processing facilities, community gardens)
Resource Work Group
Focus of this Group


Community-based organizations involved in food issues


Local policies related to food issues (preserving agricultural land,
promoting small businesses, attracting
supermarkets)


Food and Nutrition resources and services
Community Outreach and Education
Focus of this Group

Media (Newspapers, blogs, Facebook, twitter, T.V., radio)


Recruiting new participants (church bulletins, fliers, community
meetings, etc. )


Food advertisements and marketing
The Importance of a Timeline
•Allows research partners to plan for their
semester course work
•Sets an overall goal for the group
•Provides deadlines for work group tasks
•Informs the broad community of progress
•Developing a timeline allows work groups to
prioritize for seasonal activities, community
events and deadlines
Available Resources and Support
Role                              Responsibility

Primary Research Partner (Local   This group works directly with each work group. They are the
college/University, High School   technical assistants for the project that live in the community.
students)                         Help with:
                                  -data collection
                                  -surveys, focus groups, interviews
                                  -report editing

Secondary Research Partner        Help collect raw data from Census
                                  -Help analyze data
                                  -Make maps
                                  -Help design research plans and develop report


Community Farm Alliance            -Currently serving as the facilitator
                                  -Technical assistance
                                  -Community organizing and leadership development -help with
                                  policy development and implementation
Madison County, Kentucky
     Community Profile
                       Demographics                             Madison County
Population
Population, 16 years and older (2010)                               65,696
Immigrant Population: Foreign Born Persons (2006-2010)               1.1%
Age Structure
Population under 18 years of age (2010)                             21.53%
Population over 65 years of age (2010)                              11.24%
Income
Income: Median Household Income (2010)                              $41,945
Labor Force
Civilian Labor Force: Employed (2010)                               60.3%
Civilian Labor Force: Unemployed (2010)                              4.9%
Not in Labor Force (2010)                                           34.6%


Environmental Issues
Water Quality: Average level of ammonia              average
Water Quality: Average level of nitrite-nitrogen      highest
Water Quality: Average level of nitrate-nitrogen   above average
Water Quality: average level of chloride           below average
Water Quality: Average level of sulfate               average
Water Quality: Average level of coductivity           average
Madison County, Kentucky - Community Profile
                       Demographics                                    Madison County
 Food & Farming Landscape
 Household food insecurity status: average (2008-2010)                     15.60%
 Households without vehicles: > 1 mile to grocery store (2006)              3.46%
 Students Eligible for Free/Reduced Lunch (2010)                             49%
 Participation of population in food & nutrition program: SNAP
(2011)                                                                     18.85%
 Participation of population in food & nutrition program: WIC (2011)        3.25%
 Number of Food Pantries (2012)                                               4
 Number of Farmers (Primary Occupation) (2007)                               552
 Number of Farmers (Secondary Occupation) (2007)                             776
 Number of organic farms in KY (2012)                                         69
 Number of Farmers Markets (2012)                                             2
The End

            Contact us!
Heather Hyden: Heather@cfaky.org
 Alexa Arnold: Alexa@cfaky.org
    Office Phone: 502-223-3655

Leadership Training Berea, Ky

  • 1.
    Community Food SystemsAssessments Community Leadership Training Berea, KY
  • 3.
    Definition: “A collaborative andparticipatory process that systematically examines a broad range of community food issues and assets, so as to inform change actions to make the community more food secure" So this is: -A community based investigation of the local food system -A tool for community organizing around food issues -Findings make up a Report -Report can include a Strategic Plan -Strategic plan is used to advocate for policy, infrastructure and education
  • 4.
    How the FoodSystem Affects Us Sustainable Food System
  • 5.
    What We CanInvestigate
  • 6.
    Elements of aCommunity Food Systems Assessment
  • 7.
    Community Food SystemsAssessment Process Community Education and Outreach
  • 8.
    How the WorkGets Done Role Responsibility Time Commitment Facilitator Organize meetings, monitor Varies according to the stage of “Encourager” progress, liaison between research the project. This is a potentially partners and community, help funded position. provide necessary materials 80-160 hours per month Steering Committee Approve and guide decisions, Meetings twice a month monitor progress, develop goals, assist in data collection, help 4-8 hours per month compile a finished report Work Group Members Develop work plans, collect data Meetings twice a month with research partners, Analyze data with research partners 4-8 hours per month
  • 9.
    How the WorkGets Done Steering Committee
  • 10.
    Consumption: Focus of thisGroup Community and Household demographics Incidence of hunger and food insecurity Incidence of diet-related illnesses, and resulting mortality and costs Labor statistics (unemployment and under-employment, wage- levels, types of jobs)
  • 11.
    Production: Focus of thisGroup Local/regional agriculture (amounts and value of crops, sustainability, farmland loss) Local employment and sales, in food retail, manufacture, and wholesale Community food assets/resources (grocery stores, food processing facilities, community gardens)
  • 12.
    Resource Work Group Focusof this Group Community-based organizations involved in food issues Local policies related to food issues (preserving agricultural land, promoting small businesses, attracting supermarkets) Food and Nutrition resources and services
  • 13.
    Community Outreach andEducation Focus of this Group Media (Newspapers, blogs, Facebook, twitter, T.V., radio) Recruiting new participants (church bulletins, fliers, community meetings, etc. ) Food advertisements and marketing
  • 14.
    The Importance ofa Timeline •Allows research partners to plan for their semester course work •Sets an overall goal for the group •Provides deadlines for work group tasks •Informs the broad community of progress •Developing a timeline allows work groups to prioritize for seasonal activities, community events and deadlines
  • 15.
    Available Resources andSupport Role Responsibility Primary Research Partner (Local This group works directly with each work group. They are the college/University, High School technical assistants for the project that live in the community. students) Help with: -data collection -surveys, focus groups, interviews -report editing Secondary Research Partner Help collect raw data from Census -Help analyze data -Make maps -Help design research plans and develop report Community Farm Alliance -Currently serving as the facilitator -Technical assistance -Community organizing and leadership development -help with policy development and implementation
  • 16.
    Madison County, Kentucky Community Profile Demographics Madison County Population Population, 16 years and older (2010) 65,696 Immigrant Population: Foreign Born Persons (2006-2010) 1.1% Age Structure Population under 18 years of age (2010) 21.53% Population over 65 years of age (2010) 11.24% Income Income: Median Household Income (2010) $41,945 Labor Force Civilian Labor Force: Employed (2010) 60.3% Civilian Labor Force: Unemployed (2010) 4.9% Not in Labor Force (2010) 34.6% Environmental Issues Water Quality: Average level of ammonia average Water Quality: Average level of nitrite-nitrogen highest Water Quality: Average level of nitrate-nitrogen above average Water Quality: average level of chloride below average Water Quality: Average level of sulfate average Water Quality: Average level of coductivity average
  • 17.
    Madison County, Kentucky- Community Profile Demographics Madison County Food & Farming Landscape Household food insecurity status: average (2008-2010) 15.60% Households without vehicles: > 1 mile to grocery store (2006) 3.46% Students Eligible for Free/Reduced Lunch (2010) 49% Participation of population in food & nutrition program: SNAP (2011) 18.85% Participation of population in food & nutrition program: WIC (2011) 3.25% Number of Food Pantries (2012) 4 Number of Farmers (Primary Occupation) (2007) 552 Number of Farmers (Secondary Occupation) (2007) 776 Number of organic farms in KY (2012) 69 Number of Farmers Markets (2012) 2
  • 18.
    The End Contact us! Heather Hyden: Heather@cfaky.org Alexa Arnold: Alexa@cfaky.org Office Phone: 502-223-3655

Editor's Notes

  • #5 Refer to diagram in the San Diego Case Study. Thinking about the parts of the food system and how it affects our everyday lives is a way to think about the goals and indicators for the study. So, what are the hopes of for Floyd County’s food system are the goals and what we want to study to meet those goals is a way to get there. Also, we must remember that each issue that we want to look into may require different methods.
  • #6 Tie this to our conversation about Food System Mapping. Connect to Benefits. “We want to get to this and this is how we do it” These are the parts of the story that we want to understand. Reference that we will be using this flower diagram again.
  • #8 This model is an example of how the story gets told. Talk about where we are in the process. Talk about how Keiko’s students worked on a profile and about what we are thinking the community training will involve.
  • #9 Discuss time commitments needed and how this list could be used to assess community readiness. Work groups are the functional piece. This is how the work gets done. Just an example of time needed and structure. Community Farm Alliance is filling the role of Facilitator right now. This may be a good time to ask Dr. Swanson about his project. Reference the San Diego Study about what type of data work groups collect. Goal 1.1 in the table of contents.
  • #16 This is a list of the possible resources and support that are available.