Download as PDF, PPTX
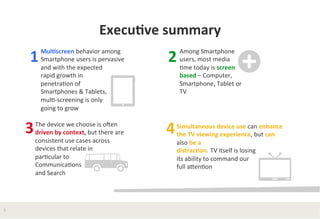
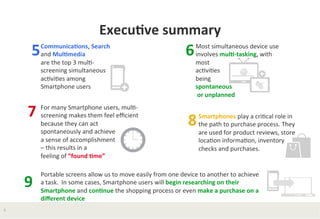
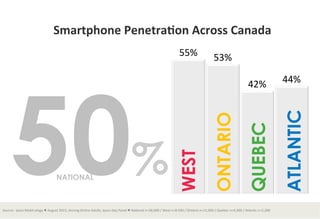
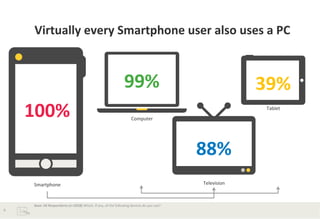
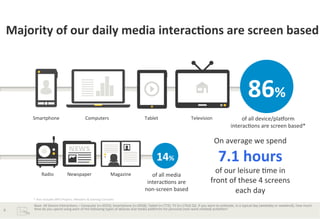
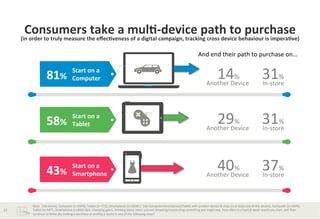
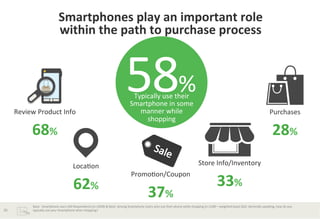
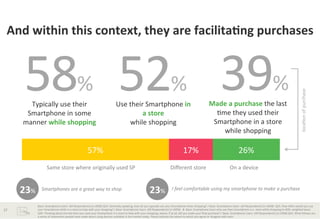
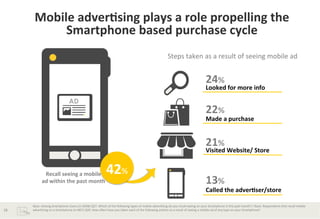

The document discusses the increasing prevalence of multi-screen behavior among Canadian smartphone users, highlighting its impact on communication, search, and multimedia activities. It reveals that users often engage in simultaneous device usage, enhancing their experience while potentially distracting from traditional TV viewing. Additionally, smartphones are essential in the shopping process, facilitating product research and purchases across multiple devices.


