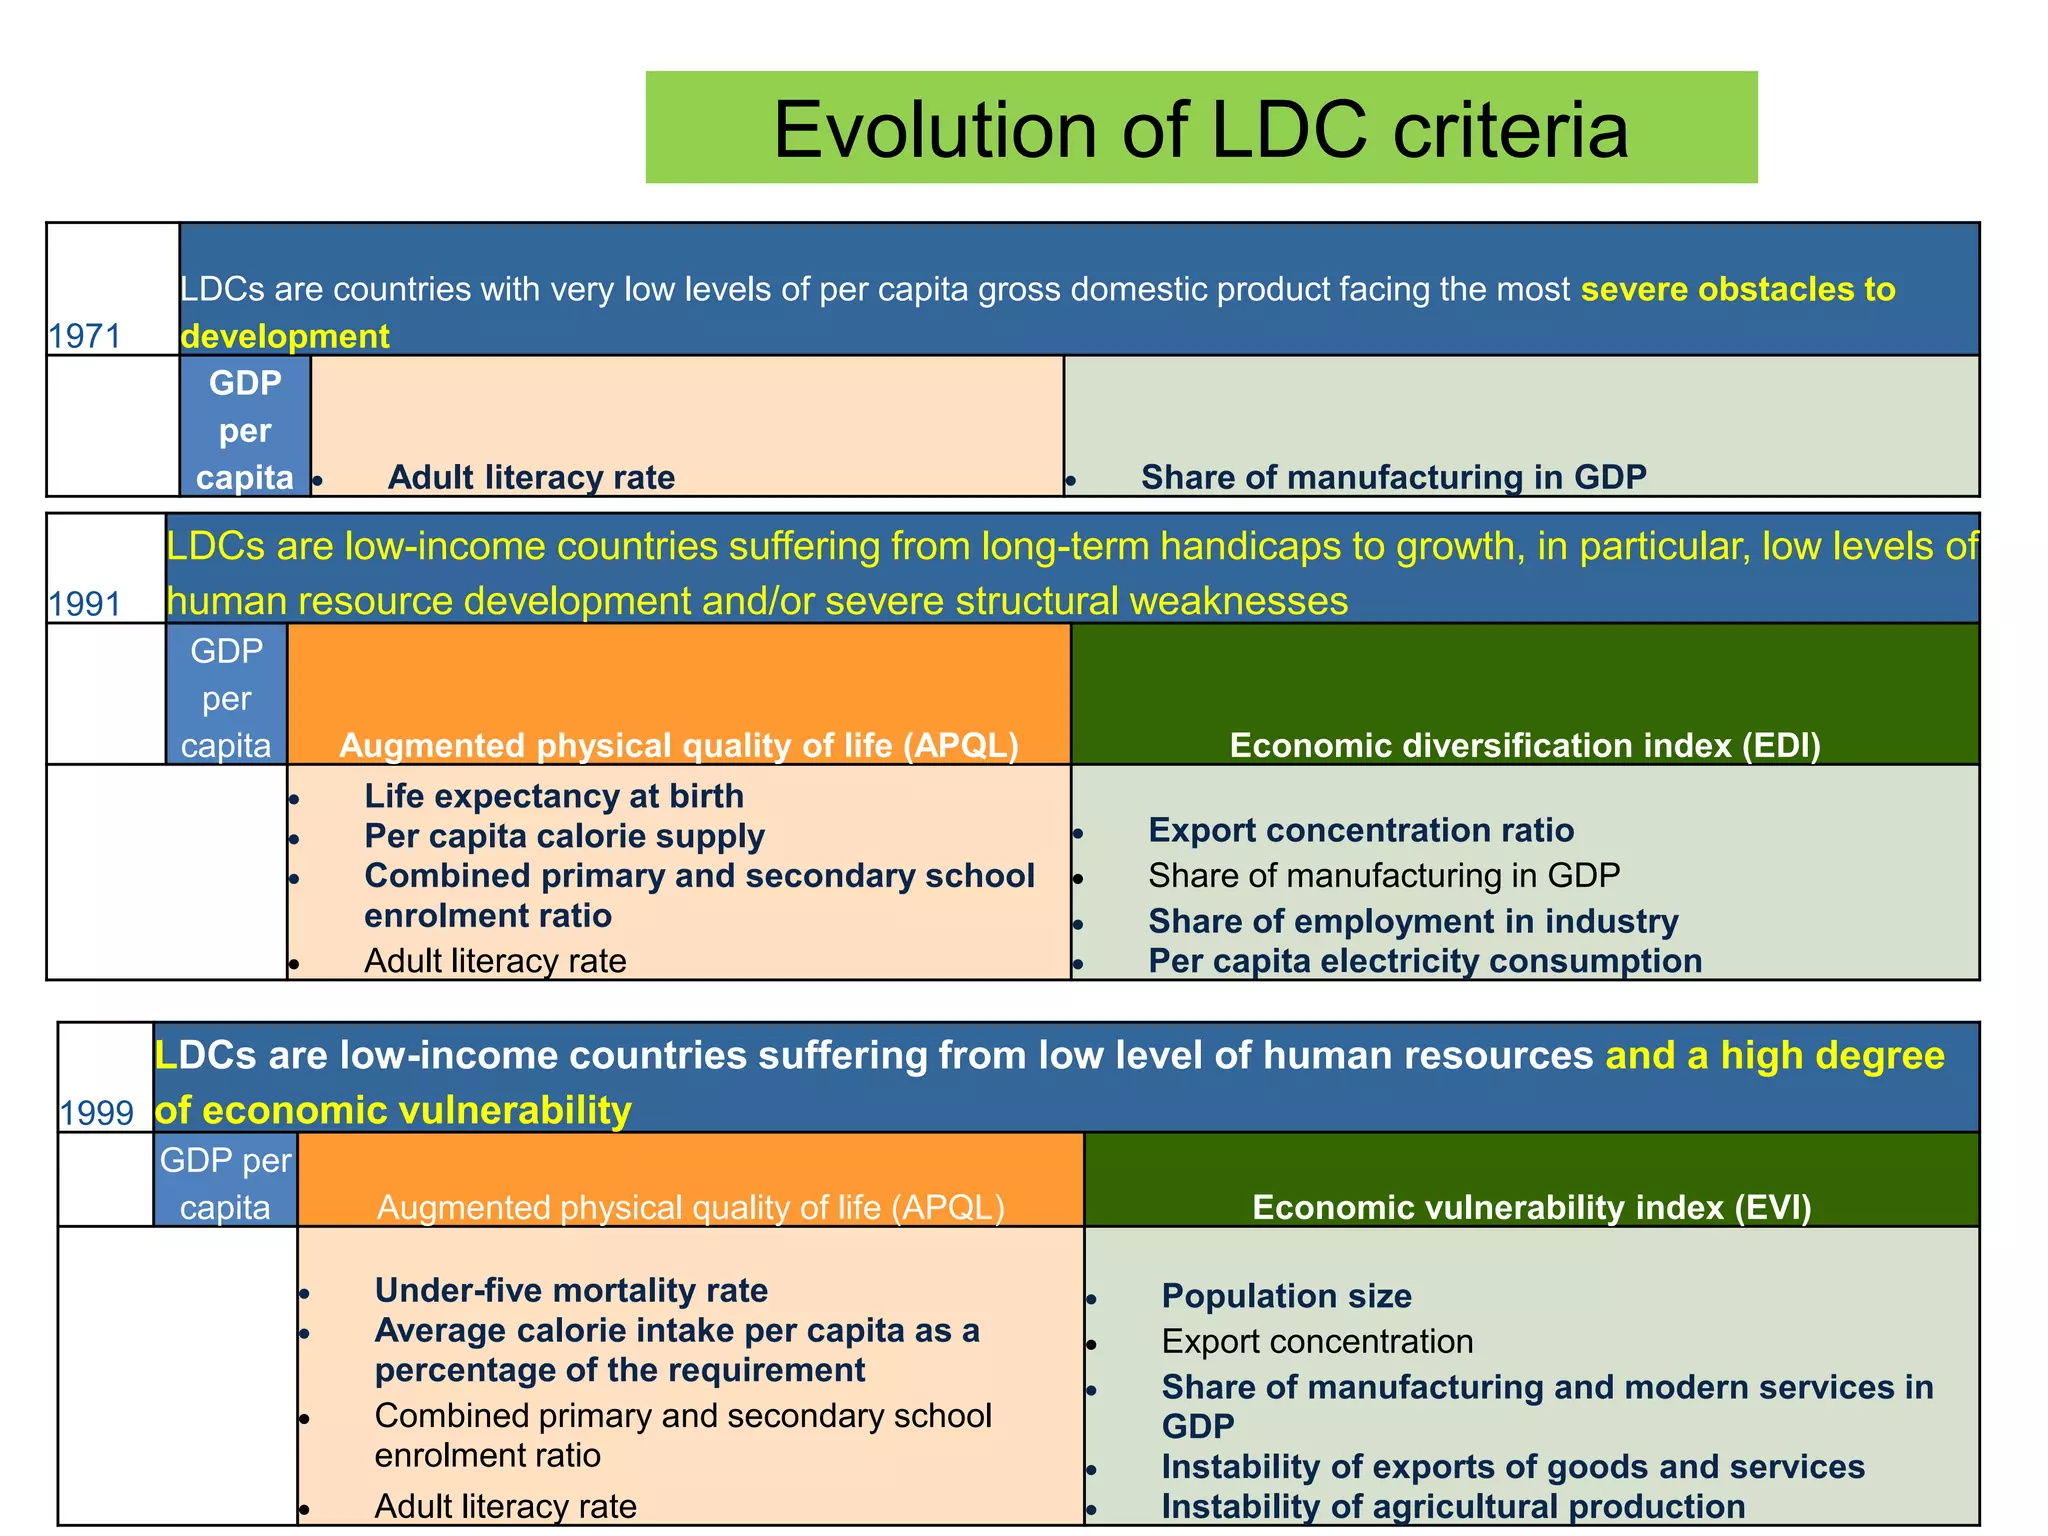
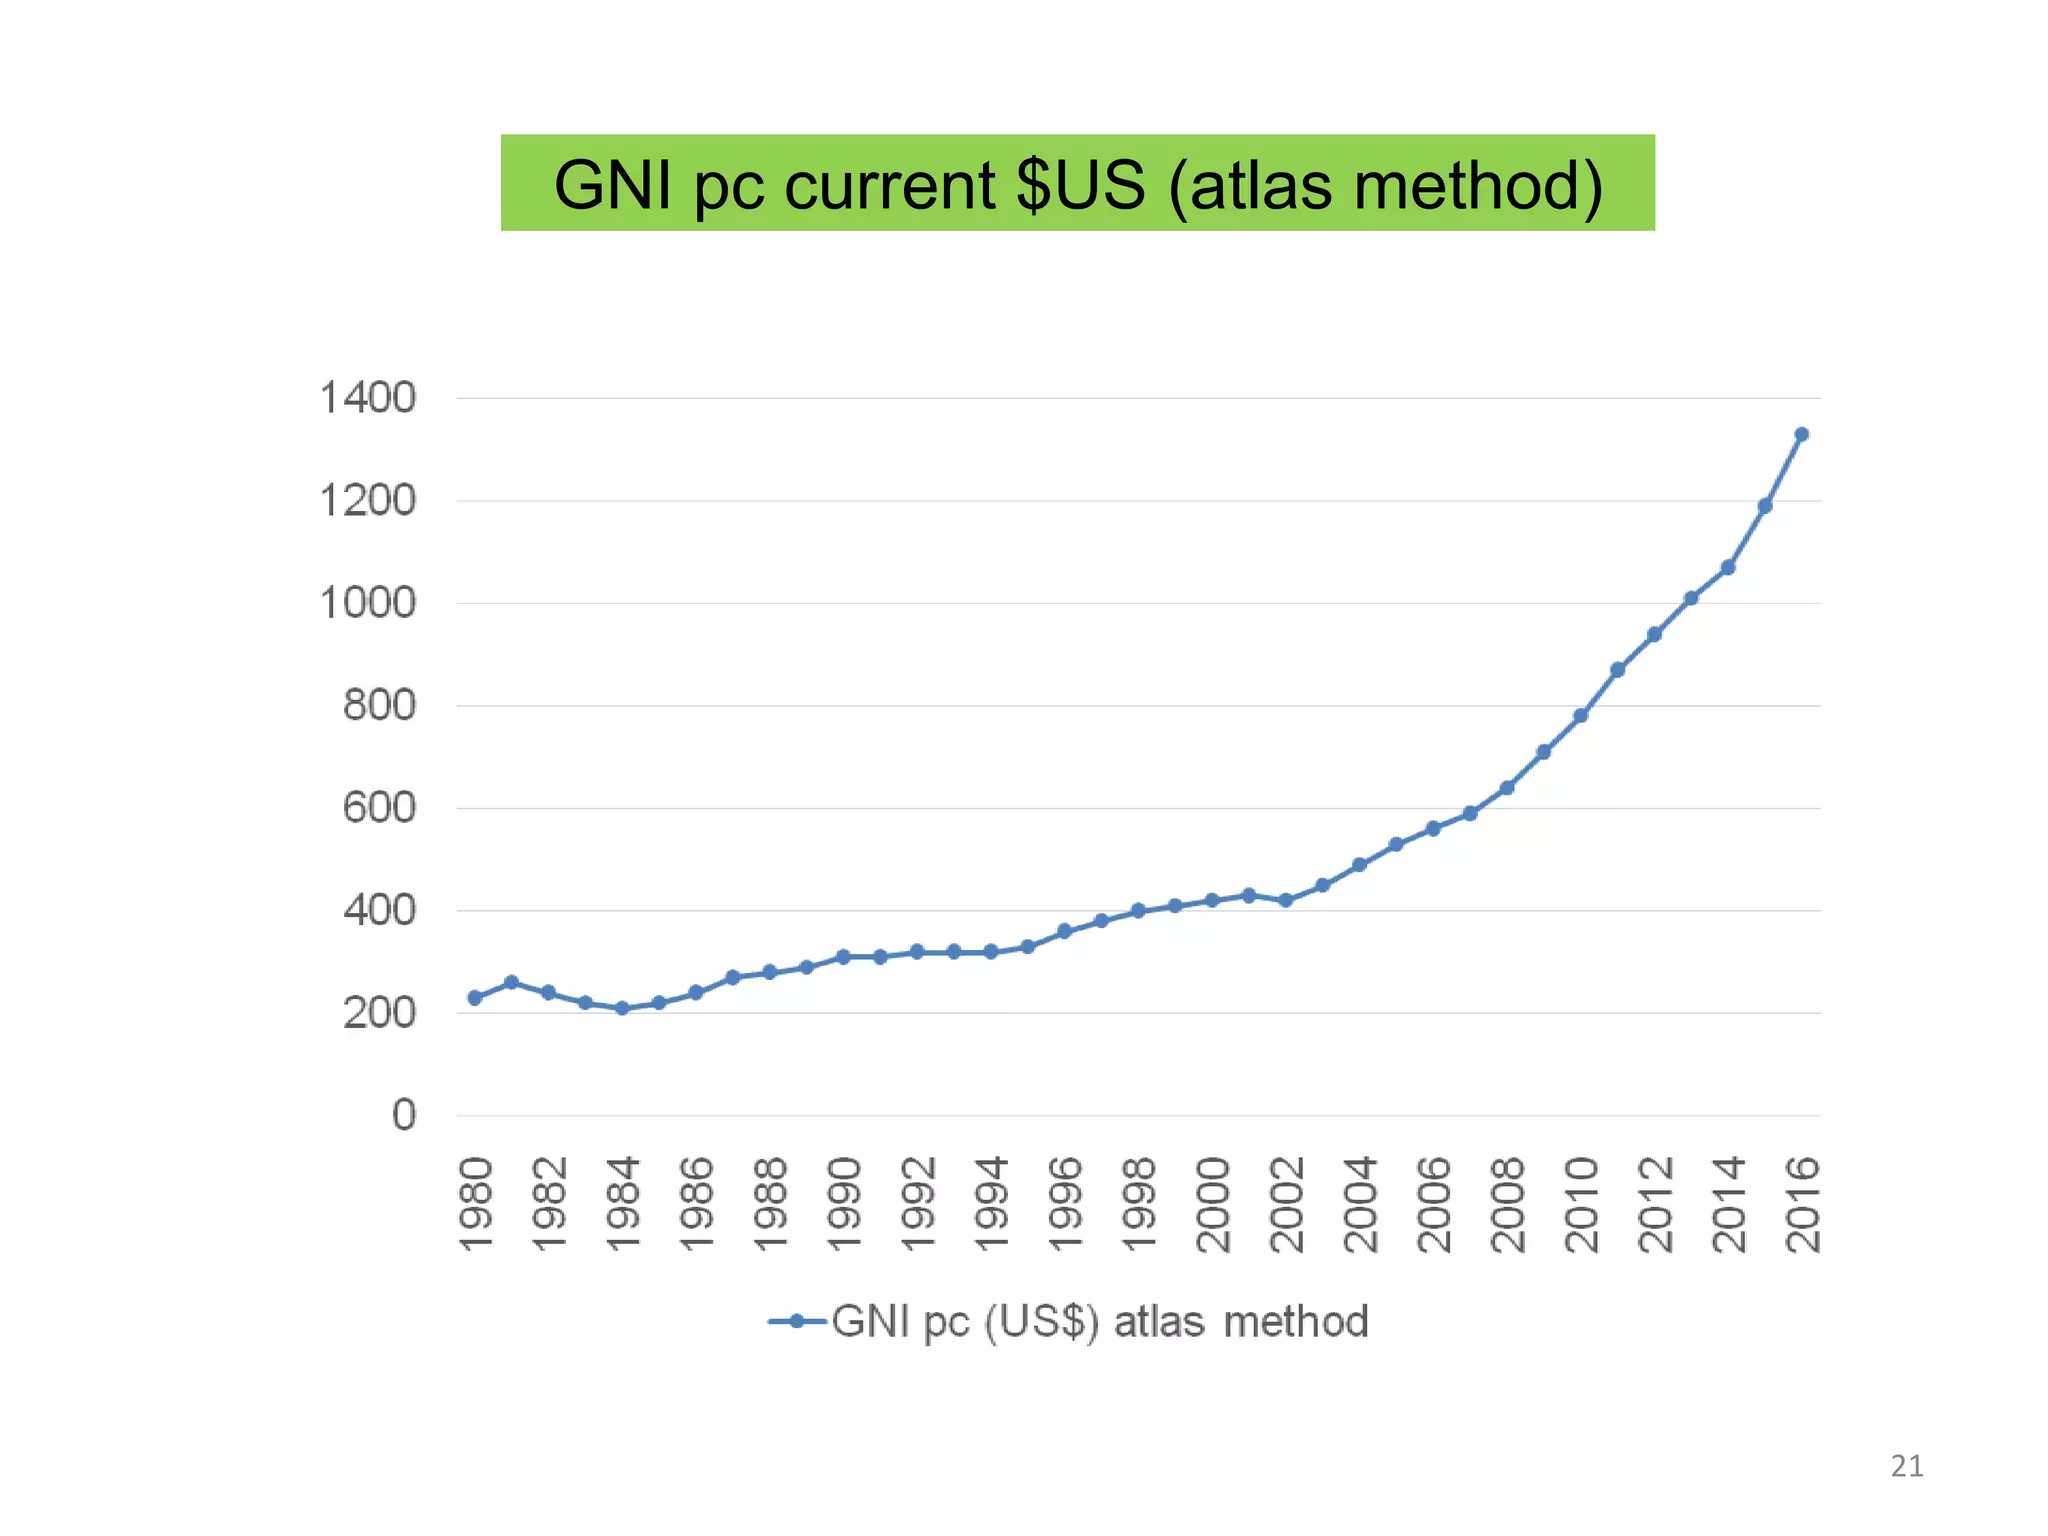
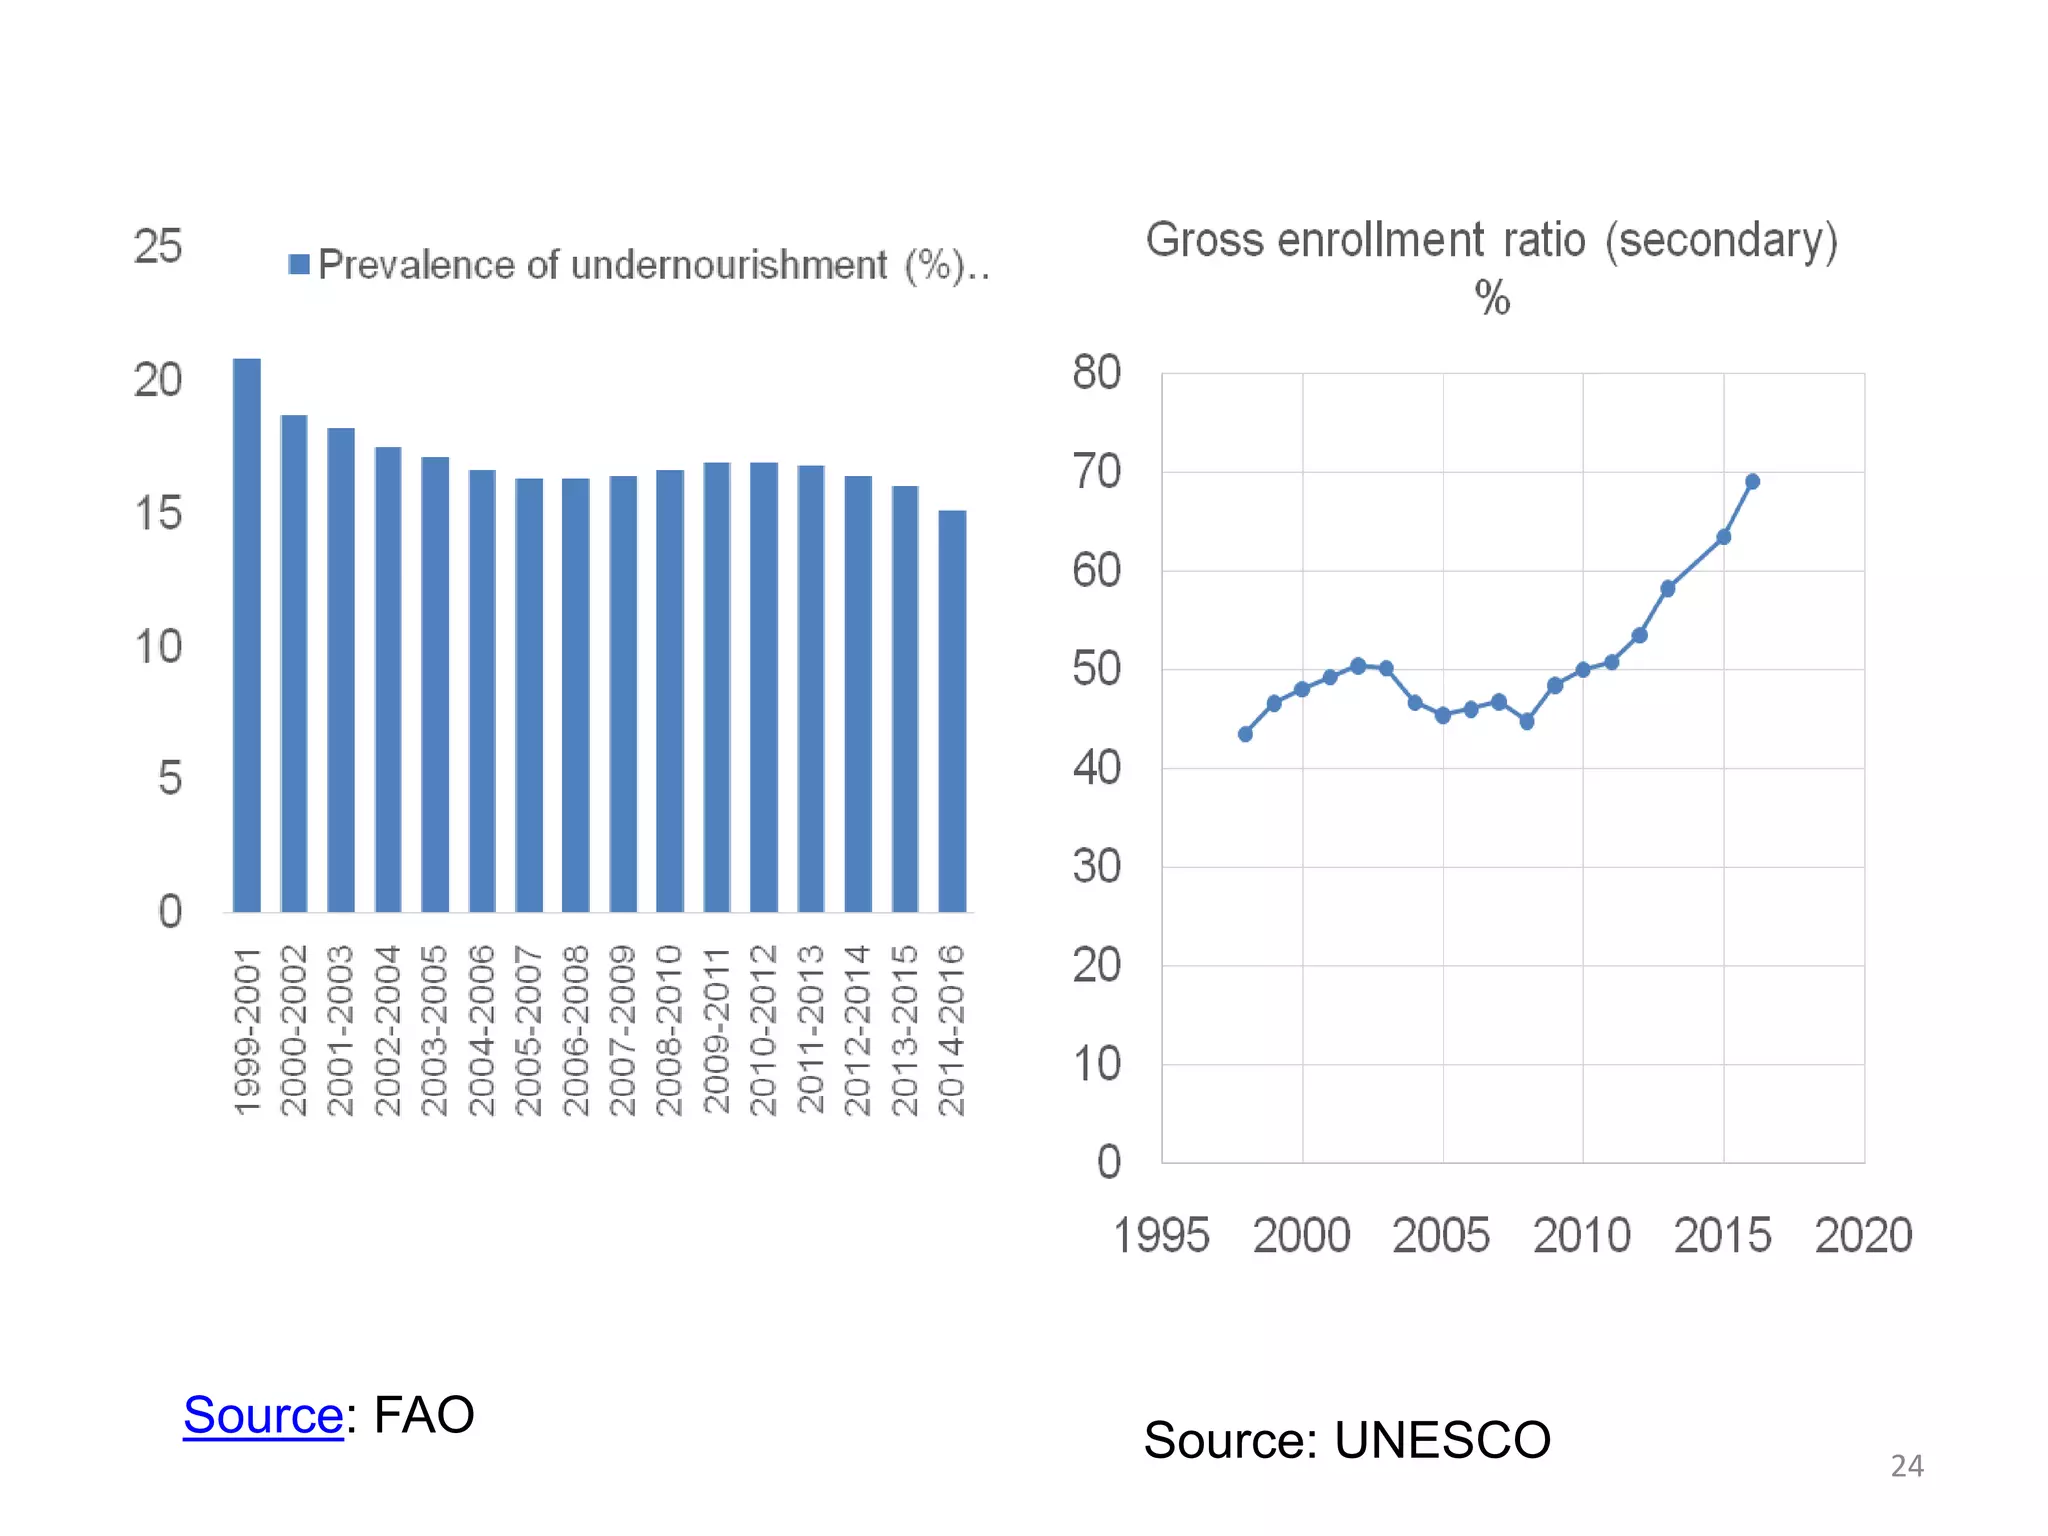
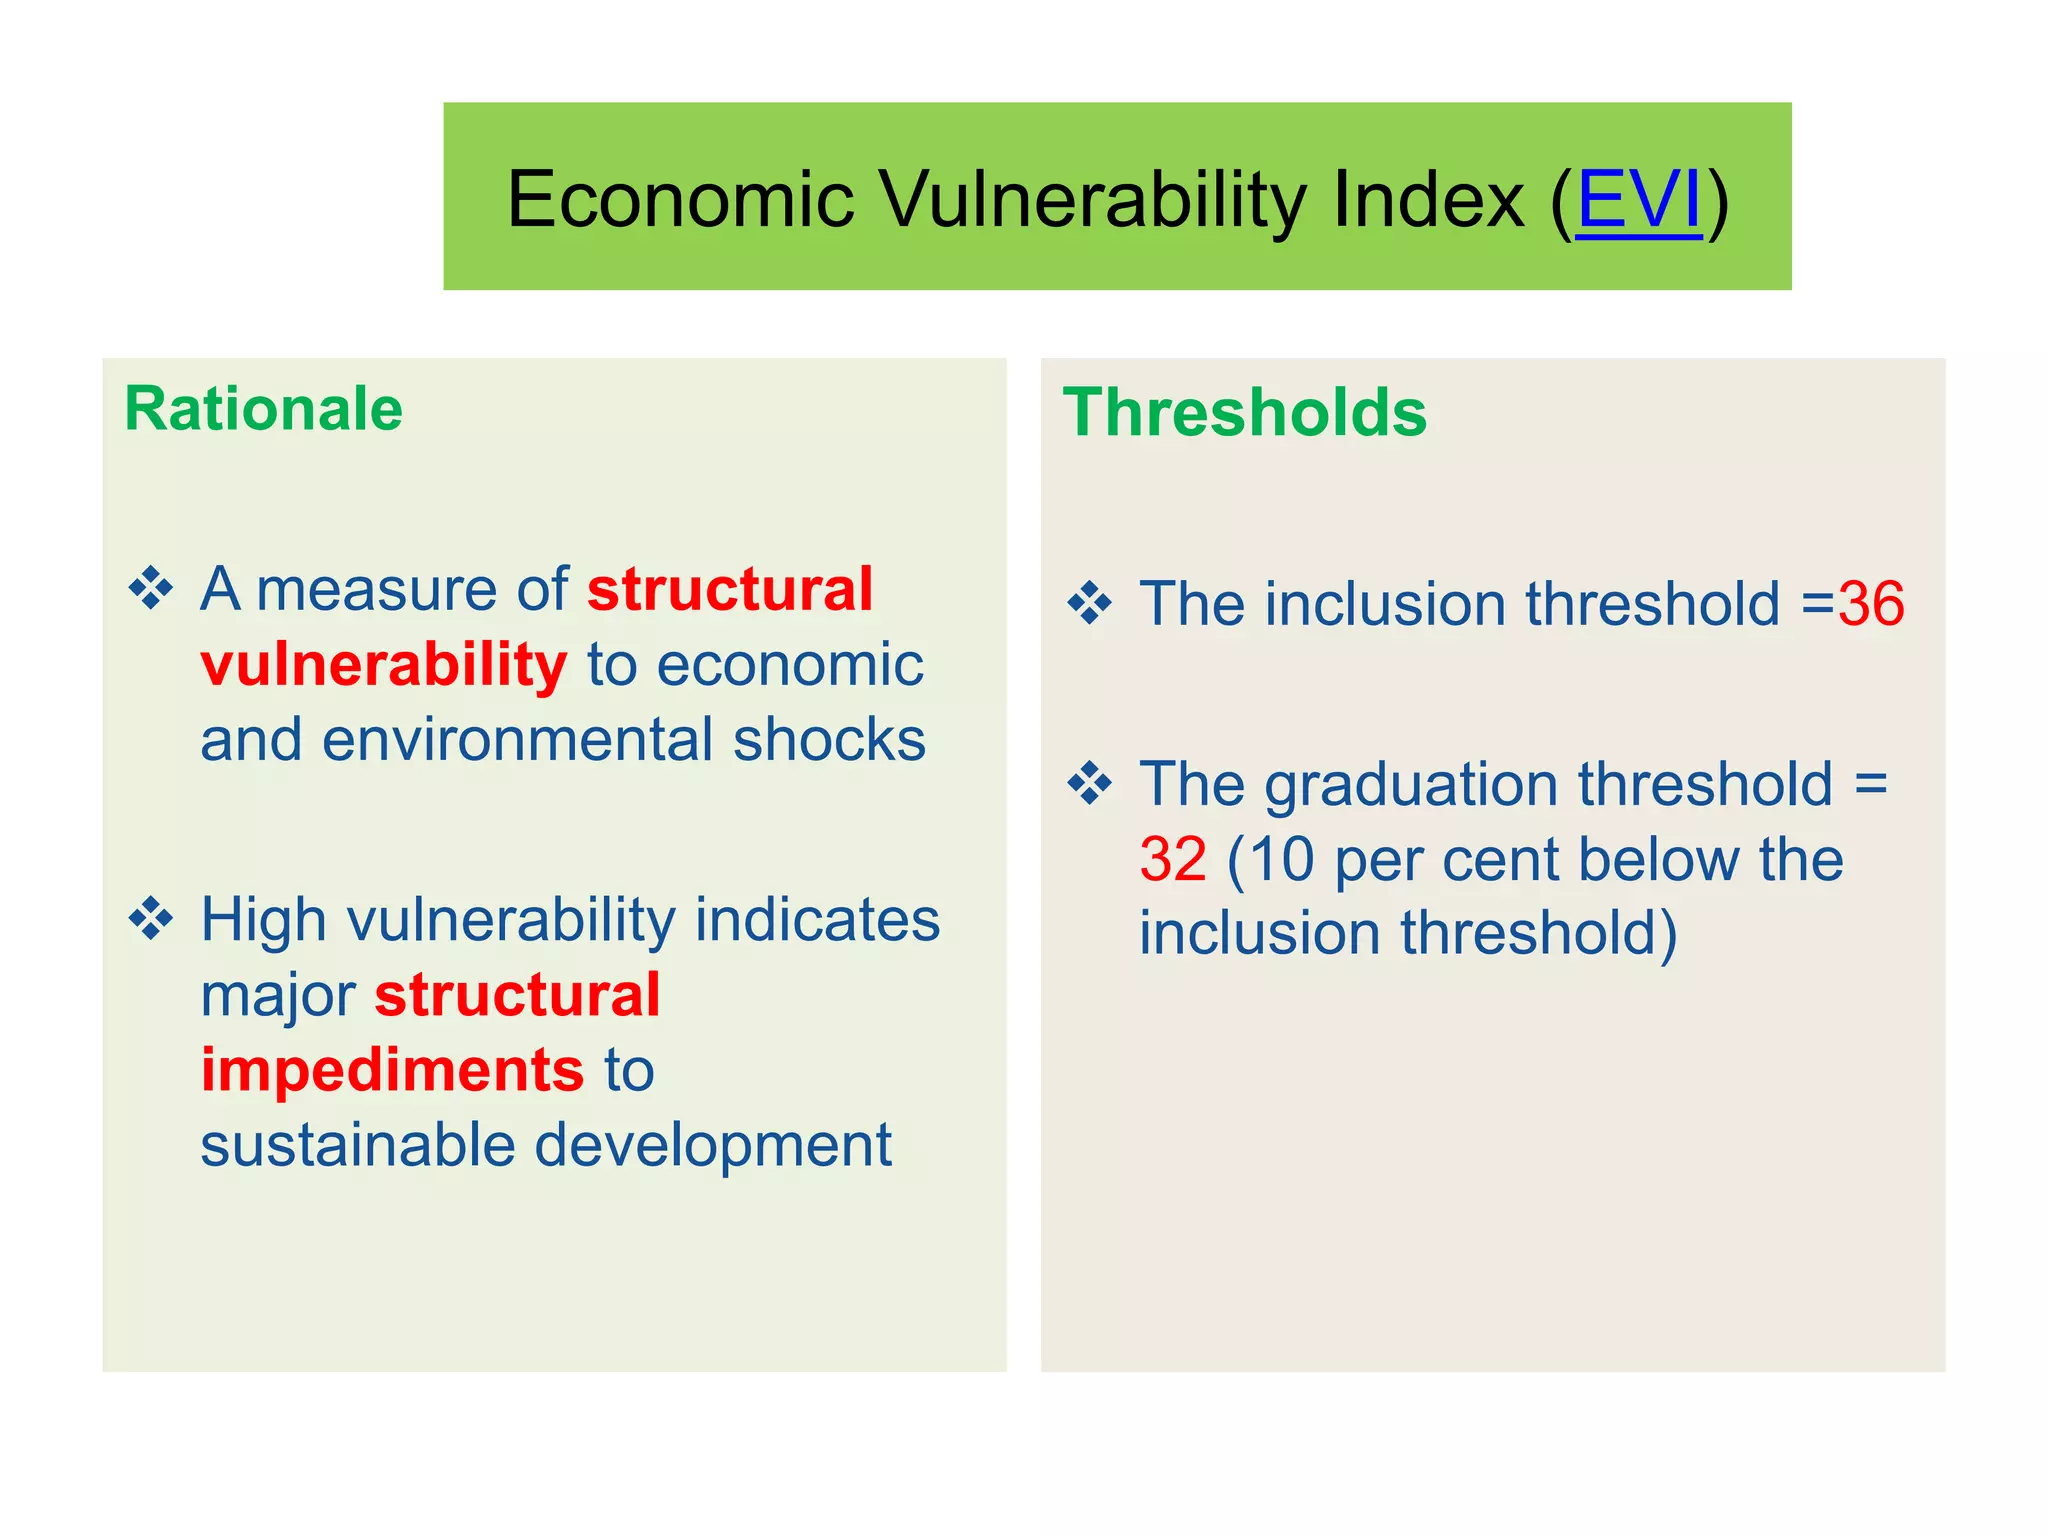
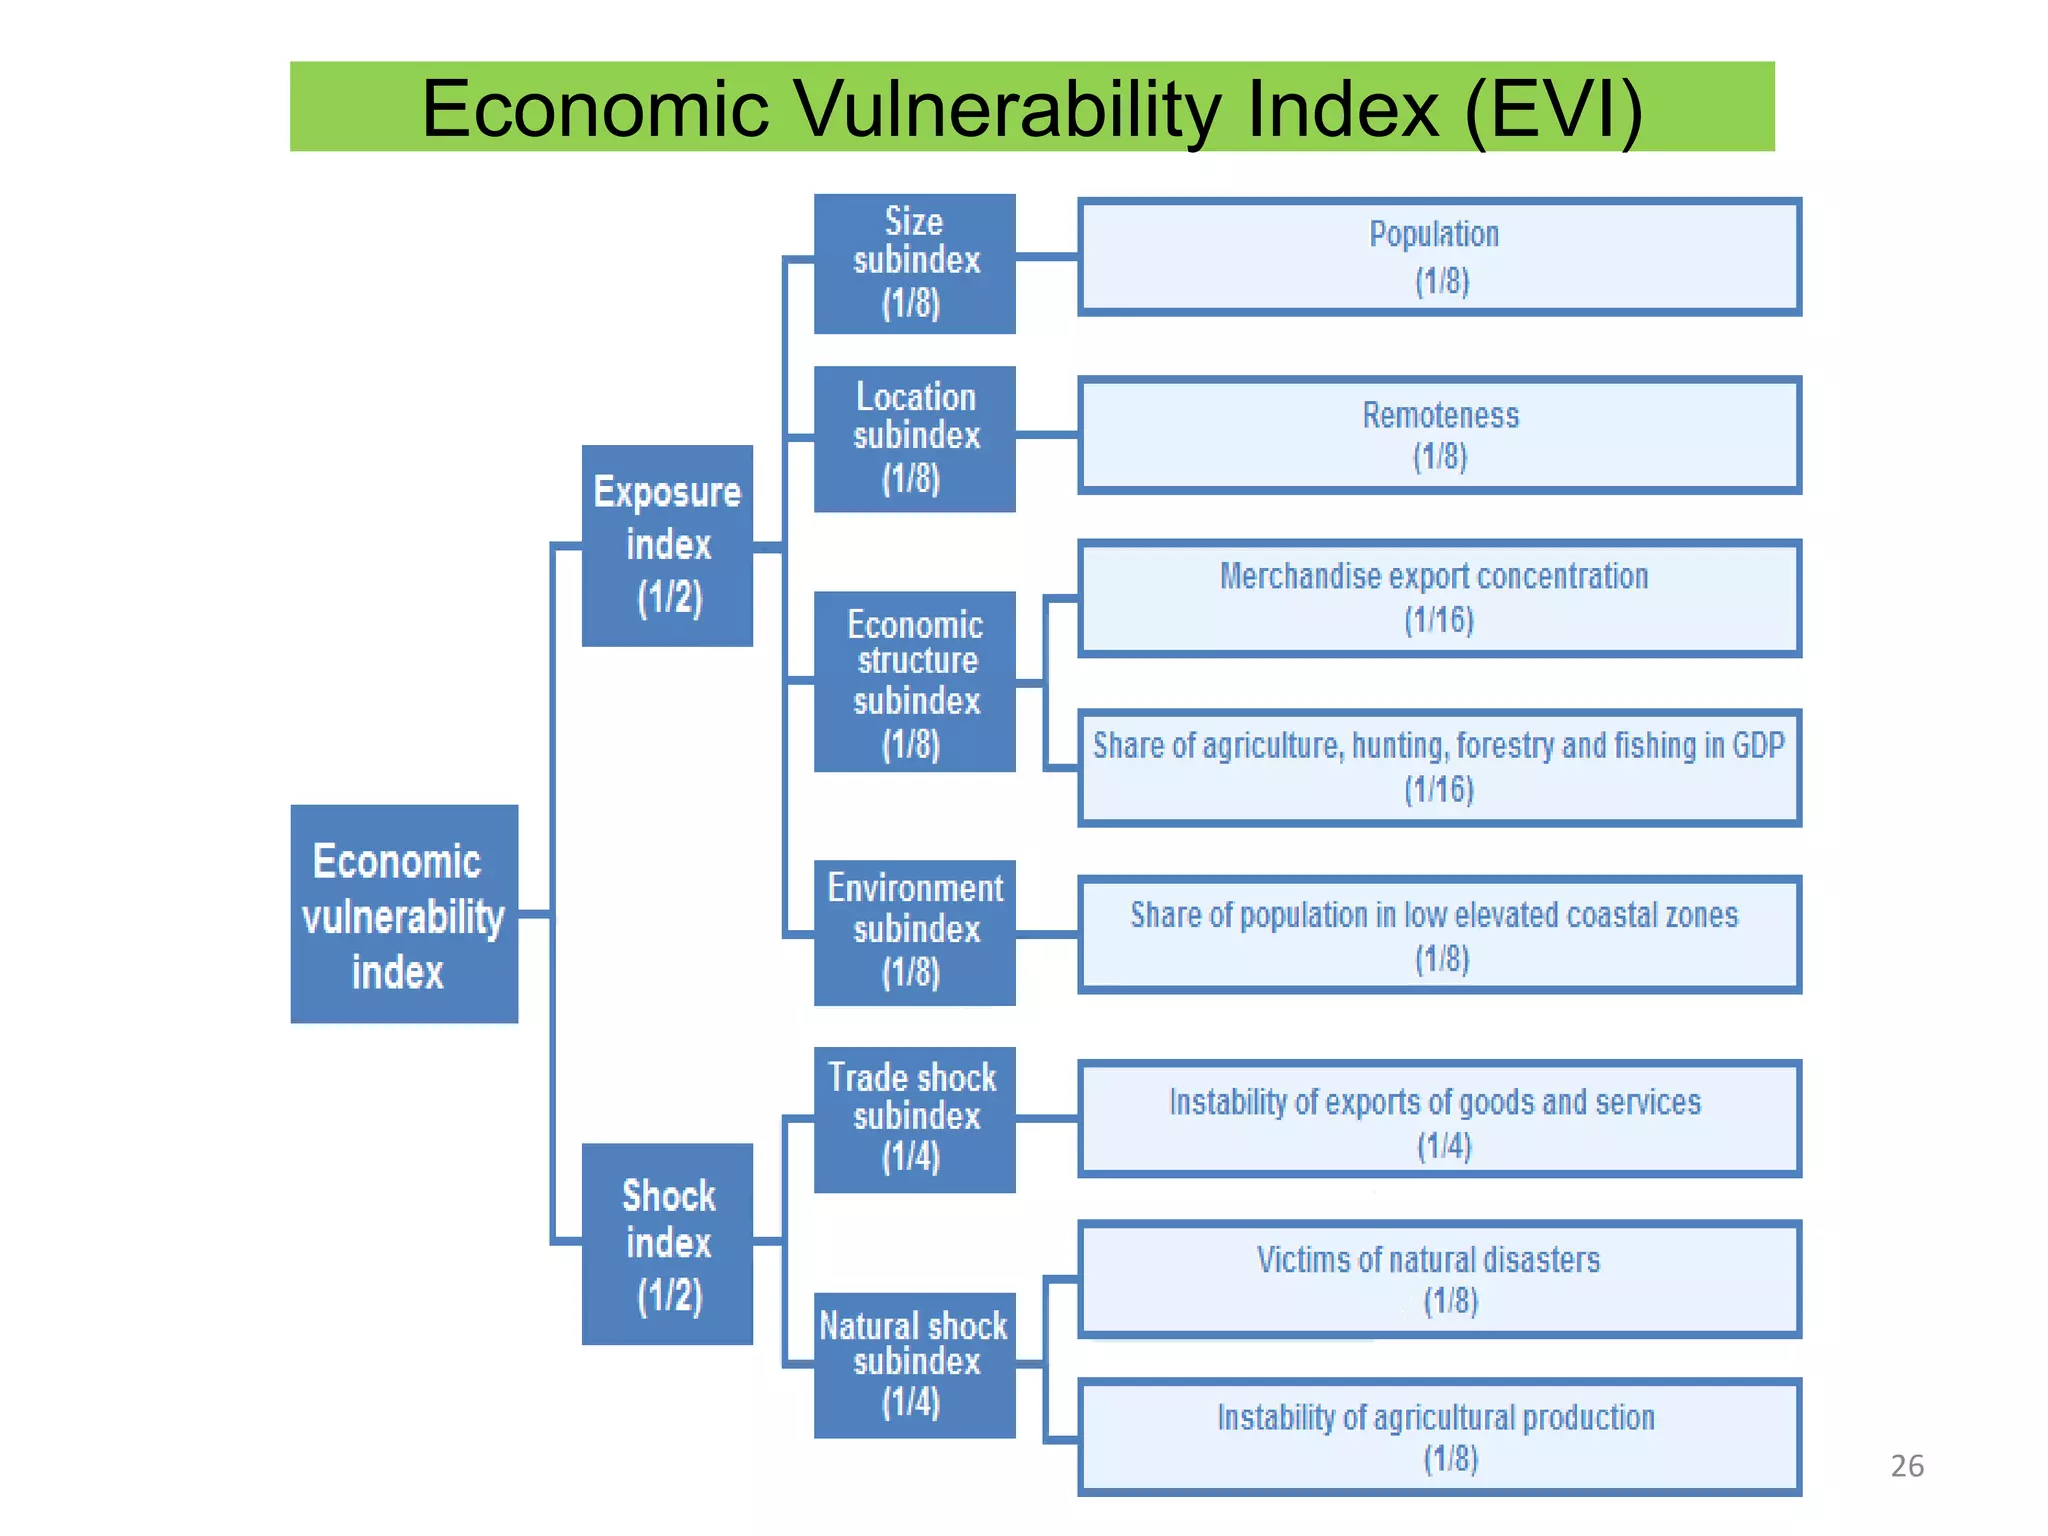
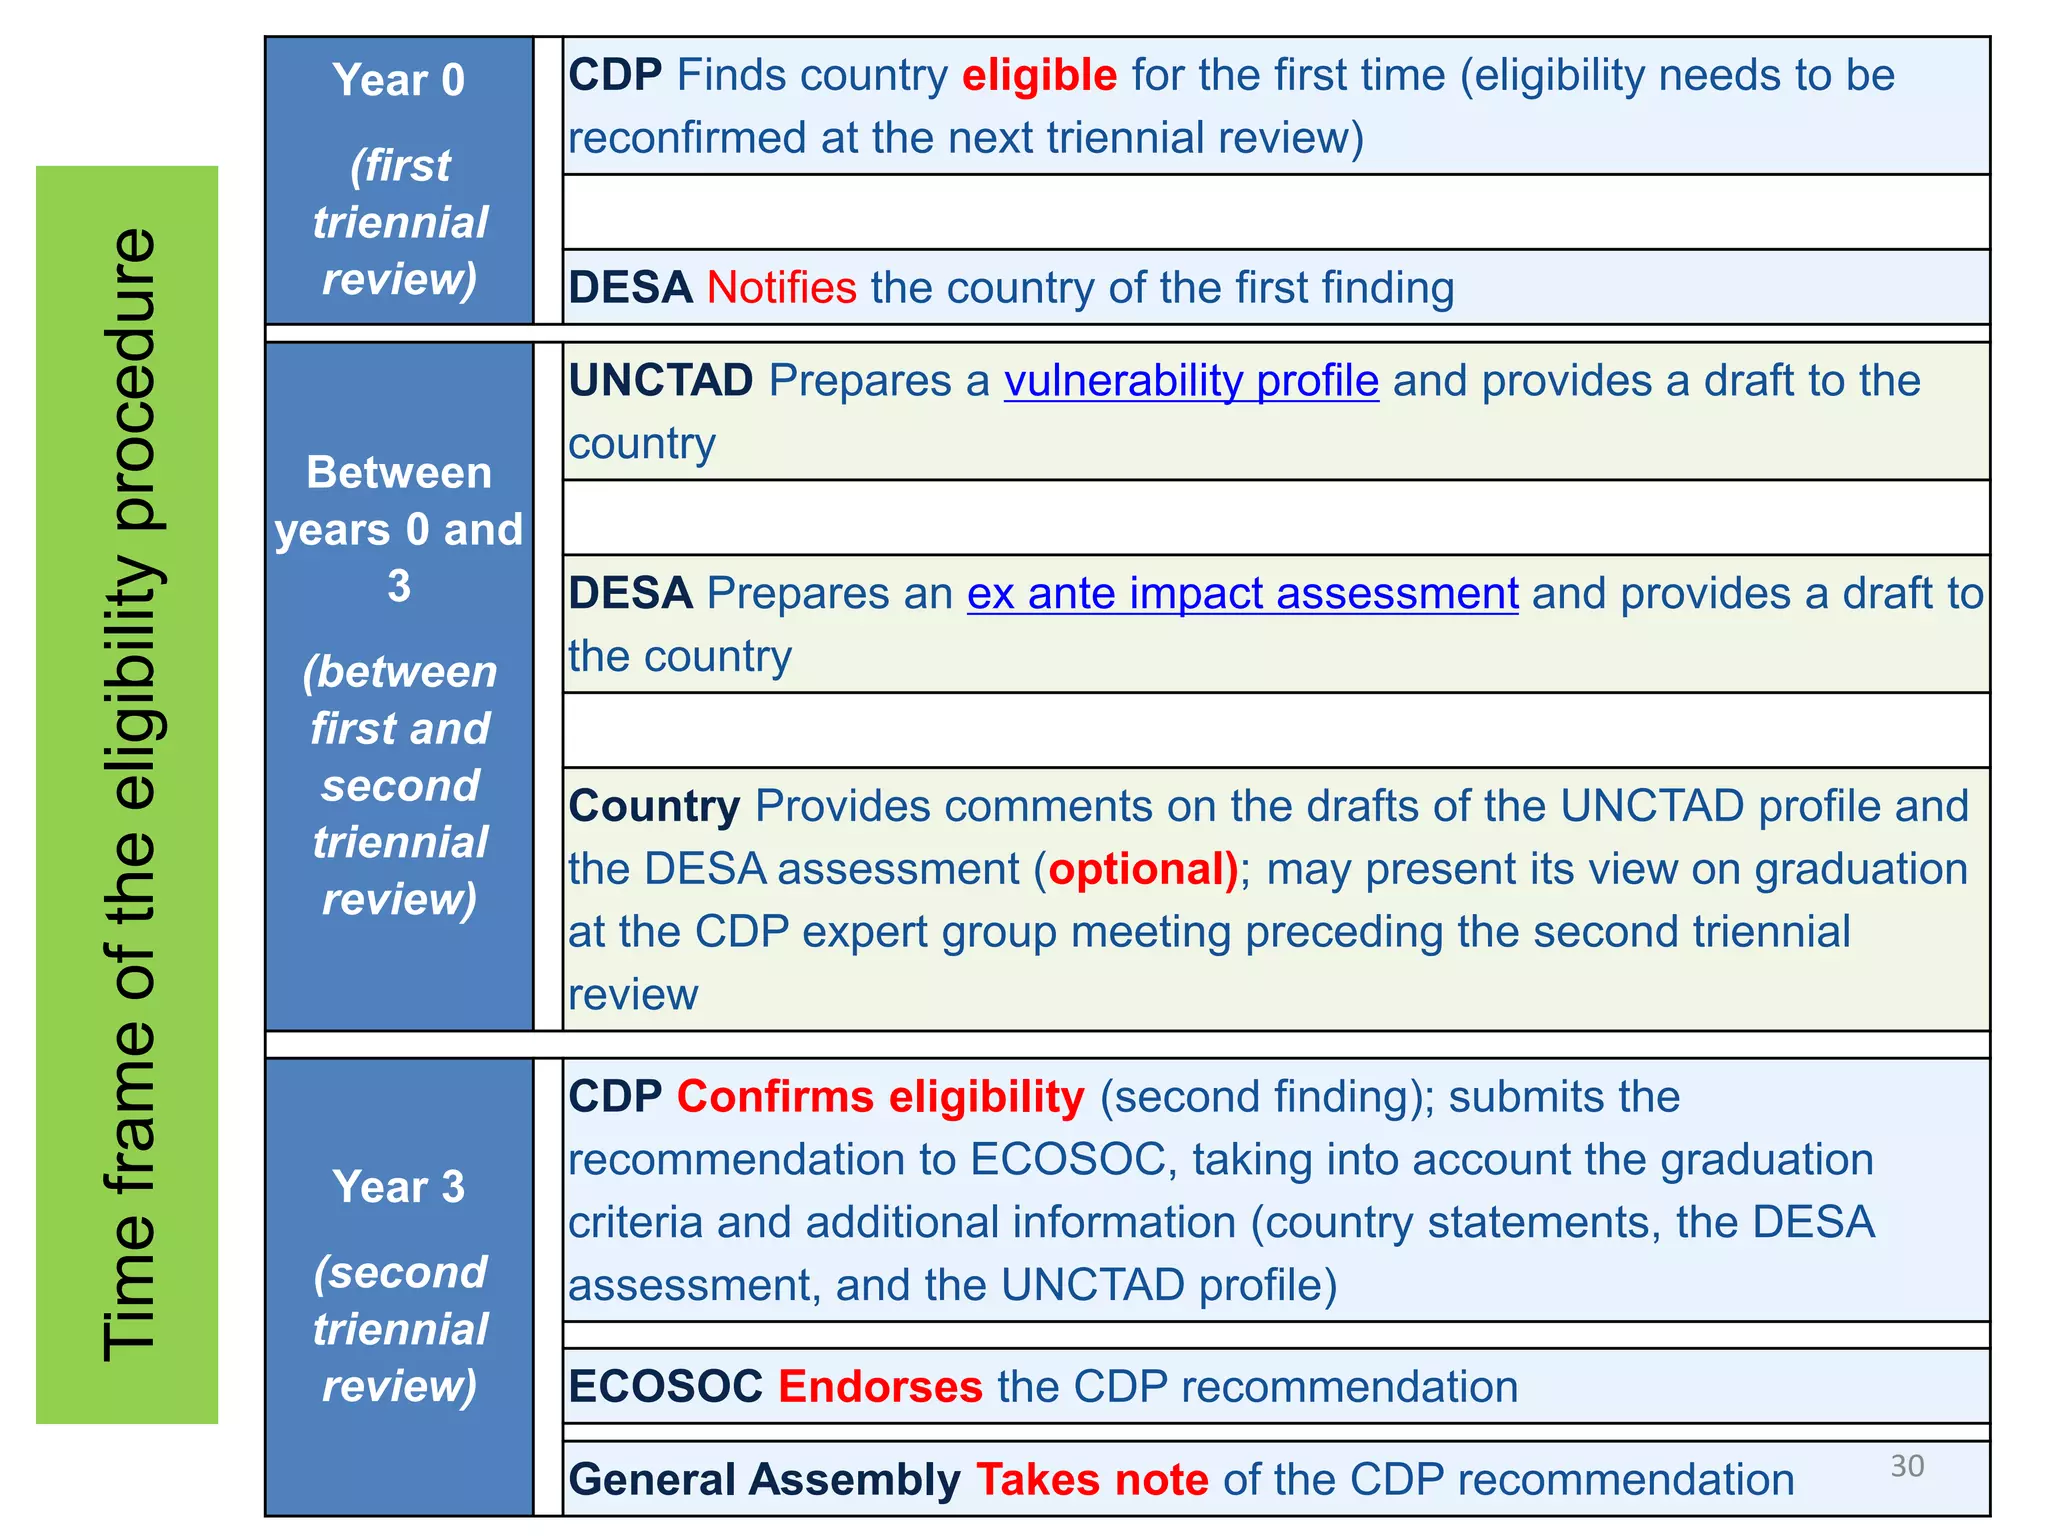
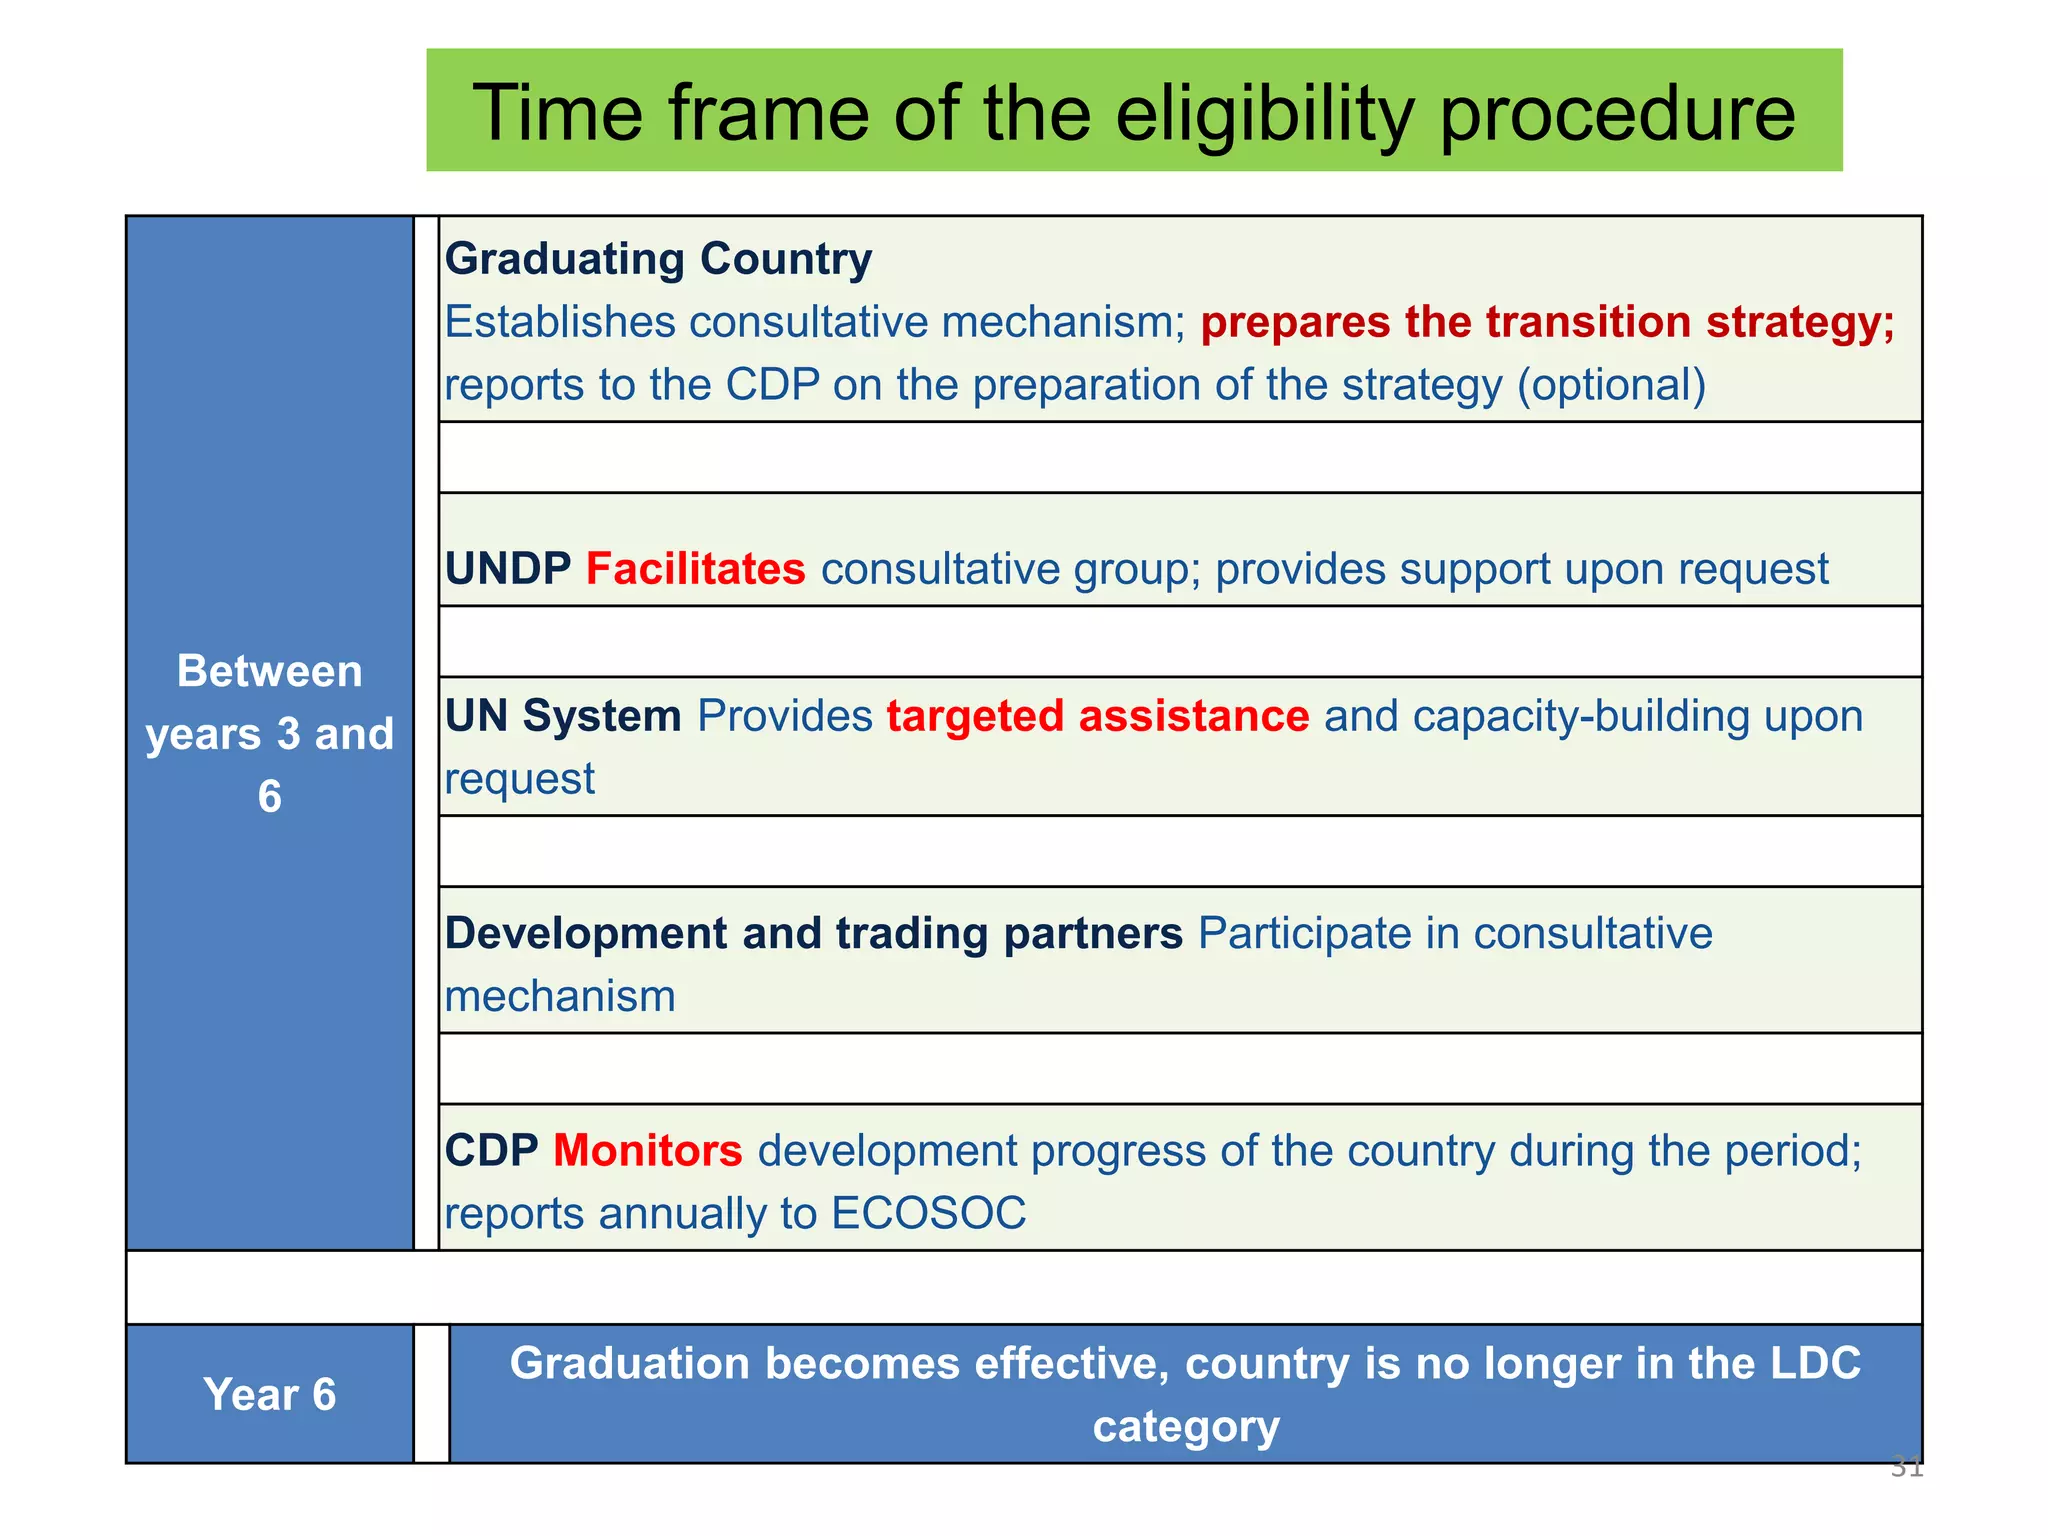
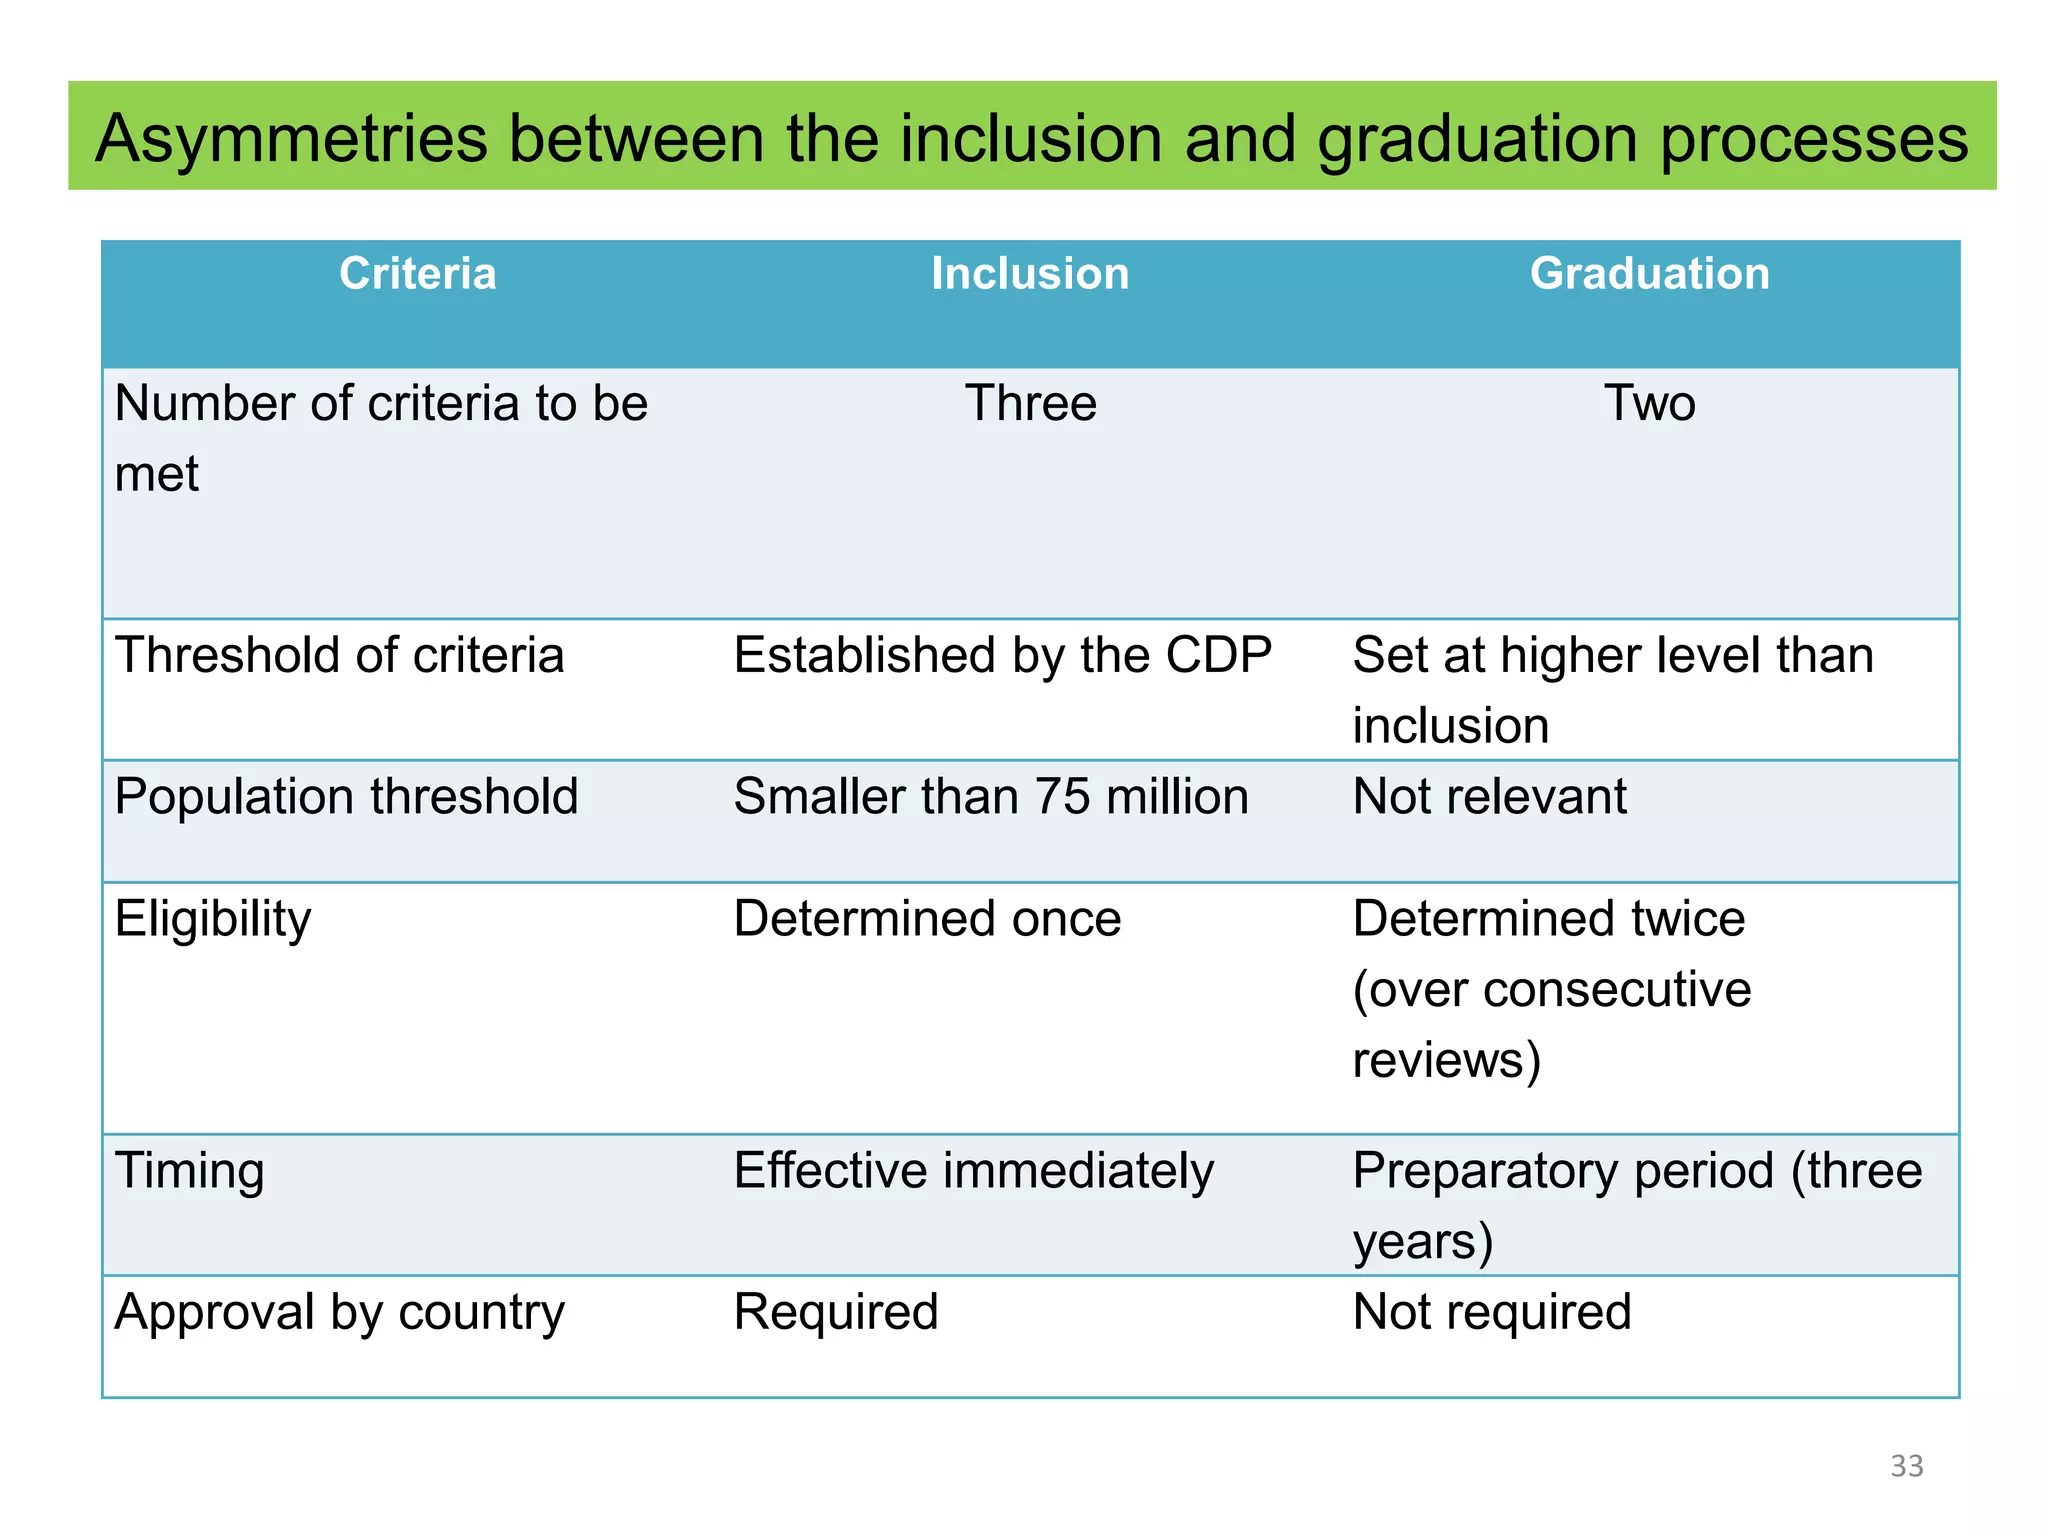
This document discusses Bangladesh potentially graduating from its status as a Least Developed Country (LDC). It provides background on the LDC category and criteria for inclusion and graduation. The criteria have evolved over time to include measures of income, human assets, and economic vulnerability. Bangladesh meets the graduation thresholds for income but still needs progress on the human assets and economic vulnerability indices. The document outlines Bangladesh's performance on the various criteria and the timeline and process for reviewing and potentially graduating countries from LDC status.
There are several traditional and modern ways to measure a country's level of development. Traditionally, development was equated with economic growth and countries were classified based on their Gross National Product per capita. However, GNP has limitations and does not reflect differences in cost of living between countries. More modern measures include Purchasing Power Parity per capita, energy consumption, percentage of the workforce in different sectors, and quality of life indices like the Human Development Index which considers education, income, and health. Collecting accurate social and demographic data to measure development can be challenging for various reasons.
The document discusses the key characteristics of developing economies. It begins by defining developing countries based on per capita income levels and then outlines 10 common features: 1) lower living standards and productivity, 2) lower human capital, 3) higher inequality and poverty, 4) higher population growth, 5) greater social divisions, 6) larger rural populations but rapid urbanization, 7) lower industrialization, 8) adverse geography, 9) underdeveloped markets, and 10) lingering colonial impacts. The document then examines several of these features in more depth, including levels of human capital, living standards, inequality, population trends, and social divisions.
This document discusses socioeconomic inequalities and global conflicts. It examines how inequalities are measured using indicators like GDP, HDI, and MPI. Countries are classified into levels of development like high, emerging, and low based on these indicators. Causes of development inequalities include natural conditions, domestic factors like lack of resource exploitation, and international factors like colonialism, unequal trade, debt, and dependence on foreign powers. Recent trends show stagnation in developed nations but progress in emerging countries. Solutions to issues focus on increasing aid, improving human development, and greater citizen participation.
This report provides a global update on multidimensional poverty in 2023, finding that 1.1 billion people across 110 developing countries experience multiple deprivations in health, education, and living standards. Nearly half of poor people live in Sub-Saharan Africa and over a third live in South Asia. The poorest regions and groups tend to experience the most intense poverty, with 485 million people experiencing severe poverty. While most countries have reduced poverty over time, children are being left behind in many places and population growth outpaced poverty reduction in 15 countries. The report calls for more recent data to fully understand poverty during and after the COVID-19 pandemic.
The document provides information on the Millennium Development Goals (MDGs) and Sustainable Development Goals (SDGs). It discusses the 8 goals of the MDGs from 2000-2015 related to poverty, education, gender equality, health, and environmental sustainability. It then outlines the 17 goals of the SDGs adopted in 2015 to build on the MDGs and address social, economic, and environmental issues globally in a more comprehensive manner through 2030. Key differences between the MDGs and SDGs include their scope, focus areas, targets, indicators, financing, and emphasis on quality of life and sustainability.
A country is classified as a Least Developed Country (LDC) if it meets three criteria: low income, human resource weakness, and economic vulnerability. LDCs have both similar and dissimilar characteristics. Similar characteristics include low per capita income, high poverty and population growth rates, and dependence on agriculture. Dissimilar characteristics include differences in size, income levels, historical backgrounds, resource endowments, importance of public/private sectors, and degrees of external dependence. While LDCs face many challenges, foreign investment from multinational corporations can help by providing access to capital, jobs, and new technologies.
This document summarizes some key problems facing developing India, including population growth, poverty, unemployment, and corruption. It then discusses how a growing population impacts the environment through increased deforestation, water usage, pollution, and global warming. It compares these environmental impacts between India and the United States using population growth models and factors like education, GNP, and immigration. It proposes solutions like increasing education, family planning programs, sustainable development practices, and reforestation.
Traditionally, development was defined and measured through economic indicators like GNP per capita. However, modern definitions see development as improving quality of life through meeting basic needs, social justice, health, education, and freedom. Quality of life is now often measured through indices that consider factors like life expectancy, education, and income. These measures provide a more holistic view of development than purely economic metrics but still have limitations in capturing inequality and changes over time.
Traditionally, development was defined and measured through economic indicators like GNP per capita. However, modern definitions see development as improving quality of life through meeting basic needs, social justice, health, education, and freedom. Quality of life is now commonly measured through indices like the Physical Quality of Life Index, Human Development Index, and International Human Suffering Index which use a broader range of social and economic factors. However, accurately measuring development remains challenging due to limitations in data collection and inequality within countries.
This document discusses economic development in developing countries. It provides characteristics of developing countries such as low per capita income, shortage of capital, underutilization of natural resources, high population growth rate, weak infrastructure, political instability, high illiteracy, poor health, and heavy reliance on foreign aid and debt.
It also discusses the "vicious circle of poverty", where low incomes lead to low savings and investment, which further decreases productivity and incomes. This perpetuates a cycle of poverty. Several measures to break this cycle are proposed, such as optimizing resource use, promoting savings, increasing skills and education, attracting foreign investment, and using foreign aid effectively.
Finally, the document analyzes different methods to
On MDGs, the Post-2015 Development Agenda, and the World Bank GroupSDGsPlus
The document summarizes the World Bank Group's role in supporting the post-2015 development agenda and sustainable development goals (SDGs). It discusses lessons from implementing the Millennium Development Goals and financing challenges for the SDGs. It outlines the World Bank Group's goals and how its global practices and sectors align with proposed SDG issue areas. The World Bank Group is well positioned to help implement the SDGs through its transformed structure and ability to leverage different sources of financing.
The document discusses poverty from multiple dimensions including lack of access to food, shelter, health services, education, clean water and sanitation facilities. It notes that poverty is not just about low income but also human deprivations. It outlines the effects of poverty on children, women, education and sanitation. It provides statistics on poverty rates in India over time and discusses the evolution of the concept of minimum living standards in India through various committees and plans. It analyzes different strategies and programs adopted by the government to directly tackle poverty and ensure minimum living standards.
What is Development? What are the indicators of development? What are indices of Development? What is GDP, GNP, GNI etc.? How do we measure development? Find the answers of these questions in this presentation. Learn about Human Development index. Know the criteria to measure development.
This document discusses various concepts and definitions related to poverty. It defines absolute poverty as having income less than $2 per day, while relative poverty compares one's economic status to others in the society. Both concepts fail to consider non-income aspects of poverty. Other definitions discussed include income poverty, extreme poverty of less than $1 per day, and India's poverty lines. Causes and impacts of poverty are also outlined. Various poverty indices like the Human Poverty Index and Global Hunger Index are explained. Strategies to address hidden hunger and malnutrition are provided.
Class Presentation on Economic development, inequality and foreign aid.pptxGeorgeKabongah2
Economic Growth may be defined as rate of expansion over a short period.
Economic growth is a single dimensional quantitative concept which is concerned only with the rate of increase in national income.
This document outlines the goals, targets, and indicators for tracking progress on the United Nations Millennium Development Goals. It includes goals and targets related to eradicating poverty and hunger, achieving universal primary education, promoting gender equality, reducing child mortality, improving maternal health, combating HIV/AIDS and other diseases, ensuring environmental sustainability, and developing a global partnership for development. Progress is measured using specific indicators for each target.
This document provides a framework for making strategic choices about IFAD operations in a country to identify financing opportunities and facilitate results management. The central objective is to ensure IFAD country operations have a positive impact on poverty reduction. Wide stakeholder consultation and alignment with national poverty reduction strategies and plans are emphasized to ensure strong country ownership. The document then outlines the COSOP for 2011-2015, including corporate and project level indicators, alignment with national strategies, current and potential future IFAD projects in the country, and how these projects align with IFAD's strategic objectives and areas of thematic focus.
Nepal's Programme of Action for 2001-2010 aims to alleviate poverty through broad-based growth, social sector development, and targeted programs. Agriculture growth of 4-5% annually is a priority, as is non-agriculture sector growth. Strategies include increased investment in agriculture, improved implementation of investment plans, and strengthening the private sector environment. Financial sector reforms involve restructuring state banks, improving standards, and strengthening regulation. The goals are sustainable growth that benefits the poor and improves income distribution.
14 Development Definitions And Measuring DevelopmentEcumene
There are several ways to measure development including economic, social, and environmental indicators. Economic indicators include GDP, GNP, and PPP but have limitations in capturing how wealth is distributed or environmental/social impacts. Social indices like the HDI and HPI provide a more holistic view by combining factors like education, health, and standard of living. Multiple component indices are useful for comparisons but don't show imbalances in their underlying indicators. An accurate overall assessment requires considering various factors from different perspectives.
Lesson 5 (poverty level & human resources)holycrackers
The document discusses poverty levels in Asia by analyzing factors like population growth, health indicators, literacy rates, employment, GDP, education, migration, and more. It recognizes that poverty is not solely economic and also involves issues like lack of basic needs, exploitation, discrimination, lack of opportunities and power. Nearly half the world's population, around 2.8-3 billion people, live in conditions of severe poverty, especially in Asia and Africa.
Emerging economies like China, India, Brazil and Russia will be among the largest in the world by 2050. They commonly started as agrarian societies and must now adapt to industrialization while developing education and respecting intellectual property. Problems include lack of education, imports, and institutional support for innovation. Solutions involve leveraging natural resources, adopting technologies, and increasing access to education. Infrastructure, corruption, and security also present challenges but can be addressed through improved policies, infrastructure investment, and anti-corruption efforts. Overall, emerging markets have strengths like large populations and growth potential, but also face threats like brain drain and weaknesses like underdeveloped infrastructure that can be overcome.
Socially Sustainable Development - Beyond Economic GrowthUNDP Policy Centre
The document discusses socially sustainable development and inclusive growth. It defines inclusive growth as both an outcome and a process that ensures everyone can participate in and benefit from economic growth. It situates inclusion in the development discourse and discusses how inclusion is guaranteed through rights. The document also discusses key issues in the global development agenda, including the evolution of concepts around sustainable development and green economy. It analyzes interactions between food, energy and water security, and outlines some structural issues and risks around food production globally and in different regions.
The document outlines the eight Millennium Development Goals established by the United Nations in 2000 to be achieved by 2015. The goals address issues such as eradicating extreme poverty and hunger, achieving universal primary education, promoting gender equality, reducing child mortality, improving maternal health, combating HIV/AIDS and other diseases, ensuring environmental sustainability, and developing a global partnership for development. Each goal contains specific targets and indicators to measure progress made toward the goals.
Transformation of the rural sector in Latin America and the Caribbean (LAC)FAO
Presentación de Deep Ford, Coordinador Regional para el Caribe de la FAO en el marco de la XXXIV Conferencia Regional de la FAO para América Latina y el Caribe #LARC34
Abstract presentation: Olanike Adedeji (Roadmap to Achieving Zero Unmet Need ...CNS www.citizen-news.org
This is the abstract presentation of Olanike Adedeji, which took place as part of the third session of #APCRSHR10 #Virtual on the theme of "Sexual and reproductive health and rights in the Pacific" | more details are online at www.bit.ly/apcrshr10virtual3 Thanks
The document discusses the relationship between international trade and the environment. It explains how unequal distribution of resources between nations encourages specialization and trade based on comparative advantage. Trade allows countries to consume goods even if they are not the most efficient producer. However, trade can also negatively impact the environment if countries overexploit their resources. The document outlines some policy options like pricing resources properly, improving efficiency, and assisting developing countries in environmental preservation and adaptation to climate change.
Armando Barrientos, Brooks World Poverty Institute, the University of Manchester, UK
a.barrientos@manchester.ac.uk
Post-Graduate Conference 2014, School of Social and International Studies, University of Bradford, October 31st 2014
Fabular Frames and the Four Ratio ProblemMajid Iqbal
Digital, interactive art showing the struggle of a society in providing for its present population while also saving planetary resources for future generations. Spread across several frames, the art is actually the rendering of real and speculative data. The stereographic projections change shape in response to prompts and provocations. Visitors interact with the model through speculative statements about how to increase savings across communities, regions, ecosystems and environments. Their fabulations combined with random noise, i.e. factors beyond control, have a dramatic effect on the societal transition. Things get better. Things get worse. The aim is to give visitors a new grasp and feel of the ongoing struggles in democracies around the world.
Stunning art in the small multiples format brings out the spatiotemporal nature of societal transitions, against backdrop issues such as energy, housing, waste, farmland and forest. In each frame we see hopeful and frightful interplays between spending and saving. Problems emerge when one of the two parts of the existential anaglyph rapidly shrinks like Arctic ice, as factors cross thresholds. Ecological wealth and intergenerational equity areFour at stake. Not enough spending could mean economic stress, social unrest and political conflict. Not enough saving and there will be climate breakdown and ‘bankruptcy’. So where does speculative design start and the gambling and betting end? Behind each fabular frame is a four ratio problem. Each ratio reflects the level of sacrifice and self-restraint a society is willing to accept, against promises of prosperity and freedom. Some values seem to stabilise a frame while others cause collapse. Get the ratios right and we can have it all. Get them wrong and things get more desperate.
Every business, big or small, deals with outgoing payments. Whether it’s to suppliers for inventory, to employees for salaries, or to vendors for services rendered, keeping track of these expenses is crucial. This is where payment vouchers come in – the unsung heroes of the accounting world.
TEST BANK Principles of cost accounting 17th edition edward j vanderbeck mari...Donc Test
TEST BANK Principles of cost accounting 17th edition edward j vanderbeck maria r mitchell.docx
Independent Study - College of Wooster Research (2023-2024) FDI, Culture, Glo...AntoniaOwensDetwiler
"Does Foreign Direct Investment Negatively Affect Preservation of Culture in the Global South? Case Studies in Thailand and Cambodia."
Do elements of globalization, such as Foreign Direct Investment (FDI), negatively affect the ability of countries in the Global South to preserve their culture? This research aims to answer this question by employing a cross-sectional comparative case study analysis utilizing methods of difference. Thailand and Cambodia are compared as they are in the same region and have a similar culture. The metric of difference between Thailand and Cambodia is their ability to preserve their culture. This ability is operationalized by their respective attitudes towards FDI; Thailand imposes stringent regulations and limitations on FDI while Cambodia does not hesitate to accept most FDI and imposes fewer limitations. The evidence from this study suggests that FDI from globally influential countries with high gross domestic products (GDPs) (e.g. China, U.S.) challenges the ability of countries with lower GDPs (e.g. Cambodia) to protect their culture. Furthermore, the ability, or lack thereof, of the receiving countries to protect their culture is amplified by the existence and implementation of restrictive FDI policies imposed by their governments.
My study abroad in Bali, Indonesia, inspired this research topic as I noticed how globalization is changing the culture of its people. I learned their language and way of life which helped me understand the beauty and importance of cultural preservation. I believe we could all benefit from learning new perspectives as they could help us ideate solutions to contemporary issues and empathize with others.
Optimizing Net Interest Margin (NIM) in the Financial Sector (With Examples).pdfshruti1menon2
NIM is calculated as the difference between interest income earned and interest expenses paid, divided by interest-earning assets.
Importance: NIM serves as a critical measure of a financial institution's profitability and operational efficiency. It reflects how effectively the institution is utilizing its interest-earning assets to generate income while managing interest costs.
Economic Risk Factor Update: June 2024 [SlideShare]Commonwealth
May’s reports showed signs of continued economic growth, said Sam Millette, director, fixed income, in his latest Economic Risk Factor Update.
For more market updates, subscribe to The Independent Market Observer at https://blog.commonwealth.com/independent-market-observer.
Falcon stands out as a top-tier P2P Invoice Discounting platform in India, bridging esteemed blue-chip companies and eager investors. Our goal is to transform the investment landscape in India by establishing a comprehensive destination for borrowers and investors with diverse profiles and needs, all while minimizing risk. What sets Falcon apart is the elimination of intermediaries such as commercial banks and depository institutions, allowing investors to enjoy higher yields.
University of North Carolina at Charlotte degree offer diploma Transcripttscdzuip
办理美国UNCC毕业证书制作北卡大学夏洛特分校假文凭定制Q微168899991做UNCC留信网教留服认证海牙认证改UNCC成绩单GPA做UNCC假学位证假文凭高仿毕业证GRE代考如何申请北卡罗莱纳大学夏洛特分校University of North Carolina at Charlotte degree offer diploma Transcript
1. LDC Graduation: Bangladesh Case
Presented by
Dr. Md. Nur Alam Miah
Divisional Head
Planning & Development Division
Bangladesh Sugarcrop Research Institute
Ishurdi-6620, Pabna
4. What is LDCs?
Low-income countries which
faced severe structural
handicaps to economic
growth and development and
needed access to support
beyond what was commonly
available for all developing
countries
Currently 47 countries on the
list of LDCs which is reviewed
every three years by CDP
Africa (33 countries) Asia
(9 countries) Oceania (4
countries) America (1
country)
Between 1975 and 1991,
no systematic reviews of
the list of LDCs
4
5. Common features among the LDCs
Dominance of agriculture
Limited capacity for
mobilizing domestic
resources
Low levels of labour
productivity
Low level of education
and an overall shortage of
skills
5
6. Lack of adequate
physical and
institutional
infrastructure
Economically small (by
population or national
income),
Undiversified natural
resource base
7. Creation of the LDC category
7
March-June
1964 First session of the United Nations Conference on Trade and Development
UNCTAD member States agreed that special attention was to be “paid to the less developed
among the developing countries, as an effective means of ensuring sustained growth with
equitable opportunity for each developing country”
January-
March 1968 Second session of the United Nations Conference on Trade and Development
Acknowledged the need to alleviate the problems of underdevelopment in the less
developed countries
Requested the Secretary-General to carry out a comprehensive examination of the special
problems of the LDCs and to recommend special measures for dealing with them
December
1969 24th session of the United Nations General Assembly
Acknowledged the need to alleviate the problems of underdevelopment in the less developed
countries
Requested the Secretary-General to carry out a comprehensive examination of the
special problems of the LDCs and to recommend special measures for dealing with them
8. 8
March 1970 6th session of the Committee for Developing Planning (CDP)
Formed a working group to define the methodology for identifying LDCs
December
1970 25th session of the United Nations General Assembly
Reiterated the urgency of formal identification of LDCs
March 1971 7th session of the Committee for Developing Planning (CDP)
Determined the initial criteria for identification of LDCs to be low per capita gross domestic
product (GDP) and the presence of structural impediments to growth
Identified a tentative list of 25 countries as LDCs based on these criteria
December
1971 26th session of the United Nations General Assembly
Formally endorsed the list of the 25 LDCs
9. Evolution of LDC criteria
9
1971
LDCs are countries with very low levels of per capita gross domestic product facing the most severe obstacles to
development
GDP
per
capita Adult literacy rate Share of manufacturing in GDP
1991
LDCs are low-income countries suffering from long-term handicaps to growth, in particular, low levels of
human resource development and/or severe structural weaknesses
GDP
per
capita Augmented physical quality of life (APQL) Economic diversification index (EDI)
Life expectancy at birth
Per capita calorie supply
Combined primary and secondary school
enrolment ratio
Adult literacy rate
Export concentration ratio
Share of manufacturing in GDP
Share of employment in industry
Per capita electricity consumption
1999
LDCs are low-income countries suffering from low level of human resources and a high degree
of economic vulnerability
GDP per
capita Augmented physical quality of life (APQL) Economic vulnerability index (EVI)
Under-five mortality rate
Average calorie intake per capita as a
percentage of the requirement
Combined primary and secondary school
enrolment ratio
Adult literacy rate
Population size
Export concentration
Share of manufacturing and modern services in
GDP
Instability of exports of goods and services
Instability of agricultural production
10. 10
2002
LDCs are low-income countries suffering from low level of human resources and a high degree of
economic vulnerability
GNI per capita Human assets index (HAI) Economic vulnerability index (EVI)
Under-five mortality rate
Average calorie intake per capita as
a percentage of the requirement
Gross secondary school
enrolment ratio
Adult literacy rate
Population size
Export concentration
Share of manufacturing and modern
services in GDP
Instability of exports of goods and
services
Instability of agricultural production
2005
LDCs are low-income countries suffering from low level of human resources and a high degree of
economic vulnerability
GNI per capita Human assets index (HAI) Economic vulnerability index (EVI)
Under-five mortality rate
Percentage of population
undernourished
Gross secondary school enrolment
ratio
Adult literacy rate
Population
Remoteness
Merchandise export concentration
Share of agriculture, forestry and
fishing in GDP
Instability of exports of goods and
services
Homelessness due to natural
disasters
Instability of agricultural production
11. 11
2011
LDCs are low-income countries suffering from the most severe structural impediments to
sustainable development
GNI per capita Human assets index (HAI) Economic vulnerability index (EVI)
Under-five mortality rate
Percentage of population
undernourished
Gross secondary school enrolment
ratio
Adult literacy rate
Population
Remoteness
Merchandise export concentration
Share of agriculture, forestry and
fishing in GDP
Share of population in low
elevated coastal zones
Instability of exports of goods and
services
Victims of natural disasters
Instability of agricultural production
2017
LDCs are low-income countries suffering from the most severe structural impediments to sustainable
development
GNI per capita Human assets index (HAI) Economic vulnerability index (EVI)
Under-five mortality rate
Percentage of population
undernourished
Maternal mortality ratio
Gross secondary school enrolment
ratio
Adult literacy rate
Population
Remoteness
Merchandise export concentration
Share of agriculture, forestry and
fishing in GDP
Share of population in low elevated
coastal zones
Instability of exports of goods and
services
Victims of natural disasters
Instability of agricultural production
12. Programme of action for LDCs?
Programme of Action for the
Least Developed Countries
for the Decade 2011-2020,
Istanbul, Turkey, May 2011
Enable half the number
of LDCs to meet the
criteria for graduation by
2020
Target: 24 countries
12
https://www.gettyimages.com/event/istanbul-programme-of-action-for-
the-least-developed-countries-642473083
13. Committee for Development Policy (CDP)
• The organ officially mandated
by the ECOSOC and the UNGA
to identify and make
recommendations on which
countries should belong to the
LDC category
• A subsidiary body of the
ECOSOC
• Responsible for under-taking,
once every three years, a
review of the list of least
developed countries (LDCs)
13
15. Eligibility procedure for inclusion
15
January
expert
group
review
CDP (Committee for Development Policy)
Preliminary finding: country satisfies inclusion criteria
DESA (Development of Economic and Social
Affairs)
Notifies the country of preliminary finding
Between
the
expert
group
review
and the
triennial
review
DESA
Prepares a country assessment note and provides a
draft to the country
Country
Presents a written statement (optional), indicating
approval of or objection to the inclusion
16. 16
March
triennial
review
CDP
Finds the country eligible
DESA
Formally notifies the country of eligibility conclusion
CDP
Submits to ECOSOC the recommendation to include the country,
unless the country formally expresses objection
After the
March
triennial
review
ECOSOC
Endorses the CDP recommendation
Country
Formally notifies the Secretary-General of its acceptance
General Assembly
Decides to take note of the CDP recommendation
Country immediately becomes an LDC and is formally added to the list
17. Inclusion criteria
Identification of Eligible
Countries
The inclusion thresholds, as
determined by the CDP, must
be met for each of the three
criteria in one triennial
review
The Population must be no
larger than 75 million
inhabitants
GNI per
capita
Human
Assets Index
(HAI)
Economic
Vulnerability
Index
(EVI)
$1,025 or
below
60 or below 36 or above
17
18. Per capita GNI (Atlas method)
• Per capita GNI
using the World
Bank Atlas method
has outstripped
the LDC average
since 1996 and has
recently risen
above the
threshold used by
the CDP
18
19. Progress in EVI and HAI
19
0.00
5.00
10.00
15.00
20.00
25.00
30.00
35.00
EVI threshold (2018)
0.00
10.00
20.00
30.00
40.00
50.00
60.00
70.00
80.00
HAI threshold (2018)
20. Gross national income (GNI) per capita
Rationale
Provides information on the income status
and the overall level of resources available
to a country
Thresholds
The inclusion threshold - the three-
year average of the level of GNI per
capita. At the 2018 review it was $
1,025.
The graduation threshold- 20% above
the inclusion threshold. At the 2018
review- $ 1,230.
The income-only graduation
threshold is twice the graduation
threshold. At the 2018 review - $ 2,460.
Methodology
GNI is calculated from
national accounts data
converted into USD using
the World Bank Atlas
method
GNI per capita is derived by
dividing GNI in USD by the
annual population of a
country
Data sources
United Nations Statistics
Division
United Nations Population
Division
20
22. Human Assets Index (HAI)
Rationale
A measure of level of human
capital
Low levels of human assets
indicate major structural
impediments to sustainable
development
Thresholds
The inclusion threshold = 60
The graduation threshold
=66 (10 per cent above the
inclusion threshold)
22
25. Rationale
A measure of structural
vulnerability to economic
and environmental shocks
High vulnerability indicates
major structural
impediments to
sustainable development
Thresholds
The inclusion threshold =36
The graduation threshold =
32 (10 per cent below the
inclusion threshold)
Economic Vulnerability Index (EVI)
29. Bangladesh status (2018 triennial review)
Criterian 2018 CDP BBS
GNI >US$1230 US$1272 US$1274
HAI >66 72.8 73.2
EVI <32 25 25.2
29
30. Time
frame
of
the
eligibility
procedure
Year 0
(first
triennial
review)
CDP Finds country eligible for the first time (eligibility needs to be
reconfirmed at the next triennial review)
DESA Notifies the country of the first finding
Between
years 0 and
3
(between
first and
second
triennial
review)
UNCTAD Prepares a vulnerability profile and provides a draft to the
country
DESA Prepares an ex ante impact assessment and provides a draft to
the country
Country Provides comments on the drafts of the UNCTAD profile and
the DESA assessment (optional); may present its view on graduation
at the CDP expert group meeting preceding the second triennial
review
Year 3
(second
triennial
review)
CDP Confirms eligibility (second finding); submits the
recommendation to ECOSOC, taking into account the graduation
criteria and additional information (country statements, the DESA
assessment, and the UNCTAD profile)
ECOSOC Endorses the CDP recommendation
General Assembly Takes note of the CDP recommendation 30
31. Between
years 3 and
6
Graduating Country
Establishes consultative mechanism; prepares the transition strategy;
reports to the CDP on the preparation of the strategy (optional)
UNDP Facilitates consultative group; provides support upon request
UN System Provides targeted assistance and capacity-building upon
request
Development and trading partners Participate in consultative
mechanism
CDP Monitors development progress of the country during the period;
reports annually to ECOSOC
Year 6
Graduation becomes effective, country is no longer in the LDC
category
31
Time frame of the eligibility procedure
32. After
year 6
(after
graduati
on)
Graduated country
Implements and monitors the transition strategy; voluntarily
submits to the CDP progress reports on its implementation
annually for the first three years after graduation, and triennially
at two triennial reviews
Development and trading partners
Support the implementation of the transition strategy; avoid
abrupt reduction of LDC-specific support
CDP
Monitors development progress of graduated country; reports to
ECOSOC annually for the first three years after the country’s
graduation, and triennially at two triennial reviews
32
33. Asymmetries between the inclusion and graduation processes
Criteria Inclusion Graduation
Number of criteria to be
met
Three Two
Threshold of criteria Established by the CDP Set at higher level than
inclusion
Population threshold Smaller than 75 million Not relevant
Eligibility Determined once Determined twice
(over consecutive
reviews)
Timing Effective immediately Preparatory period (three
years)
Approval by country Required Not required
33
34. Graduation timeline
Graduation
Year
Country Year of statistical
pre-eligibility for
graduation
Met criteria
1994 Botswana 1991 Income (GDP per capita) + Augmented
physical quality of life (APQL)
2007 Cabo Verde 1997 GNI per capita + HAI
2011 Maldives 1997 GNI per capita + HAI
2014 Samoa 1991 Not retained due
to probable impact of
ODA reduction, 2003-
following 2009 tsunami
GNI per capita + HAI
2017 Equatorial
Guinea
2006 Income only
2020 Vanuatu * 1994 pending
completion of
vulnerability review,
2006 deferred
graduation
Income, HAI
34
35. 2021 Angola * 2012 Income only
2021 Bhutan * 2015 Income, HAI
2021 Nepal * 2015 HAI, EVI
2021 Sao Tome and
Principe *
2015 Income, HAI
2021 Solomon Islands * 2015 Income, HAI
2021 Timor-Leste * 2015 Income only
2024 Afghanistan (may be delayed, in view
of its lingering security concerns)
2018 HAI, EVI
2024 Bangladesh 2018 Income, HAI, EVI
2024 Djibouti 2018 Income, HAI, EVI
2024 Lao People’s Democratic Republic 2018 Income, EVI
2024 Myanmar 2018 HAI, EVI
2024 Yemen (May be delayed, in view of its
lingering security concerns)
2018 HAI, EVI (2018);
Income, HAI, EVI
(2021)
35
Graduation timeline
36. March 2018 and onward
Country Actions
Remains in the LDC category and is entitled to receive all benefits
available to LDCs
Prepares a national transition strategy and establishes a
consultative mechanism to facilitate its preparation in cooperation
with development partners
May seek assistance from the United Nations system in the
preparation of the transition strategy
Voluntarily reports on the preparation of the transition strategy to the
CDP on an annual basis
CDP actions
Monitors the development progress of the country and submits an
annual report to ECOSOC
Report provides information on the preparation of the transition strategy,
if provided by the country
36
37. Smooth transition strategy
Aims to ensure that
development efforts are not
disrupted by graduation
Focuses on expected
implications of loss of LDC
status and associated special
support measures
Presents a comprehensive and
coherent set of specific
measures
37
http://www.dailynews.lk/2018/01/18/business/140252/bangladesh-exports-
await-blow-graduating-ldc
38. International support measures for LDCs
International trade
development
assistance (technical
& financial)
general support and
other forms of
assistance
38
http://drvidyahattangadi.com/some-inspiring-self-
sufficient-indian-villages/
39. Support measures and special treatment related to trade
Preferential market access: goods
and services
Special and differential treatment
(SDT) related to WTO obligations
((i) increased market access; (ii)
safeguarding of the interests of
LDCs; (iii) increased flexibility for
LDCs in rules and disciplines
governing trade measures; (iv)
extension of longer transitional
periods to LDCs; and (v) provision
of technical assistance
Support measures related to
capacity-building in trade
39
https://bridgeafricaconsulting.com/services/logistics-and-trade-
support-services-in-africa/
40. Official development assistance (ODA)
Bilateral assistance
0.15- 0.20 per cent of
their GNI
Multilateral assistance
(UNCDF, UNFCCC)
UN Capital
Development Fund
UN Framework
Convention on Climate
Change
40
41. General Support
Travel benefits, scholarships
and research grants
Budget gaps
Support for graduation from
the LDC category
41
42. Loss from graduation
Erosion of preferences
export loss (8% of export
(CPD), 5.5-7.5 (UNCTAD)
No DF-QF market access
SDT provisions for the LDCs
in the WTO
From low cost IDA- high cost
IRBD
preferential climate financing
from infrastructure
development fund, climate
change adaptation funds and
technology-related green
climate fund
Shrinking ODA (7% of total
ODA)