Download to read offline
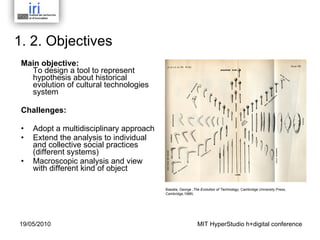
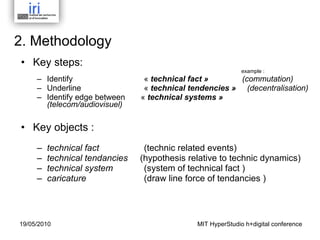
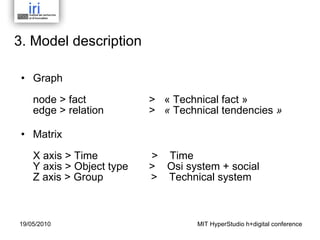

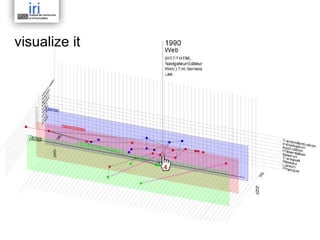

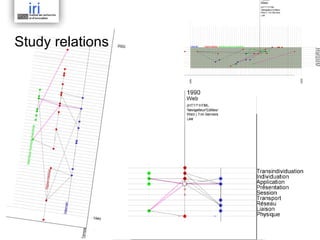
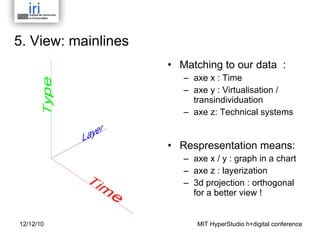
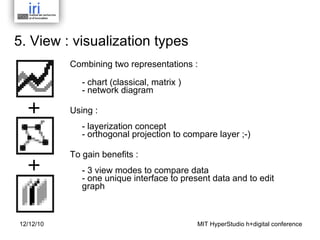
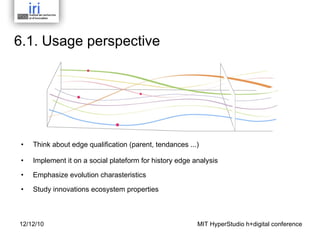
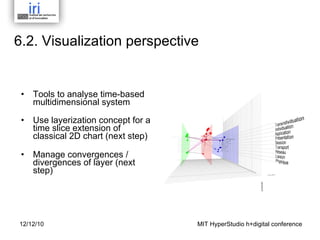

The document discusses a methodology for modeling the evolution of cultural technologies systems over time using layered and temporally located graphs. Key aspects of the methodology include identifying technical facts and tendencies, representing them as nodes and edges in a graph, and visualizing the graph using a 3D model with axes for time, object type, and technical system or group. The tool would allow users to define a dataset representing these elements and relations, and interact with the visual representation in order to analyze relationships and characteristics of technological evolution.


