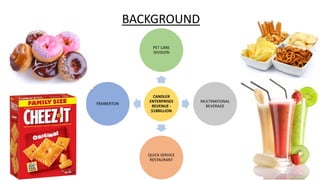
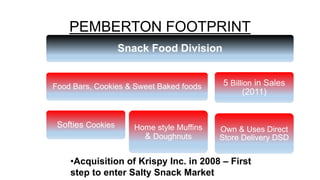
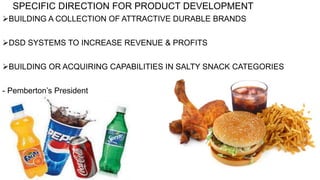
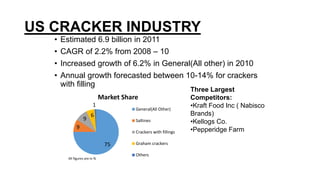
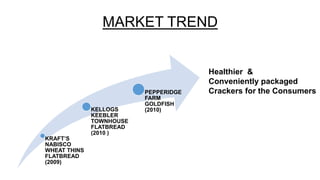
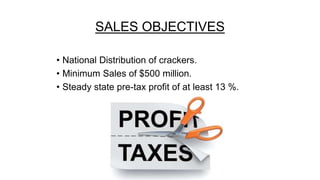
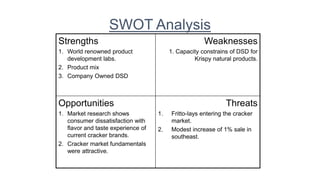
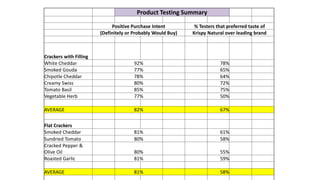
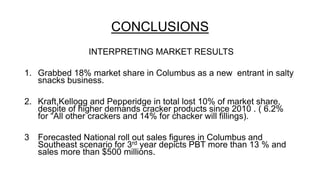
Launching Krispy Natural: Cracking
The Product Management Code
Harvard Business School Case
BACKGROUND
CANDLER
ENTERPRISES
REVENUE -
$18BILLION
PET CARE
DIVISION
MULTINATIONAL
BEVERAGE
QUICK SERVICE
RESTAURANT
PEMBERTON
PEMBERTON FOOTPRINT
Snack Food Division
Food Bars, Cookies & Sweet Baked foods
Softies Cookies Home style Muffins
& Doughnuts
5 Billion in Sales
(2011)
Own & Uses Direct
Store Delivery DSD
•Acquisition of Krispy Inc. in 2008 – First
step to enter Salty Snack Market
SPECIFIC DIRECTION FOR PRODUCT DEVELOPMENT
BUILDING A COLLECTION OF ATTRACTIVE DURABLE BRANDS
DSD SYSTEMS TO INCREASE REVENUE & PROFITS
BUILDING OR ACQUIRING CAPABILITIES IN SALTY SNACK CATEGORIES
- Pemberton’s President
US CRACKER INDUSTRY
• Estimated 6.9 billion in 2011
• CAGR of 2.2% from 2008 – 10
• Increased growth of 6.2% in General(All other) in 2010
• Annual growth forecasted between 10-14% for crackers
with filling
75
9
9
6
1
Market Share
General(All Other)
Saltines
Crackers with fillings
Graham crackers
Others
All figures are in %
Three Largest
Competitors:
•Kraft Food Inc ( Nabisco
Brands)
•Kellogs Co.
•Pepperidge Farm
2009 Krispy Sales Performance
2009 Krispy Single-Serve Sales Performance vs. Plan ($
millions)
Plan 2009 Actual % to Plan
Krispy Retail $97.50 $50.80 52.10%
Krispy Vend $23.40 $18.00 76.90%
Total Krispy Single-
Serve $120.90 $68.80 56.90%
MARKET & CONSUMERS
Mintel Study
• 74% respondents consumed crackers on regular basis.
• 34% ate them as part of Regular Diet
• 53% considered overall Healthfulness
KRAFT’S
NABISCO
WHEAT THINS
FLATBREAD
(2009)
KELLOGS
KEEBLER
TOWNHOUSE
FLATBREAD
(2010 )
PEPPERIDGE
FARM
GOLDFISH
(2010)
Healthier &
Conveniently packaged
Crackers for the Consumers
MARKET TREND
Krispy Single Serve v/s Krispy Natural
Krispy Natural
Re Launch
Krispy Single
Serve
KRISPY NATURAL PRODUCT
STRATEGY
• Increasing Package sizes to Multiple servings
• Improving taste by introducing new flavors
• Healthfulness – An important Factor
100% whole wheat
Natural Ingredients
MARKETING STRATEGY
• Competitors favored to
promote productsPUSH
STRATEGY
• Focus on Extensive
advertising &
merchandising
• Aggressive plans for
Trade promotions
PULL
STRATEGY
DISTRIBUTION
• DSD system –May not work for Cracker business. So
Pemberton hired “Krispy force” for distribution system.
• Longer Shelf life of Crackers
• Present capacity of Trucks poor
SALES OBJECTIVES
• National Distribution of crackers.
• Minimum Sales of $500 million.
• Steady state pre-tax profit of at least 13 %.
SWOT Analysis
Strengths
1. World renowned product
development labs.
2. Product mix
3. Company Owned DSD
Weaknesses
1. Capacity constrains of DSD for
Krispy natural products.
Opportunities
1. Market research shows
consumer dissatisfaction with
flavor and taste experience of
current cracker brands.
2. Cracker market fundamentals
were attractive.
Threats
1. Fritto-lays entering the cracker
market.
2. Modest increase of 1% sale in
southeast.
Product Testing Summary
Positive Purchase Intent % Testers that preferred taste of
(Definitely or Probably Would Buy) Krispy Natural over leading brand
Crackers with Filling
White Cheddar 92% 78%
Smoked Gouda 77% 65%
Chipotle Cheddar 78% 64%
Creamy Swiss 80% 72%
Tomato Basil 85% 75%
Vegetable Herb 77% 50%
AVERAGE 82% 67%
Flat Crackers
Smoked Cheddar 81% 61%
Sundried Tomato 80% 58%
Cracked Pepper &
Olive Oil 80% 55%
Roasted Garlic 81% 59%
AVERAGE 81% 58%
MARKET SHARE
All other Cracker Buisness(in Millions) 5100
Ceackers with fillings(In Millions) 660
Manufacturer sales of "All Other" Crackers % Lost
In 2009 In 2010
Kraft 37.80% 37.00% -0.80%
Kellogg 28.90% 28.10% -0.80%
-1.60%
Market loss in Millions -81.60
In 2010
Manufacturer sales of Crackers with Filling
2009%
Share 2010% Share
Kraft 34.70% 32.70% -2.00%
Lance 31.50% 29.90% -1.60%
-3.60%
Market loss in Millions -23.76
Crackers with filling segment growth of opportunity is 10-14%
Estimated Dollar Shares of Market
In 2011 in 2011
Columbus Southeast
Pretest
Market
Post
% Market
lost
Pretest
Market
Post
Kraft 40% 33% -7% 34% 32%
Kellogg 25% 22% -3% 23% 22%
Pepperi
dge
Farm 11% 10% -1% 10% 10%
Krispy 0% 18% 18% 9% 10%
SALES POTENTIALS
Columbus Scenario(in billions)
At 18 % Market share
Sales 1.30
COGS 0.98496
Gross Profit 0.31
Advertising 0.033
Merchandising 0.037
PBT 0.24
Pretax
Contribution 18% of sales
Southeast Scenario(in billions)
At 9 % Market share
Sales 0.65
COGS 0.49248
Gross Profit 0.16
Advertising 0.033
Merchandising 0.037
PBT 0.09
Pretax
Contribution 13% of sales
At 14% market share
Sales 1.01
COGS 0.76608
Gross Profit 0.24
Advertising 0.033
Merchandising 0.037
PBT 0.17
Pretax
Contribution 16% of sales
CONCLUSIONS
INTERPRETING MARKET RESULTS
1. Grabbed 18% market share in Columbus as a new entrant in salty
snacks business.
2. Kraft,Kellogg and Pepperidge in total lost 10% of market share,
despite of higher demands cracker products since 2010 . ( 6.2%
for “All other crackers and 14% for chacker will fillings).
3 Forecasted National roll out sales figures in Columbus and
Southeast scenario for 3rd year depicts PBT more than 13 % and
sales more than $500 millions.
POSSIBLE COMPETITIVE RESPONSES TO NEW
BRAND “FRITTO-LAY”
• Launching more new product mix as per customer taste and
keeping health as a priority concern.
• Optimization of DSD system for Krispy natural product for cost
reductions.
RECOMMENDED FOR A NATIONAL
ROLLOUT
1. More than 60% tasters preferred taste of Krispy natural over other leading
brands.
2. Positive Purchase intent of 81%.
This presentation has
been created by Kshitij
Chaudhari, VIT Chennai,
during a marketing
internship under the
guidance of Prof. Sameer
Mathur, IIM Lucknow.

Launching Krispy Natural: Cracking the Product Management Code

  • 1.
    Launching Krispy Natural:Cracking The Product Management Code Harvard Business School Case
  • 2.
  • 3.
    PEMBERTON FOOTPRINT Snack FoodDivision Food Bars, Cookies & Sweet Baked foods Softies Cookies Home style Muffins & Doughnuts 5 Billion in Sales (2011) Own & Uses Direct Store Delivery DSD •Acquisition of Krispy Inc. in 2008 – First step to enter Salty Snack Market
  • 4.
    SPECIFIC DIRECTION FORPRODUCT DEVELOPMENT BUILDING A COLLECTION OF ATTRACTIVE DURABLE BRANDS DSD SYSTEMS TO INCREASE REVENUE & PROFITS BUILDING OR ACQUIRING CAPABILITIES IN SALTY SNACK CATEGORIES - Pemberton’s President
  • 5.
    US CRACKER INDUSTRY •Estimated 6.9 billion in 2011 • CAGR of 2.2% from 2008 – 10 • Increased growth of 6.2% in General(All other) in 2010 • Annual growth forecasted between 10-14% for crackers with filling 75 9 9 6 1 Market Share General(All Other) Saltines Crackers with fillings Graham crackers Others All figures are in % Three Largest Competitors: •Kraft Food Inc ( Nabisco Brands) •Kellogs Co. •Pepperidge Farm
  • 6.
    2009 Krispy SalesPerformance 2009 Krispy Single-Serve Sales Performance vs. Plan ($ millions) Plan 2009 Actual % to Plan Krispy Retail $97.50 $50.80 52.10% Krispy Vend $23.40 $18.00 76.90% Total Krispy Single- Serve $120.90 $68.80 56.90%
  • 7.
    MARKET & CONSUMERS MintelStudy • 74% respondents consumed crackers on regular basis. • 34% ate them as part of Regular Diet • 53% considered overall Healthfulness
  • 8.
  • 9.
    Krispy Single Servev/s Krispy Natural Krispy Natural Re Launch Krispy Single Serve
  • 10.
    KRISPY NATURAL PRODUCT STRATEGY •Increasing Package sizes to Multiple servings • Improving taste by introducing new flavors • Healthfulness – An important Factor 100% whole wheat Natural Ingredients
  • 11.
    MARKETING STRATEGY • Competitorsfavored to promote productsPUSH STRATEGY • Focus on Extensive advertising & merchandising • Aggressive plans for Trade promotions PULL STRATEGY
  • 12.
    DISTRIBUTION • DSD system–May not work for Cracker business. So Pemberton hired “Krispy force” for distribution system. • Longer Shelf life of Crackers • Present capacity of Trucks poor
  • 13.
    SALES OBJECTIVES • NationalDistribution of crackers. • Minimum Sales of $500 million. • Steady state pre-tax profit of at least 13 %.
  • 14.
    SWOT Analysis Strengths 1. Worldrenowned product development labs. 2. Product mix 3. Company Owned DSD Weaknesses 1. Capacity constrains of DSD for Krispy natural products. Opportunities 1. Market research shows consumer dissatisfaction with flavor and taste experience of current cracker brands. 2. Cracker market fundamentals were attractive. Threats 1. Fritto-lays entering the cracker market. 2. Modest increase of 1% sale in southeast.
  • 15.
    Product Testing Summary PositivePurchase Intent % Testers that preferred taste of (Definitely or Probably Would Buy) Krispy Natural over leading brand Crackers with Filling White Cheddar 92% 78% Smoked Gouda 77% 65% Chipotle Cheddar 78% 64% Creamy Swiss 80% 72% Tomato Basil 85% 75% Vegetable Herb 77% 50% AVERAGE 82% 67% Flat Crackers Smoked Cheddar 81% 61% Sundried Tomato 80% 58% Cracked Pepper & Olive Oil 80% 55% Roasted Garlic 81% 59% AVERAGE 81% 58%
  • 16.
    MARKET SHARE All otherCracker Buisness(in Millions) 5100 Ceackers with fillings(In Millions) 660 Manufacturer sales of "All Other" Crackers % Lost In 2009 In 2010 Kraft 37.80% 37.00% -0.80% Kellogg 28.90% 28.10% -0.80% -1.60% Market loss in Millions -81.60 In 2010 Manufacturer sales of Crackers with Filling 2009% Share 2010% Share Kraft 34.70% 32.70% -2.00% Lance 31.50% 29.90% -1.60% -3.60% Market loss in Millions -23.76 Crackers with filling segment growth of opportunity is 10-14% Estimated Dollar Shares of Market In 2011 in 2011 Columbus Southeast Pretest Market Post % Market lost Pretest Market Post Kraft 40% 33% -7% 34% 32% Kellogg 25% 22% -3% 23% 22% Pepperi dge Farm 11% 10% -1% 10% 10% Krispy 0% 18% 18% 9% 10%
  • 17.
    SALES POTENTIALS Columbus Scenario(inbillions) At 18 % Market share Sales 1.30 COGS 0.98496 Gross Profit 0.31 Advertising 0.033 Merchandising 0.037 PBT 0.24 Pretax Contribution 18% of sales Southeast Scenario(in billions) At 9 % Market share Sales 0.65 COGS 0.49248 Gross Profit 0.16 Advertising 0.033 Merchandising 0.037 PBT 0.09 Pretax Contribution 13% of sales At 14% market share Sales 1.01 COGS 0.76608 Gross Profit 0.24 Advertising 0.033 Merchandising 0.037 PBT 0.17 Pretax Contribution 16% of sales
  • 18.
    CONCLUSIONS INTERPRETING MARKET RESULTS 1.Grabbed 18% market share in Columbus as a new entrant in salty snacks business. 2. Kraft,Kellogg and Pepperidge in total lost 10% of market share, despite of higher demands cracker products since 2010 . ( 6.2% for “All other crackers and 14% for chacker will fillings). 3 Forecasted National roll out sales figures in Columbus and Southeast scenario for 3rd year depicts PBT more than 13 % and sales more than $500 millions.
  • 19.
    POSSIBLE COMPETITIVE RESPONSESTO NEW BRAND “FRITTO-LAY” • Launching more new product mix as per customer taste and keeping health as a priority concern. • Optimization of DSD system for Krispy natural product for cost reductions.
  • 20.
    RECOMMENDED FOR ANATIONAL ROLLOUT 1. More than 60% tasters preferred taste of Krispy natural over other leading brands. 2. Positive Purchase intent of 81%.
  • 21.
    This presentation has beencreated by Kshitij Chaudhari, VIT Chennai, during a marketing internship under the guidance of Prof. Sameer Mathur, IIM Lucknow.