Download to read offline
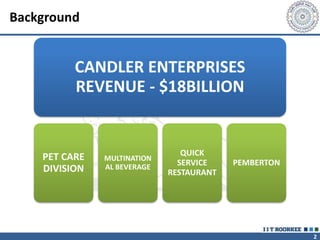
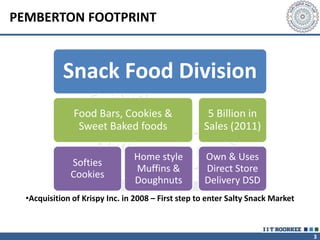
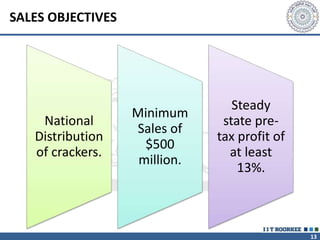
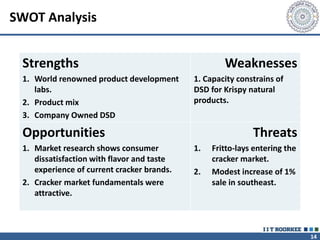
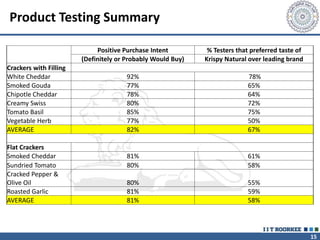
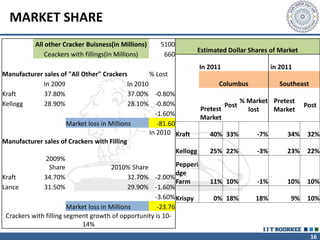
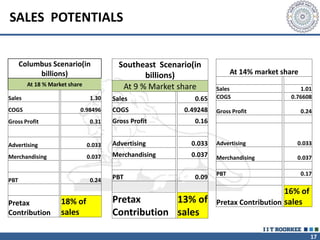
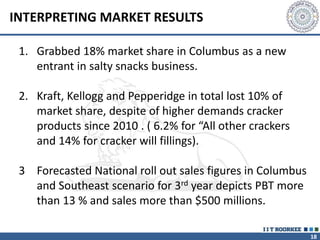


Krispy Natural is a new cracker product being developed by Pemberton Enterprises to enter the salty snack market. Market testing in Columbus showed the product gained 18% market share, taking share from competitors. Testing also showed high preference for Krispy Natural's taste and positive purchase intent. Sales projections estimate the product could reach $500 million in sales nationally. Given the strong market testing results, a national rollout of Krispy Natural is recommended.


