Program: Develop aprogram to implement Principal Component Analysis (PCA) for reducing the dimensionality of
the Iris dataset from 4 features to 2.
Aim: To understand the concept of dimensionality reduction and PCA (Principal Component Analysis) to reduce the
complexity of the dataset while preserving the most important information, thereby facilitating better understanding and
visualization.
EXPERIMENT- 3
4.
Program: Develop aprogram to implement Principal Component Analysis (PCA) for reducing the dimensionality of
the Iris dataset from 4 features to 2.
Aim: To understand the concept of dimensionality reduction and PCA (Principal Component Analysis) to reduce the
complexity of the dataset while preserving the most important information, thereby facilitating better understanding and
visualization.
EXPERIMENT- 3
Principal Component Analysis (PCA):
PCA is a dimensionality reduction technique used to reduce the number of variables (features) in a dataset while retaining as much
information as possible. It transforms the original variables into a new set of uncorrelated variables called principal components. These
principal components are ordered in such a way that the first few retain most of the variation present in the original variables.
Steps Involved in PCA:
1. Standardization: Since PCA is affected by the scale of the variables, we first standardize the dataset (mean=0, variance=1) if the
variables are on different scales.
2. Covariance Matrix Computation: Calculate the covariance matrix to understand how variables in the dataset are related to each
other.
3. Eigenvalues and Eigenvectors: Compute the eigenvalues and eigenvectors of the covariance matrix. Eigenvectors represent the
direction of the principal components, while eigenvalues represent the magnitude of variance explained by each principal component.
5.
PCA with theIris Dataset:
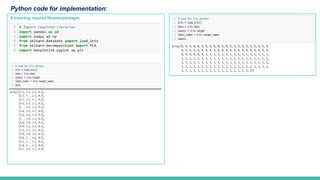
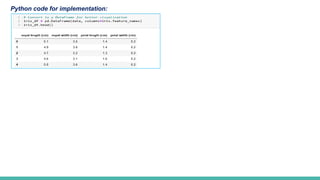
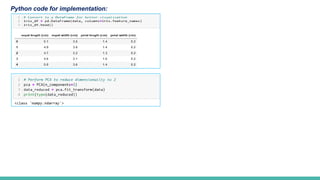
In the Iris dataset, we have four features: sepal length, sepal width, petal length, and petal width. Using PCA, we reduce these
four features to two principal components while retaining most of the variation present in the original dataset. This helps in
visualizing the dataset in a two-dimensional space and can simplify further analysis.
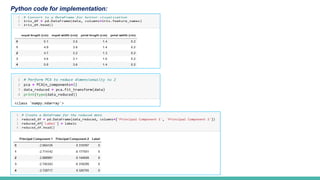
By applying PCA, we transform the original 4-dimensional data into a 2-dimensional space, making it easier to visualize and
interpret while preserving the inherent structure and patterns in the data.
4. Sorting Eigenvalues and Eigenvectors: Sort the eigenvalues in descending order and their corresponding eigenvectors.
The principal components are determined by these eigenvectors.
5. Forming the Principal Components: Select the top k eigenvectors to form the new feature space, where k is the desired
number of dimensions (2 in this case).
6. Transforming the Dataset: Project the original dataset onto the new feature space using the selected eigenvectors to
obtain the reduced dimensions.
Conclusion:
In this experiment,Principal Component Analysis (PCA) was effectively utilized to reduce the dimensionality of the Iris
dataset from four features to two principal components. This reduction in dimensions facilitated the visualization of the data
in a two-dimensional scatter plot, making it easier to observe and interpret the patterns within the dataset.
Overall, the experiment demonstrated the power of PCA as a dimensionality reduction technique, allowing for efficient data
visualization and analysis while maintaining the core information of the dataset. This approach can be applied to other high-
dimensional datasets to achieve similar benefits, aiding in better data understanding and decision-making processes.
16.
! Expected vivaQuestions ??
1. What is Principal Component Analysis (PCA)?
PCA is a dimensionality reduction technique that transforms a large set of variables into a smaller set while preserving as much variance as
possible. It identifies new variables (principal components) that are linear combinations of the original variables.
2. Why is PCA important in data analysis?
PCA helps to reduce the complexity of high-dimensional data, making it easier to visualize and interpret. It also helps in reducing noise and
improving the performance of machine learning models.
3. What are the main steps involved in performing PCA?
The main steps are:
1. Standardize the data.
2. Compute the covariance matrix.
3. Compute the eigenvalues and eigenvectors of the covariance matrix.
4. Select the principal components based on the largest eigenvalues.
5. Transform the original data into the new feature space.
4. Why do we standardize the data before applying PCA?
Standardization ensures that all features contribute equally to the analysis by giving them a mean of 0 and a standard deviation of 1. It
prevents features with larger scales from dominating the principal components.
5. What does the eigenvalue represent in PCA?
The eigenvalue represents the amount of variance captured by each principal component. Higher eigenvalues indicate components that
capture more variance in the data.
17.
Note: Not tolimit with the above listed question, any possible questions relevant to the topic may be asked and should be prepared.
6. How do we decide the number of principal components to retain?
The number of principal components is chosen based on the explained variance. A common approach is to select enough
components to capture a desired percentage of the total variance (e.g., 95%).
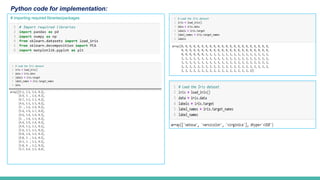
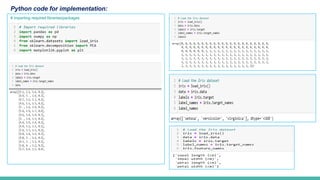
7. How is the Iris dataset structured?
The Iris dataset consists of 150 samples, each with 4 features: sepal length, sepal width, petal length, and petal width. There are
three classes: Iris-setosa, Iris-versicolor, and Iris-virginica, each with 50 samples.
8. What do the principal components represent in the context of the Iris dataset?
The principal components represent new features that are linear combinations of the original features. They capture the most
important patterns and variations in the Iris dataset.
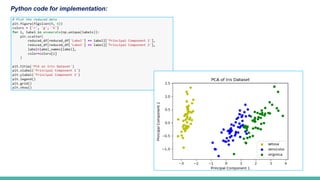
9. How do we interpret the PCA plot for the Iris dataset?
The PCA plot shows the data points in the new 2-dimensional space formed by the first two principal components. Points are
color-coded based on their target class, allowing us to visualize the separation between classes.
10. What are some limitations of PCA?
PCA assumes linear relationships between variables and may not capture complex nonlinear patterns. It is also sensitive to
outliers, which can distort the principal components.
18.
Links to learnmore…
https://scikit-learn.org/stable/modules/generated/sklearn.decomposition.PCA.html
https://matplotlib.org/stable/api/_as_gen/matplotlib.pyplot.scatter.html
https://scikit-learn.org/stable/auto_examples/decomposition/plot_pca_iris.html