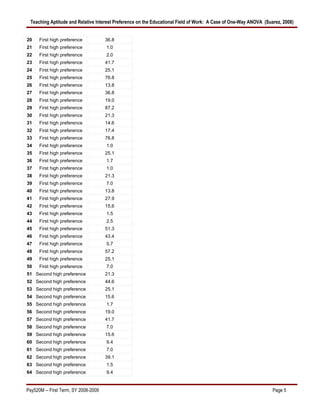
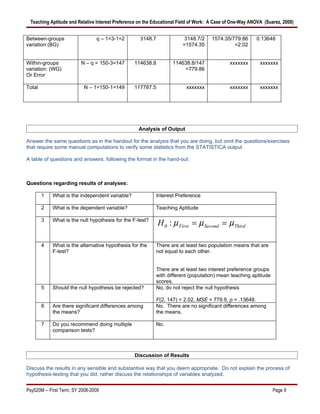
Teaching Aptitude and Relative Interest Preference on the Educational Field of Work: A Case of One-Way ANOVA (Suarez, 2008)


PSY520M/PSY522M
Template for Project


 Name: SUAREZ, FLORABEL S.                                                                                           DLSU ID# 10797637


INSTRUCTION:

1. Fill in the answers or details required in this template, but do not delete any instructions that the instructor has
   written.
2. Staple the completed template and put it in a short brown envelope with your name on it.
3. Please submit the completed template on Tuesday of the fourteenth week of the term.


                                                                   Analysis

What analysis has been assigned for you to do? (Please check.)

   O          one-way ANOVA with more than two IV categories
     O         repeated measures with more than two IV categories
     O         two-way ANOVA with one IV having more than two IV levels
     O         two-way chi-square with one variable having more than two categories
     O         multiple regression with three or more predictors

                                                              Table of Variables

List the variables   Is the     What is      Fill in these columns for nominal variables.          Fill in these columns for interval/ratio
in this column.      variable   the level                                                          variables.
Add more rows        an IV or   of           List below the     Describe the scheme or             What do high       Describe the test, material,
as needed.           a DV?      measurem     categories of      procedure you used for             scores on the      or procedure you used for
                                ent of the   the variable.      classifying respondents into the   variable           measuring the variables,
                                variable?                       categories.                        indicate or        including computational
                                                                                                   mean?              procedures.
Interest               IV       Nominal      First high         (Between-subjects design)
Preference in                                preference         Participants have all taken
Educational                                                     the Brainard Occupational
Work                                         Second high        Interest Inventory (BOPI).
                                             preference         From the BOPI Profile of Test
                                                                Results, students who
                                             Third high         reflected educational work as
                                             preference         one of their top three
                                                                occupational interests were
                                                                sampled and classified
                                                                according to their degree of
                                                                preference on educational
                                                                work.
Teaching               DV       Interval/                                                          High              Uses the standardized
Aptitude                          ratio                                                            teaching          tool—Teaching
                                                                                                   aptitude          Aptitude Test (TAT),
                                                                                                   means high        raw scores generated
                                                                                                   potential to      were converted to
                                                                                                   succeeding        percentile ranks to
                                                                                                   in a teacher      indicate the teaching
                                                                                                   training          aptitude in comparison
                                                                                                   program           with the normative
                                                                                                                     group

Psy520M -- First Term, SY 2008-2009                                                                                                Page 1
Teaching Aptitude and Relative Interest Preference on the Educational Field of Work: A Case of One-Way ANOVA (Suarez, 2008)


                                                             Participants

Mention pertinent sample characteristics and sample size. Be sure to follow the required minimum sample size.

    The sample data was taken from the admission test results conducted for the College of Education during
    SY2004-2005 and SY2006-2007 at Central Philippine University (Iloilo City). A purposive random sampling was
    carried out in this study considering that this is the sole data forwarded to the researcher for this project. As
    reflected in Table 1, almost 72% of student applicants from the population sample indicated an interest
    preference for the educational field of work. Table 2 presents the frequency distribution of the population sample
    according to interest preference in the field (based on the BOPI Profile). Based on the required minimum sample
    size for this project, teaching aptitude scores of 50 students for each preference group (n=150) were utilized in
    this study.


    Table 1. Frequency of Student Applicants with Interest in the Educational Field of Work based on the Brainard Occupational
             Preference Inventory


          School Year Test             Total Number of Student              No. of Students w/ Interest in Educational Work
             Conducted                        Applicants                         N                             %
          SY04-05, 1st Sem                       174                            122                           70.11
          SY04-05, 2nd Sem                       56                              46                           82.14
          SY06-07, 1st Sem                       148                            103                           69.59

                            Total                    378                       271                           71.69


    Table 2. Frequency Distribution of Sample Population according to Degree of Preference in the Educational
             Field of Work

        Number of Students                                                                                     Sample Size
      w/ interest in educational      SY04-05, 1st         SY04-05, 2nd     SY06-07, 1st
                 work                    Sem                  Sem              Sem            Subtotal        n           %
            1st Preference                67                    23              49              139           50         35.97
            2nd Preference                34                     7              37               78           50         64.10
            3rd Preference                21                    16              17               54           50         92.59
                                                                                     Total      271          150         55.35


                                                           Research Problem

1. State clearly the research problem.

             From School Year 2001-2006, the researcher of this study (also the guidance counselor assigned
    for the college) has been conducting an entry level admission testing for Education student applicants at
    Central Philippine University, using the following standardized assessment tools: the Teaching Aptitude
    Test (TAT) and the Brainard Occupational Interest Inventory (BOPI). Based on the admission results, a
    corresponding recommendation is forwarded to the college and is used as one of the criteria for admission.
    A profile of admission results is also maintained annually reflecting the teaching aptitude and the top-three
    occupational interests of student applicants. It has been observed that majority of the student applicants
    indicated a high interest preference for educational work (either as their first, second, or third highly-
    preferred occupational field). This study is particularly interested in comparing the teaching aptitude among
    entry level applicants in an educational program with varying preference or degree of occupational interest
    on the educational field of work.


Psy520M -- First Term, SY 2008-2009                                                                                     Page 2
Teaching Aptitude and Relative Interest Preference on the Educational Field of Work: A Case of One-Way ANOVA (Suarez, 2008)


2. State the predicted results

NOTE:

If you are doing an ANOVA, the predictions should be statements about comparisons of means (which means are
greater). Also, if you choose to do a two-way ANOVA, it would be good if you can predict about the presence of an
interaction, again making statements about comparisons of means (not simply saying that you predict an interaction).

If you are doing a two-way chi-square, state what you predict to be percentages of responses for the different cells
across each column (if you are analyzing column percentages) or across each row (if you are analyzing row
percentages). For example, you can say: in rural areas (the first row), there is a larger percentage of adolescents
who drink only than those who smoke only; on the other hand, in urban areas (the second row), there is a larger
percentage of adolescents who smoke only than those who drink only.

If you are doing a multiple regression, state what you predict to be the directed relationship between each criterion or
independent variable on the one hand and the criterion/dependent variable on the other hand. For example, it is
predicted that motivation for studying would increase as parental support increases, etc.

    The following are the predicted result of this study:

         1. Student applicants with educational work as their first highly-preferred occupational field have greater
            mean teaching aptitude scores than those who have chosen educational work as their second highly-
            preferred interest.
         2. Student applicants with educational work as their first highly-preferred occupational field have greater
            mean teaching aptitude scores than those who have chosen educational work as their third highly-
            preferred interest.
         3. Student applicants with educational work as their second highly-preferred occupational field have greater
            mean teaching aptitude scores than those who have chosen educational work as their third highly-
            preferred interest.


                                                  Review of Literature

Get some references (e.g., journal articles or reference books) about the predictions you described above or, at
least, references that are related to, if not directly about, this prediction.

Mention in this section important details, explaining their relevance to your research problem. If you can or if it is
appropriate, point out any connections among the references.

Hence, you should write not only about what you read in these references, but also about your research problem.

Maximum length for the review of literature is 3 medium-length paragraphs.

             In the Philippines, enrolment in teacher training appears to be one of the biggest sectors in
    enrolment at the tertiary level after Commerce/Business Administration and Engineering and Technology
    (Santos, No Date). It was asserted that the quality of future teachers will greatly determine the quality of the
    students who will come under the sphere of their influence. According to Sharma (2006), “schools and
    teachers are the crucial agents for bringing out the desirable changes in the system.” Considering that
    teachers have the fundamental concerns and moral responsibilities to gear all the activities of the school in
    the positive direction, they have to attain the attitude, aptitude, interest, values and certain competencies of
    the teaching profession to ensure the fulfillment of the expected assignments. For this reason, teacher-
    training institutions are expected to provide training to prospective teachers. Consequently, aptitude tests
    for students wishing to be teachers needed to be developed and administered to students to help them
    determine whether they will be successful in the teaching profession.


Psy520M -- First Term, SY 2008-2009                                                                               Page 3
Teaching Aptitude and Relative Interest Preference on the Educational Field of Work: A Case of One-Way ANOVA (Suarez, 2008)


              In the matter of vocational interests, people differ in the readiness with which they exhibit
     enthusiasm and in terms of the nature and completeness of their understanding of what a particular job
     means with respect to the activities and conditions of work. Within the occupational domain, interests in
     specific occupations, in broad occupational fields, and in general types of fields have been assessed. To
     date, measures of specific interest such as the Brainard Occupational Preference Inventory (BOPI Manual,
     1959) have been more useful than measures of general interest in predicting future choices and future
     satisfaction (Murphy, and Davidshofer, 1994). The BOPI includes educational work (which includes teaching
     as one of its related jobs) under the professional field of work.
              Varied research were conducted to explore the nature of teaching aptitude and/or occupational
     interest. In one study conducted by Kaur (2007) regarding teaching aptitude in predicting success in terms
     of achievement, teacher educator rating and school teacher rating, teaching aptitude was found to have
     positive correlation with almost all the success parameters, thus efforts should be made to test it more
     comprehensively in the admission test and its weight may also be increased. In another study, Sharma
     (2006) explored the relationship between the aptitude of teaching and professional interest among
     prospective teachers. This study found out that general teaching competence and professional interest of
     the pupil teachers significantly affect their teaching aptitude. A relative study was conducted by Agcaoili of
     Ateneo de Manila University (in Santos, No Date) which aimed to determine the possibility of predicting
     success among first year college students on the basis of interest on a field as well as other factors (e.g.,
     mental ability, academic aptitude, academic achievement in high school, socio-economic status, and age). It
     was found out that an aptitude for and a high interest in a particular field does play a positive role in
     determining a student’s success in the field. Given these pertinent information, the present study appears to
     be a novel investigation which aims to explore the variation in teaching aptitude when student applicants
     differs to a certain degree in their preference on the educational field (with some applicants having chosen
     educational work as their first highly-preferred occupational field while others have it as their second or third
     preference over other occupational fields).


                                                        Raw Data

In the format that STATISTICA will accept

      Interest Preference     Teaching Aptitude
1     First high preference           27.9
2     First high preference           54.7
3     First high preference           62.7
4     First high preference           57.2
5     First high preference           71.5
6     First high preference           74.9
7     First high preference           41.7
8     First high preference           99.5
9     First high preference           5.7
10    First high preference           19.0
11    First high preference           36.8
12    First high preference           71.5
13    First high preference           15.6
14    First high preference           33.8
15    First high preference           57.2
16    First high preference           1.0
17    First high preference           57.2
18    First high preference           88.9
19    First high preference           5.7

Psy520M -- First Term, SY 2008-2009                                                                               Page 4
Teaching Aptitude and Relative Interest Preference on the Educational Field of Work: A Case of One-Way ANOVA (Suarez, 2008)


20    First high preference           36.8
21    First high preference           1.0
22    First high preference           2.0
23    First high preference           41.7
24    First high preference           25.1
25    First high preference           76.8
26    First high preference           13.8
27    First high preference           36.8
28    First high preference           19.0
29    First high preference           87.2
30    First high preference           21.3
31    First high preference           14.6
32    First high preference           17.4
33    First high preference           76.8
34    First high preference           1.0
35    First high preference           25.1
36    First high preference           1.7
37    First high preference           1.0
38    First high preference           21.3
39    First high preference           7.0
40    First high preference           13.8
41    First high preference           27.9
42    First high preference           15.6
43    First high preference           1.5
44    First high preference           2.5
45    First high preference           51.3
46    First high preference           43.4
47    First high preference           5.7
48    First high preference           57.2
49    First high preference           25.1
50    First high preference           7.0
51 Second high preference             21.3
52 Second high preference             44.6
53 Second high preference             25.1
54 Second high preference             15.6
55 Second high preference             1.7
56 Second high preference             19.0
57 Second high preference             41.7
58 Second high preference             7.0
59 Second high preference             15.6
60 Second high preference             9.4
61 Second high preference             7.0
62 Second high preference             39.1
63 Second high preference             1.5
64 Second high preference             9.4


Psy520M -- First Term, SY 2008-2009                                                                               Page 5
Teaching Aptitude and Relative Interest Preference on the Educational Field of Work: A Case of One-Way ANOVA (Suarez, 2008)


65 Second high preference             87.2
66 Second high preference             97.0
67 Second high preference             8.0
68 Second high preference             19.1
69 Second high preference             1.7
70 Second high preference             1.0
71 Second high preference             99.7
72 Second high preference             13.8
73 Second high preference             92.8
74 Second high preference             41.7
75 Second high preference             19.0
76 Second high preference             9.4
77 Second high preference             83.7
78 Second high preference             41.7
79 Second high preference             33.8
80 Second high preference             25.1
81 Second high preference             36.8
82 Second high preference             51.3
83 Second high preference             51.3
84 Second high preference             1.0
85 Second high preference             62.7
86 Second high preference             25.1
87 Second high preference             51.3
88 Second high preference             57.2
89 Second high preference             25.1
90 Second high preference             27.9
91 Second high preference             25.1
92 Second high preference             9.4
93 Second high preference             36.8
94 Second high preference             25.1
95 Second high preference             15.6
96 Second high preference             67.2
97 Second high preference             7.0
98 Second high preference             33.8
99 Second high preference             57.2
100 Second high preference            84.2
101   Third high preference           7.0
102   Third high preference           57.2
103   Third high preference           87.8
104   Third high preference           15.6
105   Third high preference           4.5
106   Third high preference           33.8
107   Third high preference           36.8
108   Third high preference           21.3
109   Third high preference           41.7


Psy520M -- First Term, SY 2008-2009                                                                                Page 6
Teaching Aptitude and Relative Interest Preference on the Educational Field of Work: A Case of One-Way ANOVA (Suarez, 2008)


110   Third high preference           51.3
111   Third high preference           67.2
112   Third high preference           33.8
113   Third high preference           15.6
114   Third high preference           41.7
115   Third high preference           33.8
116   Third high preference           9.4
117   Third high preference           62.7
118   Third high preference           88.3
119   Third high preference           7.0
120   Third high preference           15.5
121   Third high preference           7.0
122   Third high preference           67.2
123   Third high preference           83.7
124   Third high preference           99.5
125   Third high preference           41.7
126   Third high preference           27.9
127   Third high preference           71.5
128   Third high preference           84.3
129   Third high preference           67.2
130   Third high preference           62.7
131   Third high preference           25.1
132   Third high preference           44.6
133   Third high preference           9.4
134   Third high preference           82.7
135   Third high preference           44.6
136   Third high preference           19.0
137   Third high preference           44.6
138   Third high preference           67.2
139   Third high preference           7.0
140   Third high preference           33.8
141   Third high preference           15.5
142   Third high preference           87.8
143   Third high preference           36.8
144   Third high preference           71.5
145   Third high preference           27.9
146   Third high preference           25.1
147   Third high preference           9.4
148   Third high preference           99.5
149   Third high preference           4.5
150   Third high preference           57.2


                                              Statistical Software Output

As in the handout

Psy520M -- First Term, SY 2008-2009                                                                               Page 7
Teaching Aptitude and Relative Interest Preference on the Educational Field of Work: A Case of One-Way ANOVA (Suarez, 2008)


ANOVA Table

                                Univariate Tests of Significance for Teaching Aptitude (Spreadsheet1)
                                Sigma-restricted parameterization
                                Effective hypothesis decomposition
                                   SS      Degr. of     MS           F        p
Effect                                     Freedom
Intercept                       201857.4            1 201857.4 258.8394 0.000000
Interest Preference                3148.7           2   1574.3     2.0188 0.136485
Error                           114638.8         147      779.9


Table of Means

         Interest Preference; LS Means (Spreadsheet1)
         Current effect: F(2, 147)=2.0188, p=.13648
         Effective hypothesis decomposition
           Interest Preference    Teaching Aptitude Teaching Aptitude                                                                        Teaching Aptitude   Teaching Aptitude N
Cell No.                                Mean             Std.Err.                                                                                 -95.00%             +95.00%
1        First high preference 33.21800             3.949318                                                                                 25.41323            41.02277          50
2        Second high preference33.67600             3.949318                                                                                 25.87123            41.48077          50
3        Third high preference 43.15800             3.949318                                                                                 35.35323            50.96277          50

Graph of Means

                                                     In te re s t P re f e re n c e ; L S M e a n s
                                          C u rre n t e f f e c t: F (2 , 1 4 7 )= 2 .0 1 8 8 , p = .1 3 6 4 8
                                                E f f e c t iv e h y p o t h e s is d e c o m p o s it io n
                                        V e r t ic a l b a r s d e n o t e 0 . 9 5 c o n f id e n c e in t e r v a ls
                     55

                     50

                     45
 Teaching Aptitude


                     40

                     35

                     30

                     25

                     20
                          F ir s t h ig h p r e f e r e n c e                                               T h ir d h ig h p r e f e r e n c e
                                                                S e c o n d h ig h p r e f e r e n c e

                                                                    In te re s t P re f e re n c e


ANOVA Summary Table:

Source of variation/                               df                                     SS                                MS                        F              p
      Effect

Psy520M -- First Term, SY 2008-2009                                                                                                                                      Page 8
Teaching Aptitude and Relative Interest Preference on the Educational Field of Work: A Case of One-Way ANOVA (Suarez, 2008)


Between-groups                   q – 1=3-1=2        3148.7               3148.7/2    1574.35/779.86       0.13648
variation (BG)                                                          =1574.35              =2.02


Within-groups             N – q = 150-3=147      114638.8          114638.8/147               xxxxxxx       xxxxxxx
variation: (WG)                                                        =779.86
Or Error

Total                      N – 1=150-1=149       117787.5                xxxxxxx              xxxxxxx       xxxxxxx


                                                   Analysis of Output

Answer the same questions as in the handout for the analysis that you are doing, but omit the questions/exercises
that require some manual computations to verify some statistics from the STATISTICA output.

A table of questions and answers, following the format in the hand-out.


Questions regarding results of analyses:

        1   What is the independent variable?              Interest Preference

        2   What is the dependent variable?                Teaching Aptitude

        3   What is the null hypothesis for the F-test?
                                                             H 0 : µ First = µ Second = µThird

        4   What is the alternative hypothesis for the     There are at least two population means that are
            F-test?                                        not equal to each other.


                                                           There are at least two interest preference groups
                                                           with different (population) mean teaching aptitude
                                                           scores.
        5   Should the null hypothesis be rejected?        No, do not reject the null hypothesis

                                                           F(2, 147) = 2.02, MSE = 779.9, p = .13648.
        6   Are there significant differences among        No. There are no significant differences among
            the means?                                     the means.

        7   Do you recommend doing multiple                No.
            comparison tests?


                                                 Discussion of Results

Discuss the results in any sensible and substantive way that you deem appropriate. Do not explain the process of
hypothesis-testing that you did, rather discuss the relationships of variables analyzed.


Psy520M -- First Term, SY 2008-2009                                                                               Page 9
Teaching Aptitude and Relative Interest Preference on the Educational Field of Work: A Case of One-Way ANOVA (Suarez, 2008)


             Having compared the teaching aptitude of entry level applicants in an educational program with
    varying preference or degree of occupational interest on the educational field of work, results of this study
    indicate that at alpha level of .05, the mean teaching aptitude percentile score among the three groups (i.e.,
    groups with first-high preference, second-high preference, and third-high preference on educational work)
    did not differ significantly, F(2,147)=2.02, p=.13648. This means that on the average, the teaching aptitude
    of the student applicant’s for the College of Education at Central Philippine University is not related to their
    degree of interest preference on educational work when such field belongs to one of their top-three choices.
    Whether educational work is considered either as their first-, second-, or third-preferred occupational field, on
    the average, their potential to succeed in the teacher training program remains the same.


                                                       References


Brainard Occupational Preference Inventory Manual (1959). The Psychological Corporation.
Kaur, Dushyant. (2007). Academic achievement, teaching aptitude, and the personality traits as the predictors of
   success in elementary teacher training: A study. Accessed at
   http://jmi.nic.in/Research/ab2007_iase_dushyant.pdf on August 22, 2008.
Murphy, K.R. and Davidshofer, C.O. (1994). Psychological Testing: Principles and Applications (3rd Ed.).
   Englewood Cliffs, New Jersey: Prentice-Hall International, Inc.
Santos, Zenaida. (No Date). Standardized Aptitude Test for Teachers Manual. Quezon City: Behavioral Dynamics,
   Inc.
Sharma, Parveen (2006). A study of teaching aptitude in relation to general teaching competency, professional
   teaching and academic achievements of B. Ed. pupil teachers. Article retrieved from
   http://jmi.nic.in/Research/ab2006_education_parveensharma.htm on August 23, 2008.


Psy520M -- First Term, SY 2008-2009                                                                              Page 10

Lab project (one way anova) - suarez

  • 1.
    Teaching Aptitude andRelative Interest Preference on the Educational Field of Work: A Case of One-Way ANOVA (Suarez, 2008) PSY520M/PSY522M Template for Project Name: SUAREZ, FLORABEL S. DLSU ID# 10797637 INSTRUCTION: 1. Fill in the answers or details required in this template, but do not delete any instructions that the instructor has written. 2. Staple the completed template and put it in a short brown envelope with your name on it. 3. Please submit the completed template on Tuesday of the fourteenth week of the term. Analysis What analysis has been assigned for you to do? (Please check.) O one-way ANOVA with more than two IV categories O repeated measures with more than two IV categories O two-way ANOVA with one IV having more than two IV levels O two-way chi-square with one variable having more than two categories O multiple regression with three or more predictors Table of Variables List the variables Is the What is Fill in these columns for nominal variables. Fill in these columns for interval/ratio in this column. variable the level variables. Add more rows an IV or of List below the Describe the scheme or What do high Describe the test, material, as needed. a DV? measurem categories of procedure you used for scores on the or procedure you used for ent of the the variable. classifying respondents into the variable measuring the variables, variable? categories. indicate or including computational mean? procedures. Interest IV Nominal First high (Between-subjects design) Preference in preference Participants have all taken Educational the Brainard Occupational Work Second high Interest Inventory (BOPI). preference From the BOPI Profile of Test Results, students who Third high reflected educational work as preference one of their top three occupational interests were sampled and classified according to their degree of preference on educational work. Teaching DV Interval/ High Uses the standardized Aptitude ratio teaching tool—Teaching aptitude Aptitude Test (TAT), means high raw scores generated potential to were converted to succeeding percentile ranks to in a teacher indicate the teaching training aptitude in comparison program with the normative group Psy520M -- First Term, SY 2008-2009 Page 1
  • 2.
    Teaching Aptitude andRelative Interest Preference on the Educational Field of Work: A Case of One-Way ANOVA (Suarez, 2008) Participants Mention pertinent sample characteristics and sample size. Be sure to follow the required minimum sample size. The sample data was taken from the admission test results conducted for the College of Education during SY2004-2005 and SY2006-2007 at Central Philippine University (Iloilo City). A purposive random sampling was carried out in this study considering that this is the sole data forwarded to the researcher for this project. As reflected in Table 1, almost 72% of student applicants from the population sample indicated an interest preference for the educational field of work. Table 2 presents the frequency distribution of the population sample according to interest preference in the field (based on the BOPI Profile). Based on the required minimum sample size for this project, teaching aptitude scores of 50 students for each preference group (n=150) were utilized in this study. Table 1. Frequency of Student Applicants with Interest in the Educational Field of Work based on the Brainard Occupational Preference Inventory School Year Test Total Number of Student No. of Students w/ Interest in Educational Work Conducted Applicants N % SY04-05, 1st Sem 174 122 70.11 SY04-05, 2nd Sem 56 46 82.14 SY06-07, 1st Sem 148 103 69.59 Total 378 271 71.69 Table 2. Frequency Distribution of Sample Population according to Degree of Preference in the Educational Field of Work Number of Students Sample Size w/ interest in educational SY04-05, 1st SY04-05, 2nd SY06-07, 1st work Sem Sem Sem Subtotal n % 1st Preference 67 23 49 139 50 35.97 2nd Preference 34 7 37 78 50 64.10 3rd Preference 21 16 17 54 50 92.59 Total 271 150 55.35 Research Problem 1. State clearly the research problem. From School Year 2001-2006, the researcher of this study (also the guidance counselor assigned for the college) has been conducting an entry level admission testing for Education student applicants at Central Philippine University, using the following standardized assessment tools: the Teaching Aptitude Test (TAT) and the Brainard Occupational Interest Inventory (BOPI). Based on the admission results, a corresponding recommendation is forwarded to the college and is used as one of the criteria for admission. A profile of admission results is also maintained annually reflecting the teaching aptitude and the top-three occupational interests of student applicants. It has been observed that majority of the student applicants indicated a high interest preference for educational work (either as their first, second, or third highly- preferred occupational field). This study is particularly interested in comparing the teaching aptitude among entry level applicants in an educational program with varying preference or degree of occupational interest on the educational field of work. Psy520M -- First Term, SY 2008-2009 Page 2
  • 3.
    Teaching Aptitude andRelative Interest Preference on the Educational Field of Work: A Case of One-Way ANOVA (Suarez, 2008) 2. State the predicted results NOTE: If you are doing an ANOVA, the predictions should be statements about comparisons of means (which means are greater). Also, if you choose to do a two-way ANOVA, it would be good if you can predict about the presence of an interaction, again making statements about comparisons of means (not simply saying that you predict an interaction). If you are doing a two-way chi-square, state what you predict to be percentages of responses for the different cells across each column (if you are analyzing column percentages) or across each row (if you are analyzing row percentages). For example, you can say: in rural areas (the first row), there is a larger percentage of adolescents who drink only than those who smoke only; on the other hand, in urban areas (the second row), there is a larger percentage of adolescents who smoke only than those who drink only. If you are doing a multiple regression, state what you predict to be the directed relationship between each criterion or independent variable on the one hand and the criterion/dependent variable on the other hand. For example, it is predicted that motivation for studying would increase as parental support increases, etc. The following are the predicted result of this study: 1. Student applicants with educational work as their first highly-preferred occupational field have greater mean teaching aptitude scores than those who have chosen educational work as their second highly- preferred interest. 2. Student applicants with educational work as their first highly-preferred occupational field have greater mean teaching aptitude scores than those who have chosen educational work as their third highly- preferred interest. 3. Student applicants with educational work as their second highly-preferred occupational field have greater mean teaching aptitude scores than those who have chosen educational work as their third highly- preferred interest. Review of Literature Get some references (e.g., journal articles or reference books) about the predictions you described above or, at least, references that are related to, if not directly about, this prediction. Mention in this section important details, explaining their relevance to your research problem. If you can or if it is appropriate, point out any connections among the references. Hence, you should write not only about what you read in these references, but also about your research problem. Maximum length for the review of literature is 3 medium-length paragraphs. In the Philippines, enrolment in teacher training appears to be one of the biggest sectors in enrolment at the tertiary level after Commerce/Business Administration and Engineering and Technology (Santos, No Date). It was asserted that the quality of future teachers will greatly determine the quality of the students who will come under the sphere of their influence. According to Sharma (2006), “schools and teachers are the crucial agents for bringing out the desirable changes in the system.” Considering that teachers have the fundamental concerns and moral responsibilities to gear all the activities of the school in the positive direction, they have to attain the attitude, aptitude, interest, values and certain competencies of the teaching profession to ensure the fulfillment of the expected assignments. For this reason, teacher- training institutions are expected to provide training to prospective teachers. Consequently, aptitude tests for students wishing to be teachers needed to be developed and administered to students to help them determine whether they will be successful in the teaching profession. Psy520M -- First Term, SY 2008-2009 Page 3
  • 4.
    Teaching Aptitude andRelative Interest Preference on the Educational Field of Work: A Case of One-Way ANOVA (Suarez, 2008) In the matter of vocational interests, people differ in the readiness with which they exhibit enthusiasm and in terms of the nature and completeness of their understanding of what a particular job means with respect to the activities and conditions of work. Within the occupational domain, interests in specific occupations, in broad occupational fields, and in general types of fields have been assessed. To date, measures of specific interest such as the Brainard Occupational Preference Inventory (BOPI Manual, 1959) have been more useful than measures of general interest in predicting future choices and future satisfaction (Murphy, and Davidshofer, 1994). The BOPI includes educational work (which includes teaching as one of its related jobs) under the professional field of work. Varied research were conducted to explore the nature of teaching aptitude and/or occupational interest. In one study conducted by Kaur (2007) regarding teaching aptitude in predicting success in terms of achievement, teacher educator rating and school teacher rating, teaching aptitude was found to have positive correlation with almost all the success parameters, thus efforts should be made to test it more comprehensively in the admission test and its weight may also be increased. In another study, Sharma (2006) explored the relationship between the aptitude of teaching and professional interest among prospective teachers. This study found out that general teaching competence and professional interest of the pupil teachers significantly affect their teaching aptitude. A relative study was conducted by Agcaoili of Ateneo de Manila University (in Santos, No Date) which aimed to determine the possibility of predicting success among first year college students on the basis of interest on a field as well as other factors (e.g., mental ability, academic aptitude, academic achievement in high school, socio-economic status, and age). It was found out that an aptitude for and a high interest in a particular field does play a positive role in determining a student’s success in the field. Given these pertinent information, the present study appears to be a novel investigation which aims to explore the variation in teaching aptitude when student applicants differs to a certain degree in their preference on the educational field (with some applicants having chosen educational work as their first highly-preferred occupational field while others have it as their second or third preference over other occupational fields). Raw Data In the format that STATISTICA will accept Interest Preference Teaching Aptitude 1 First high preference 27.9 2 First high preference 54.7 3 First high preference 62.7 4 First high preference 57.2 5 First high preference 71.5 6 First high preference 74.9 7 First high preference 41.7 8 First high preference 99.5 9 First high preference 5.7 10 First high preference 19.0 11 First high preference 36.8 12 First high preference 71.5 13 First high preference 15.6 14 First high preference 33.8 15 First high preference 57.2 16 First high preference 1.0 17 First high preference 57.2 18 First high preference 88.9 19 First high preference 5.7 Psy520M -- First Term, SY 2008-2009 Page 4
  • 5.
    Teaching Aptitude andRelative Interest Preference on the Educational Field of Work: A Case of One-Way ANOVA (Suarez, 2008) 20 First high preference 36.8 21 First high preference 1.0 22 First high preference 2.0 23 First high preference 41.7 24 First high preference 25.1 25 First high preference 76.8 26 First high preference 13.8 27 First high preference 36.8 28 First high preference 19.0 29 First high preference 87.2 30 First high preference 21.3 31 First high preference 14.6 32 First high preference 17.4 33 First high preference 76.8 34 First high preference 1.0 35 First high preference 25.1 36 First high preference 1.7 37 First high preference 1.0 38 First high preference 21.3 39 First high preference 7.0 40 First high preference 13.8 41 First high preference 27.9 42 First high preference 15.6 43 First high preference 1.5 44 First high preference 2.5 45 First high preference 51.3 46 First high preference 43.4 47 First high preference 5.7 48 First high preference 57.2 49 First high preference 25.1 50 First high preference 7.0 51 Second high preference 21.3 52 Second high preference 44.6 53 Second high preference 25.1 54 Second high preference 15.6 55 Second high preference 1.7 56 Second high preference 19.0 57 Second high preference 41.7 58 Second high preference 7.0 59 Second high preference 15.6 60 Second high preference 9.4 61 Second high preference 7.0 62 Second high preference 39.1 63 Second high preference 1.5 64 Second high preference 9.4 Psy520M -- First Term, SY 2008-2009 Page 5
  • 6.
    Teaching Aptitude andRelative Interest Preference on the Educational Field of Work: A Case of One-Way ANOVA (Suarez, 2008) 65 Second high preference 87.2 66 Second high preference 97.0 67 Second high preference 8.0 68 Second high preference 19.1 69 Second high preference 1.7 70 Second high preference 1.0 71 Second high preference 99.7 72 Second high preference 13.8 73 Second high preference 92.8 74 Second high preference 41.7 75 Second high preference 19.0 76 Second high preference 9.4 77 Second high preference 83.7 78 Second high preference 41.7 79 Second high preference 33.8 80 Second high preference 25.1 81 Second high preference 36.8 82 Second high preference 51.3 83 Second high preference 51.3 84 Second high preference 1.0 85 Second high preference 62.7 86 Second high preference 25.1 87 Second high preference 51.3 88 Second high preference 57.2 89 Second high preference 25.1 90 Second high preference 27.9 91 Second high preference 25.1 92 Second high preference 9.4 93 Second high preference 36.8 94 Second high preference 25.1 95 Second high preference 15.6 96 Second high preference 67.2 97 Second high preference 7.0 98 Second high preference 33.8 99 Second high preference 57.2 100 Second high preference 84.2 101 Third high preference 7.0 102 Third high preference 57.2 103 Third high preference 87.8 104 Third high preference 15.6 105 Third high preference 4.5 106 Third high preference 33.8 107 Third high preference 36.8 108 Third high preference 21.3 109 Third high preference 41.7 Psy520M -- First Term, SY 2008-2009 Page 6
  • 7.
    Teaching Aptitude andRelative Interest Preference on the Educational Field of Work: A Case of One-Way ANOVA (Suarez, 2008) 110 Third high preference 51.3 111 Third high preference 67.2 112 Third high preference 33.8 113 Third high preference 15.6 114 Third high preference 41.7 115 Third high preference 33.8 116 Third high preference 9.4 117 Third high preference 62.7 118 Third high preference 88.3 119 Third high preference 7.0 120 Third high preference 15.5 121 Third high preference 7.0 122 Third high preference 67.2 123 Third high preference 83.7 124 Third high preference 99.5 125 Third high preference 41.7 126 Third high preference 27.9 127 Third high preference 71.5 128 Third high preference 84.3 129 Third high preference 67.2 130 Third high preference 62.7 131 Third high preference 25.1 132 Third high preference 44.6 133 Third high preference 9.4 134 Third high preference 82.7 135 Third high preference 44.6 136 Third high preference 19.0 137 Third high preference 44.6 138 Third high preference 67.2 139 Third high preference 7.0 140 Third high preference 33.8 141 Third high preference 15.5 142 Third high preference 87.8 143 Third high preference 36.8 144 Third high preference 71.5 145 Third high preference 27.9 146 Third high preference 25.1 147 Third high preference 9.4 148 Third high preference 99.5 149 Third high preference 4.5 150 Third high preference 57.2 Statistical Software Output As in the handout Psy520M -- First Term, SY 2008-2009 Page 7
  • 8.
    Teaching Aptitude andRelative Interest Preference on the Educational Field of Work: A Case of One-Way ANOVA (Suarez, 2008) ANOVA Table Univariate Tests of Significance for Teaching Aptitude (Spreadsheet1) Sigma-restricted parameterization Effective hypothesis decomposition SS Degr. of MS F p Effect Freedom Intercept 201857.4 1 201857.4 258.8394 0.000000 Interest Preference 3148.7 2 1574.3 2.0188 0.136485 Error 114638.8 147 779.9 Table of Means Interest Preference; LS Means (Spreadsheet1) Current effect: F(2, 147)=2.0188, p=.13648 Effective hypothesis decomposition Interest Preference Teaching Aptitude Teaching Aptitude Teaching Aptitude Teaching Aptitude N Cell No. Mean Std.Err. -95.00% +95.00% 1 First high preference 33.21800 3.949318 25.41323 41.02277 50 2 Second high preference33.67600 3.949318 25.87123 41.48077 50 3 Third high preference 43.15800 3.949318 35.35323 50.96277 50 Graph of Means In te re s t P re f e re n c e ; L S M e a n s C u rre n t e f f e c t: F (2 , 1 4 7 )= 2 .0 1 8 8 , p = .1 3 6 4 8 E f f e c t iv e h y p o t h e s is d e c o m p o s it io n V e r t ic a l b a r s d e n o t e 0 . 9 5 c o n f id e n c e in t e r v a ls 55 50 45 Teaching Aptitude 40 35 30 25 20 F ir s t h ig h p r e f e r e n c e T h ir d h ig h p r e f e r e n c e S e c o n d h ig h p r e f e r e n c e In te re s t P re f e re n c e ANOVA Summary Table: Source of variation/ df SS MS F p Effect Psy520M -- First Term, SY 2008-2009 Page 8
  • 9.
    Teaching Aptitude andRelative Interest Preference on the Educational Field of Work: A Case of One-Way ANOVA (Suarez, 2008) Between-groups q – 1=3-1=2 3148.7 3148.7/2 1574.35/779.86 0.13648 variation (BG) =1574.35 =2.02 Within-groups N – q = 150-3=147 114638.8 114638.8/147 xxxxxxx xxxxxxx variation: (WG) =779.86 Or Error Total N – 1=150-1=149 117787.5 xxxxxxx xxxxxxx xxxxxxx Analysis of Output Answer the same questions as in the handout for the analysis that you are doing, but omit the questions/exercises that require some manual computations to verify some statistics from the STATISTICA output. A table of questions and answers, following the format in the hand-out. Questions regarding results of analyses: 1 What is the independent variable? Interest Preference 2 What is the dependent variable? Teaching Aptitude 3 What is the null hypothesis for the F-test? H 0 : µ First = µ Second = µThird 4 What is the alternative hypothesis for the There are at least two population means that are F-test? not equal to each other. There are at least two interest preference groups with different (population) mean teaching aptitude scores. 5 Should the null hypothesis be rejected? No, do not reject the null hypothesis F(2, 147) = 2.02, MSE = 779.9, p = .13648. 6 Are there significant differences among No. There are no significant differences among the means? the means. 7 Do you recommend doing multiple No. comparison tests? Discussion of Results Discuss the results in any sensible and substantive way that you deem appropriate. Do not explain the process of hypothesis-testing that you did, rather discuss the relationships of variables analyzed. Psy520M -- First Term, SY 2008-2009 Page 9
  • 10.
    Teaching Aptitude andRelative Interest Preference on the Educational Field of Work: A Case of One-Way ANOVA (Suarez, 2008) Having compared the teaching aptitude of entry level applicants in an educational program with varying preference or degree of occupational interest on the educational field of work, results of this study indicate that at alpha level of .05, the mean teaching aptitude percentile score among the three groups (i.e., groups with first-high preference, second-high preference, and third-high preference on educational work) did not differ significantly, F(2,147)=2.02, p=.13648. This means that on the average, the teaching aptitude of the student applicant’s for the College of Education at Central Philippine University is not related to their degree of interest preference on educational work when such field belongs to one of their top-three choices. Whether educational work is considered either as their first-, second-, or third-preferred occupational field, on the average, their potential to succeed in the teacher training program remains the same. References Brainard Occupational Preference Inventory Manual (1959). The Psychological Corporation. Kaur, Dushyant. (2007). Academic achievement, teaching aptitude, and the personality traits as the predictors of success in elementary teacher training: A study. Accessed at http://jmi.nic.in/Research/ab2007_iase_dushyant.pdf on August 22, 2008. Murphy, K.R. and Davidshofer, C.O. (1994). Psychological Testing: Principles and Applications (3rd Ed.). Englewood Cliffs, New Jersey: Prentice-Hall International, Inc. Santos, Zenaida. (No Date). Standardized Aptitude Test for Teachers Manual. Quezon City: Behavioral Dynamics, Inc. Sharma, Parveen (2006). A study of teaching aptitude in relation to general teaching competency, professional teaching and academic achievements of B. Ed. pupil teachers. Article retrieved from http://jmi.nic.in/Research/ab2006_education_parveensharma.htm on August 23, 2008. Psy520M -- First Term, SY 2008-2009 Page 10