Exercise
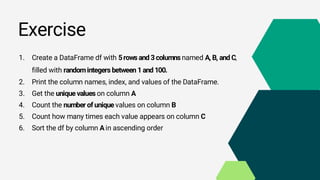
1. Create aDataFrame df with 5rows and 3columns named A, B, and C,
filled with randomintegers between 1and 100.
2. Print the column names, index, and values of the DataFrame.
3. Get the unique values on column A
4. Count the number of unique values on column B
5. Count how many times each value appears on column C
6. Sort the df by column Ain ascending order
4.
Operations
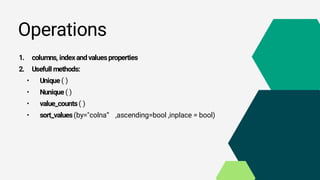
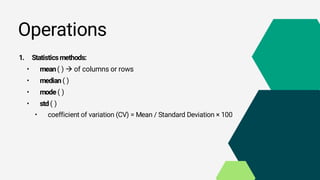
1. Statisticsmethods:
• mean() of columns or rows
• median ( )
• mode ( )
• std ( )
• coefficient of variation (CV) = Mean / Standard Deviation × 100
5.
Exercise
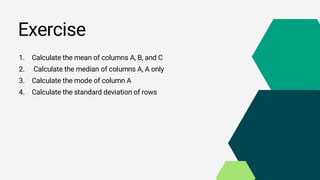
1. Calculate themean of columns A, B, and C
2. Calculate the median of columns A, A only
3. Calculate the mode of column A
4. Calculate the standard deviation of rows
6.
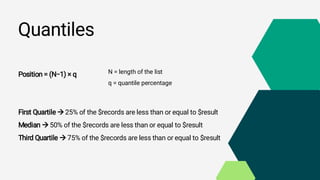
Quantiles
Position = (N−1)× q
First Quartile 25% of the $records are less than or equal to $result
Median 50% of the $records are less than or equal to $result
Third Quartile 75% of the $records are less than or equal to $result
N = length of the list
q = quantile percentage
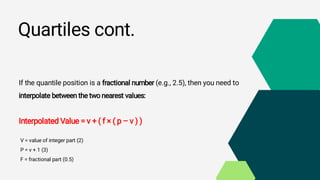
Quartiles cont.
If thequantile position is a fractional number (e.g., 2.5), then you need to
interpolate between the two nearest values:
Interpolated Value = v + ( f × ( p – v ) )
V = value of integer part (2)
P = v + 1 (3)
F = fractional part (0.5)
9.
Correlation
Correlation is astatistical measure that describes the strength and direction of a relationship
between two variable
Types of Correlation:
• Positive Correlation: As one variable increases, the other variable also increases.
• Negative Correlation: As one variable increases, the other variable decreases No.
• Correlation: There is no discernible relationship between the two variables.
Calculate the correlation between columns A and B df['A'].corr(df['B'])
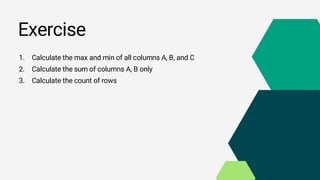
Exercise
1. Calculate themax and min of all columns A, B, and C
2. Calculate the sum of columns A, B only
3. Calculate the count of rows
12.
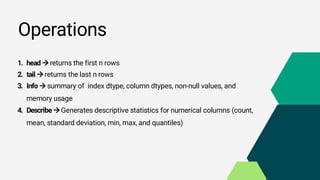
Operations
1. head returnsthe first n rows
2. tail returns the last n rows
3. Info summary of index dtype, column dtypes, non-null values, and
memory usage
4. Describe Generates descriptive statistics for numerical columns (count,
mean, standard deviation, min, max, and quantiles)


![Quantiles exercise
calculate the 0.25 and 0.5 quantiles for this list:
[1, 2, 3, 5, 6, 6, 4, 7, 8]](https://image.slidesharecdn.com/lab3-250920215932-5b7bf04d/85/Lab-3-lab3-file-for-python-for-4-grade-pdf-7-320.jpg)
![Correlation
Correlation is a statistical measure that describes the strength and direction of a relationship
between two variable
Types of Correlation:
• Positive Correlation: As one variable increases, the other variable also increases.
• Negative Correlation: As one variable increases, the other variable decreases No.
• Correlation: There is no discernible relationship between the two variables.
Calculate the correlation between columns A and B df['A'].corr(df['B'])](https://image.slidesharecdn.com/lab3-250920215932-5b7bf04d/85/Lab-3-lab3-file-for-python-for-4-grade-pdf-9-320.jpg)


![7.__Developing_a_Research_Proposal[1].pptx](https://cdn.slidesharecdn.com/ss_thumbnails/7-260131073037-df92dd7d-thumbnail.jpg?width=640&height=640&fit=bounds)
![제 23회 보아즈(BOAZ) 빅데이터 컨퍼런스 - [MBOAX] : ABSA를 활용한 소비자 반응 분석 기반 운영 효율화 대시보드 설계](https://cdn.slidesharecdn.com/ss_thumbnails/3-1boaz23rdconferencemboax-260203102709-9d519923-thumbnail.jpg?width=640&height=640&fit=bounds)


