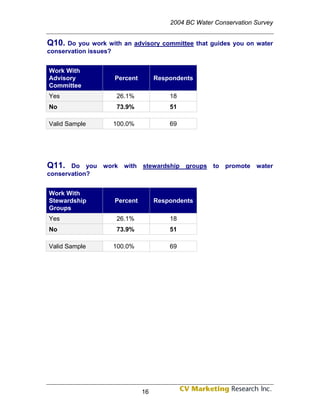
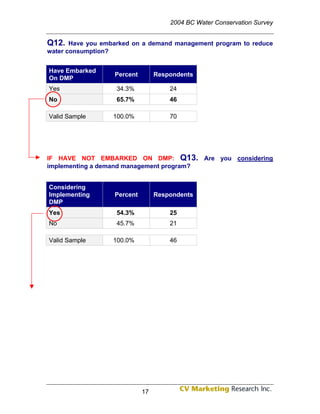
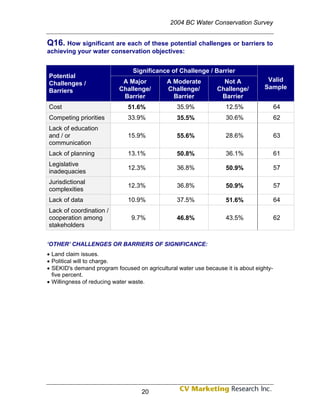
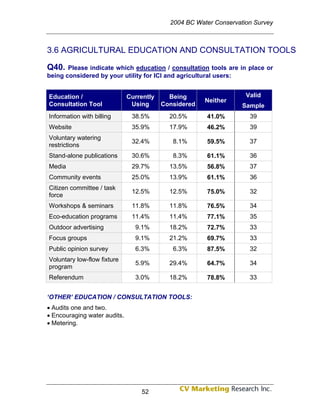
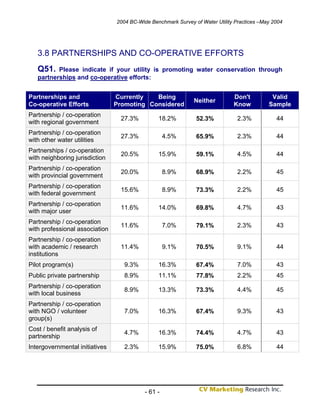
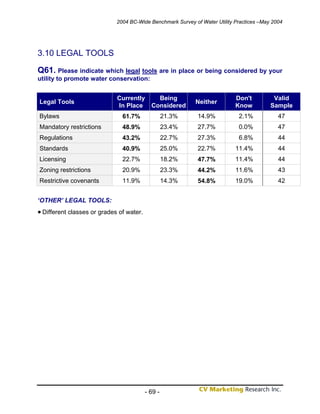
This survey of 72 water utilities in British Columbia was conducted to understand current water conservation policies, practices, and challenges. The majority of utilities expect population growth to require infrastructure expansion, though over half believe their existing infrastructure cannot support projected growth. Most utilities plan system expansions and are committing funds, with some relying on government funding. While one-third have demand management programs, over half of the remaining utilities are considering implementing one. The primary drivers for demand management are increasing infrastructure needs and limited water supply quantities. The greatest challenge is the cost of implementing conservation programs. Few utilities use performance measures to assess conservation progress.
The Scottish Government has set an ambitious target to generate half of the country's electricity from renewable sources like wind, solar, and hydro power by 2020. While Scotland has significant renewable energy potential, fully utilizing these resources would substantially impact the landscape and local communities. Developing renewable infrastructure requires weighing environmental and social considerations.
The document discusses electric vehicles and hybrid electric vehicles. It provides details on the types of electric vehicles, their components like electric motors and batteries. It explains the benefits of electric vehicles like higher energy efficiency, regenerative braking, and quiet operation. However, it also mentions challenges like limited driving range due to low battery energy density and long charging times. The document provides a comprehensive overview of electric vehicles and hybrid electric vehicles.
The document analyzes the adaptive capacity to climate variability in Tharaka district, Kenya. It finds that the main livelihoods of crop farming and pastoralism are highly dependent on rainfall and vulnerable to drought. While households employ strategies like crop diversification and multiple livelihood activities, adaptive capacity is weakened by poor infrastructure like roads, low education levels, and underutilized resources. The study concludes that addressing underlying social and economic vulnerabilities through investments in literacy, infrastructure, and water management could help strengthen household resilience to climate impacts in the region.
This presentation will focus on data gathered from a survey and in-depth interviews with Hudson Valley municipal
officials. The goal of this project was to determine Hudson Valley local government officials’ attitudes toward climate
change and perceptions of climate change taking place in their communities. We also determined local government
officials’ views of risks, vulnerabilities, and issues associated with climate change as it will impact the natural resources
and infrastructure under their jurisdiction. We will discuss what actions local governments are taking to mitigate and
adapt to climate change as well as why some are not. Results also show local government officials’ views of adaptations
and policy options which might address issues resulting from climate change. We also offer suggestions on the most
effective ways of reaching municipal officials with information about climate change threats at a local level – including
the resources that will help local government officials implement solutions and adaptations. Presentation by Shorna Allred, Allison Chatrchyan, and Maureen Mullen. August 13, 2012, Hudson Valley Climate Action Network, Norrie Point Environmental Center, Staatsburg, NY
The document summarizes the key findings of a survey of 218 accountants from 50 countries on their views of natural capital.
1) Most accountants agreed that the long-term success of organizations depends on the natural world and that the private sector should protect the environment. However, fewer felt their own organizations took sufficient steps to manage natural capital issues.
2) Accountants identified reputational, operational, supply chain and other risks to business from natural capital trends like resource scarcity. They expected these risks to increase over the next 5 years.
3) Few organizations report on natural capital according to the accountants surveyed, with lack of guidance, skills and tools cited as the top barriers.
The Risk Radar 2011 is an Economist Intelligence Unit report that investigates the key risks business executives are facing in 2011, and the ways in which firms are addressing these risks. The report
is sponsored by RBS. Our research for this report drew on three main sources:
l We conducted an online survey of 275 executives from around the world between October and
November 2010. The survey included companies from a range of industries.
l To supplement the survey results, the Economist Intelligence Unit conducted a programme of
qualitative research that included a series of in-depth interviews with industry experts.
l We also drew on the latest global and country-level risk analysis from the Economist Intelligence
Unit’s Global Forecasting Service, which is now freely accessible at http://gfs.eiu.com/.
The document discusses the Canadian Red Cross's use of social media in emergencies. It outlines how the Red Cross monitors social media to gather information during disasters, provide preparedness tips, and respond to calls for help. It also summarizes survey results that found over half of Canadians expect emergency responders to use social media and would follow the Red Cross on social media to receive disaster updates.
- 73% of respondents experienced at least one disruptive supply chain incident in the past 12 months, with an average of five incidents.
- 39% of analyzed disruptions originated below the immediate tier one supplier, underscoring the deep-rooted nature of disruptions.
- Unplanned IT or telecom outages jumped to the top cause of disruptions, affecting 52% of organizations to some or a high degree. Adverse weather also remained a prominent cause.
- Failure of service provision by outsourcing suppliers doubled from 2011 and joins the top three causes of disruptions.
Sustainable Landscape Design in Arid ClimatesEric832w
This document provides an introduction to sustainable landscape design in arid environments. It discusses the different types of arid climates around the world, caused by subtropical latitudes, rain shadows, continental interiors, cool ocean currents, and high altitudes. It notes that while arid regions have moisture deficits, their environments and ecologies vary greatly. Case studies in the document come from Iran, Saudi Arabia, Egypt, Sudan, Morocco, and the US, though arid lands exist in many other regions as well. The author argues that each desert presents a unique situation that changes over time with technology, culture and land use. Experience in one area may inform others, but simple classifications of problems and solutions often do not
This document provides information on sustainable landscaping practices. It defines sustainable landscaping as an attractive environment that requires minimal inputs like water, fertilizer, and pesticides while balancing the local climate. Some key practices include designing for the site conditions, improving soil quality over time through composting and soil amendments, selecting plants adapted to the climate and soils, using efficient irrigation, and incorporating windbreaks and shade trees for energy conservation. The document emphasizes that sustainable landscaping achieves long-term success through establishing short-term goals like composting and conserving water.
Tales From the Garden: Xeriscape Botanical Garden - Glendale, ArizonaEric832w
The document discusses the history and development of the Glendale Xeriscape Botanical Garden located at the Glendale Main Library. It was originally landscaped with typical water-thirsty plants but was later converted to a demonstration garden featuring over 400 species of low-water use plants from the Sonoran Desert and other arid regions. The garden has received several awards and provides an educational resource for the community to learn about water-wise landscaping. It is maintained by the City of Glendale Water Conservation Office with help from volunteer gardeners.
The 7 Principles of Xeriscape - Parker, ColoradoEric832w
The document discusses xeriscaping, a landscaping concept developed in Colorado to conserve water usage. Xeriscaping uses drought-tolerant plants and efficient irrigation systems to create landscapes that require little supplemental water. It incorporates seven principles: design with different water use zones, efficient irrigation, mulch, soil preparation, appropriate use of turf, low water use plants, and maintenance. By following these principles, homeowners can have attractive, colorful landscapes while conserving water resources.
The Complete How to Guide to Xeriscaping - Albuquerque, New MexicoEric832w
This document provides an introduction and overview of xeriscaping principles for landscaping in Albuquerque, New Mexico's high desert climate. It discusses how xeriscaping uses native and drought-tolerant plants to create low-maintenance landscapes that require one-third less water than traditional turf grass yards. The document outlines the seven principles of xeriscaping and provides photos and descriptions of suitable trees, shrubs, flowers, and groundcovers for the region. It aims to help residents design water-efficient landscapes that save water while adding beauty.
The Milk in Your Cereal Took 140 Gallons of Water to ProduceEric832w
The document is a newsletter from the Parker Water and Sanitation District that discusses water conservation. It highlights how much water is used to produce common products like milk and sugar. It encourages readers to be more aware of indirect water usage in food production and hopes this awareness can lead to long-term changes that reduce water waste. It also provides water saving tips, announces a new phone alert system, includes a holiday recipe, and advertises upcoming xeriscape classes.
The document summarizes two organic school garden programs in Berkeley, California. The Edible Schoolyard at Martin Luther King Jr. Middle School was started 10 years ago and teaches students about growing, cooking, and eating organic food. It serves as a model for other schools. The Willard Greening Project at Berkeley Unified School District is struggling after losing funding but community members are fighting to save the garden, which transformed poor soil into a productive space providing benefits to students and the community. Both gardens provide hands-on environmental education and promote social values.
The Sustainability Strategy - University of British ColumbiaEric832w
This document provides an overview of the University of British Columbia's (UBC) sustainability strategy for 2006-2010. The strategy was created in response to UBC's sustainable development policy and aims to improve social, economic, and environmental performance. It outlines goals, objectives, and action plans across three pillars: social, economic, and ecological. Some key commitments include reducing energy and water use, increasing sustainable transportation options for students/staff, ensuring ethical purchasing, and integrating sustainability into teaching/research. The strategy reflects UBC's dedication to being a leader in campus sustainability.
The Xeriscape Issue - the Gardeners’ Gazette, Deleware Master Gardeners Eric832w
This newsletter issue focuses on xeriscaping and drought-tolerant gardening. It provides summaries of articles from other publications on proving drought tolerance through testing, the science of how plants take up water, and profiles drought-resistant plants and gardens in Oregon. The issue also discusses the principles of xeriscaping, its applicability in Delaware, profiles the Mediterranean Sea Holly and 9 plants that thrive in heat and drought. Book reviews of works linking art and landscape design, and on early American founding fathers as gardeners, are also included.
Top 10 Ways Communities Can Save Water and Money - University of Victoria, Ca...Eric832w
This document provides a top 10 list of ways for communities to save water and money. Number 10 is to fix leaks to reduce water waste, which is a significant problem due to aging infrastructure. Leak detection programs that integrate regular water audits, metering, monitoring and maintenance can help identify and repair leaks. Fixing leaks can result in water savings of 5-30% and free up infrastructure capacity. The document provides examples of leak detection programs in Halifax, Nova Scotia and Las Vegas, Nevada that have significantly reduced water losses and saved money.
Turning on the tap: Helping students make informed choices about how they use...Eric832w
Water is a precious resource that needs to be conserved. This section examines students' knowledge and experiences with water. It explores how water is used differently around the world and motivates students to learn about water conservation given the global water situation. Students will recognize that fresh water is limited, understand various ways people interact with and rely on water, and appreciate their responsibility as water consumers to use it carefully.
University of Idaho Xeriscape Garden Living Plant InventoryEric832w
This document provides an inventory of plants located in the Xeriscape Garden at the University of Idaho Arboretum Botanical Garden. It includes the accession number, scientific name, cultivar, common name, quantity, and location for each plant. There are over 200 plant varieties represented in the inventory.
This document summarizes urban water efficiency programs in three cities: San Antonio, TX, Seattle, WA, and Los Angeles, CA. It provides details on the various programs each city offers, such as rebates for water efficient fixtures and appliances, education programs, and ordinances. It also highlights reported water savings from these programs, such as 175 billion gallons saved in San Antonio and 610,000 gallons per day saved through Seattle's regional partnership program. The document concludes by noting the primary water sources for each city.
Water Conservation and salmon issues for lower Fraser RiverEric832w
This document provides an overview of water issues in the lower Fraser River relevant to salmon conservation. It discusses threats to water such as pollution, diversion, climate change, and impacts from various economic sectors. It also covers ecosystem needs for fish including habitat and instream flows. The document analyzes water licensing and allocation issues and options to satisfy new water demands. It examines water law, governance, and opportunities for the Fraser Salmon and Watershed Program to engage in water policy.
Water Conservation Planning Guide - British Columbia, CanadaEric832w
This document provides a guide for communities in British Columbia to develop comprehensive water conservation plans. It outlines a 7 step process for creating a plan, including defining values and goals, compiling a water system profile, forecasting demand, setting conservation targets, reviewing conservation measures, selecting measures, and implementing the plan. The guide is intended to help smaller communities meet the requirements for infrastructure grants from the Ministry of Community and Rural Development. It includes both a workbook with checklists for each step, and a more detailed handbook providing additional resources.
Water conservation with xeriscape principles Careful plant selectionEric832w
The document discusses principles of xeriscaping or water-conservative landscaping for golf courses. It recommends starting with changing plant species around the clubhouse that require less water, such as blue grama grass or fine fescue grasses. For other areas of the course, it suggests selecting drought tolerant plant species native to the local climate, such as various grasses, shrubs and trees. Specific drought tolerant plant options are provided for different regions. With proper plant selection and maintenance, a golf course can remain attractive while conserving water.
Water Efficient Landscaping: Florida State University's Commitment to Xerisca...Eric832w
The document discusses Florida State University's commitment to implementing xeriscaping and water-efficient landscaping techniques based on the seven principles of xeriscaping. Xeriscaping conserves water through proper planning, soil analysis, selecting drought-tolerant plants, limiting turf areas, efficient irrigation, using mulches, and appropriate maintenance. FSU's 2005 Master Plan incorporates these xeriscaping principles and specifies their use in new construction and landscaping to reduce water usage and promote sustainability on campus. FSU's landscaping approach aligns with its goal of environmental stewardship and creating a sustainable campus.
Water Efficient Landscaping: Preventing Pollution and Using Resources WiselyEric832w
This document discusses water-efficient landscaping. It defines water-efficient landscaping as landscaping that produces attractive landscapes using designs and plants suited to the local climate and conditions, in order to conserve water resources. The document notes that approximately 30% of water usage in the US goes towards outdoor uses like landscaping. It provides an overview of the principles of water-efficient landscaping, including proper planning, soil improvement, appropriate plant and turf selection, efficient irrigation, mulching, and maintenance. The document also discusses the concept of "Xeriscape" landscaping, which was developed to formalize water-efficient landscaping principles.
Water: The Potential Consequences of Global Warming for Water Resources in USAEric832w
This document summarizes the key findings of a report on the potential impacts of climate change on U.S. water resources:
1) Climate change is expected to impact water resources through rising temperatures, changes in precipitation patterns, and more extreme events. This could affect water supplies, agriculture, ecosystems and increase flood and drought risks.
2) Evidence suggests some hydrologic systems are already being affected by a changing climate, through trends like rising temperatures, changes in precipitation, shrinking snowpacks and glaciers, and shifting streamflow patterns.
3) Climate change poses risks and challenges for managed water systems like infrastructure and agriculture. Adaptation will be needed to ensure resilient water management in the face of a non-station
The document describes guidelines for implementing water-wise or xeriscape landscaping to conserve water resources. It discusses seven key principles: planning and design, soil improvement, creating practical turf areas, grouping plants according to water needs, efficient irrigation, using mulch, and appropriate maintenance. Retrofitting existing landscapes to be more water efficient is also addressed. The guidelines provide specific practices under each principle to integrate low-water landscaping approaches.
This presentation includes basic of PCOS their pathology and treatment and also Ayurveda correlation of PCOS and Ayurvedic line of treatment mentioned in classics.
ISO/IEC 27001, ISO/IEC 42001, and GDPR: Best Practices for Implementation and...PECB
Denis is a dynamic and results-driven Chief Information Officer (CIO) with a distinguished career spanning information systems analysis and technical project management. With a proven track record of spearheading the design and delivery of cutting-edge Information Management solutions, he has consistently elevated business operations, streamlined reporting functions, and maximized process efficiency.
Certified as an ISO/IEC 27001: Information Security Management Systems (ISMS) Lead Implementer, Data Protection Officer, and Cyber Risks Analyst, Denis brings a heightened focus on data security, privacy, and cyber resilience to every endeavor.
His expertise extends across a diverse spectrum of reporting, database, and web development applications, underpinned by an exceptional grasp of data storage and virtualization technologies. His proficiency in application testing, database administration, and data cleansing ensures seamless execution of complex projects.
What sets Denis apart is his comprehensive understanding of Business and Systems Analysis technologies, honed through involvement in all phases of the Software Development Lifecycle (SDLC). From meticulous requirements gathering to precise analysis, innovative design, rigorous development, thorough testing, and successful implementation, he has consistently delivered exceptional results.
Throughout his career, he has taken on multifaceted roles, from leading technical project management teams to owning solutions that drive operational excellence. His conscientious and proactive approach is unwavering, whether he is working independently or collaboratively within a team. His ability to connect with colleagues on a personal level underscores his commitment to fostering a harmonious and productive workplace environment.
Date: May 29, 2024
Tags: Information Security, ISO/IEC 27001, ISO/IEC 42001, Artificial Intelligence, GDPR
-------------------------------------------------------------------------------
Find out more about ISO training and certification services
Training: ISO/IEC 27001 Information Security Management System - EN | PECB
ISO/IEC 42001 Artificial Intelligence Management System - EN | PECB
General Data Protection Regulation (GDPR) - Training Courses - EN | PECB
Webinars: https://pecb.com/webinars
Article: https://pecb.com/article
-------------------------------------------------------------------------------
For more information about PECB:
Website: https://pecb.com/
LinkedIn: https://www.linkedin.com/company/pecb/
Facebook: https://www.facebook.com/PECBInternational/
Slideshare: http://www.slideshare.net/PECBCERTIFICATION
LAND USE LAND COVER AND NDVI OF MIRZAPUR DISTRICT, UPRAHUL
This Dissertation explores the particular circumstances of Mirzapur, a region located in the
core of India. Mirzapur, with its varied terrains and abundant biodiversity, offers an optimal
environment for investigating the changes in vegetation cover dynamics. Our study utilizes
advanced technologies such as GIS (Geographic Information Systems) and Remote sensing to
analyze the transformations that have taken place over the course of a decade.
The complex relationship between human activities and the environment has been the focus
of extensive research and worry. As the global community grapples with swift urbanization,
population expansion, and economic progress, the effects on natural ecosystems are becoming
more evident. A crucial element of this impact is the alteration of vegetation cover, which plays a
significant role in maintaining the ecological equilibrium of our planet.Land serves as the foundation for all human activities and provides the necessary materials for
these activities. As the most crucial natural resource, its utilization by humans results in different
'Land uses,' which are determined by both human activities and the physical characteristics of the
land.
The utilization of land is impacted by human needs and environmental factors. In countries
like India, rapid population growth and the emphasis on extensive resource exploitation can lead
to significant land degradation, adversely affecting the region's land cover.
Therefore, human intervention has significantly influenced land use patterns over many
centuries, evolving its structure over time and space. In the present era, these changes have
accelerated due to factors such as agriculture and urbanization. Information regarding land use and
cover is essential for various planning and management tasks related to the Earth's surface,
providing crucial environmental data for scientific, resource management, policy purposes, and
diverse human activities.
Accurate understanding of land use and cover is imperative for the development planning
of any area. Consequently, a wide range of professionals, including earth system scientists, land
and water managers, and urban planners, are interested in obtaining data on land use and cover
changes, conversion trends, and other related patterns. The spatial dimensions of land use and
cover support policymakers and scientists in making well-informed decisions, as alterations in
these patterns indicate shifts in economic and social conditions. Monitoring such changes with the
help of Advanced technologies like Remote Sensing and Geographic Information Systems is
crucial for coordinated efforts across different administrative levels. Advanced technologies like
Remote Sensing and Geographic Information Systems
9
Changes in vegetation cover refer to variations in the distribution, composition, and overall
structure of plant communities across different temporal and spatial scales. These changes can
occur natural.
A review of the growth of the Israel Genealogy Research Association Database Collection for the last 12 months. Our collection is now passed the 3 million mark and still growing. See which archives have contributed the most. See the different types of records we have, and which years have had records added. You can also see what we have for the future.
हिंदी वर्णमाला पीपीटी, hindi alphabet PPT presentation, hindi varnamala PPT, Hindi Varnamala pdf, हिंदी स्वर, हिंदी व्यंजन, sikhiye hindi varnmala, dr. mulla adam ali, hindi language and literature, hindi alphabet with drawing, hindi alphabet pdf, hindi varnamala for childrens, hindi language, hindi varnamala practice for kids, https://www.drmullaadamali.com
Water Conservation Survey - British Columbia, Canada
1. 2004
BC Water Conservation Survey
PREPARED FOR: B.C. Ministry of Water, Land and Air
Protection
BCWWA Water Sustainability Committee
PREPARED BY: Alliance Professional Services
CV Marketing Research Inc.
COMPLETED: May 2004
Knowing Is Better
All Rights Reserved. Printed in Canada.
Phone: 1-866-8-SURVEY (787839) Toll free
Fax: 1-866-864-0588 Toll free
E-mail: research@cv-market.com
Web-site: www.cv-market.com
2. 2004 BC Water Conservation Survey
TABLE OF CONTENTS
1.0 EXECUTIVE SUMMARY.................................................................................................................. 3
1.1 SURVEY OBJECTIVES ...................................................................................................................... 3
1.2 EXPECTED GROWTH AND WATER MANAGEMENT CHALLENGES ......................................................... 3
1.3 BCWAA WATER SUSTAINABILITY COMMITTEE WEBSITE ................................................................... 5
1.4 OPERATIONS AND MANAGEMENT TOOLS .......................................................................................... 5
1.5 LEAD-BY-EXAMPLE TOOLS .............................................................................................................. 6
1.6 RESIDENTIAL EDUCATION AND CONSULTATION TOOLS ...................................................................... 6
1.7 AGRICULTURAL EDUCATION AND CONSULTATION TOOLS ................................................................... 7
1.8 ECONOMIC AND FINANCIAL TOOLS ................................................................................................... 7
1.9 PARTNERSHIPS AND CO-OPERATIVE EFFORTS.................................................................................. 8
1.10 LONG-TERM PLANNING TOOLS ....................................................................................................... 8
1.11 LEGAL TOOLS ............................................................................................................................... 9
2.0 METHODOLOGY ........................................................................................................................... 10
2.1 COLLECTION ................................................................................................................................. 10
2.2 MARGIN OF ERROR ....................................................................................................................... 10
3.0 DETAILED RESULTS.................................................................................................................... 11
3.1 GENERAL UTILITY INFORMATION..................................................................................................... 11
3.2 BCWWA WATER SUSTAINABILITY COMMITTEE WEBSITE ................................................................ 27
3.3 OPERATIONS AND MANAGEMENT TOOLS ........................................................................................ 30
3.4 LEAD-BY-EXAMPLE TOOLS ............................................................................................................ 39
3.5 RESIDENTIAL EDUCATION AND CONSULTATION TOOLS .................................................................... 45
3.6 AGRICULTURAL EDUCATION AND CONSULTATION TOOLS ................................................................. 52
3.7 ECONOMIC AND FINANCIAL TOOLS ................................................................................................. 57
3.8 PARTNERSHIPS AND CO-OPERATIVE EFFORTS................................................................................ 61
3.9 LONG-TERM PLANNING TOOLS ....................................................................................................... 65
3.10 LEGAL TOOLS ............................................................................................................................. 69
4.0 SURVEY INSTRUMENT ................................................................................................................ 73
2
3. 2004 BC Water Conservation Survey
1.0 EXECUTIVE SUMMARY
The Executive Summary is a brief account of the research findings, which are
outlined in greater depth in the Detailed Results section of this report.
1.1 Survey Objectives
CV Marketing Research, in conjunction with Alliance Professional Services,
conducted an online survey of water utilities in British Columbia to determine
water conservation policies, practices, and projects. Of the 190 utility managers
who were asked to take part, 72 actually participated. The information generated
will help promote the development of appropriate programs and services,
contribute to the creation of best management practices, and enable water
managers to learn from the successes of other utilities.
1.2 Expected Growth and Water Management Challenges
Overall, the majority of water utilities surveyed are anticipating that population
growth in their regions will necessitate system expansion. While nearly 2 in 3
(65%) are confident that their existing water license will allow for the projected
population growth in their area, well over half (56%) project that their existing
infrastructure will not. As such, more than 3 in 4 utilities (77%) are currently
planning to undertake system expansion. The majority of these utilities (88%) are
committing funds for this expansion, with only a few not relying heavily on
government funding to pay for their expansions.
While just 1 in 3 (34%) utilities have currently embarked on a demand
management program to reduce water consumption, over half of those that have
not are considering doing so in the future (54%). Expectations of the costs for
such a program vary between 1 and 5 percent of their operating budget, with few
expecting to exceed this level.
Increasing infrastructure appears to be the leading cause for embarking upon or
considering implementing a demand management system. Limited source
quantity is a strong secondary factor. A multitude of other factors are also driving
utilities to pursue demand management systems, including public demand, urban
growth, and environmental stewardship. Less critical to the decision to pursue
this system are agricultural demands and adaptation for climate change (see
Figure 1 on following page).
3
4. 2004 BC Water Conservation Survey
The greatest barrier for Figure 1
utilities to achieving their
Factors Encouraging Implementation or
water conservation
Consideration Of A Demand Management System
objectives appears to be
the cost of doing so, with Increas ing infras tructure
62%
over half of those 36%
surveyed considering this Lim ited s ource quantity
52%
to be a major challenge. 31%
38%
Competing priorities are a Public dem and
51%
secondary challenge that 31%
Public apathy / lack of awarenes s
they encounter somewhat 54%
less often. Less significant Urban growth
31%
52%
challenges or barriers
31%
include lack of education Aging infras tructure
54%
and communication, and 30%
Environm ental s tewards hip
lack of planning. 56%
28%
Potential drought
40%
Fewer than 1 in 3 utilities
25%
are using performance Im pacts on water quality
53%
measures to gauge 16%
Im pacts on fis h / habitat flows A Primary
whether they are achieving 41%
Consideration
their conservation Com peting us es
13% A Secondary
19%
objectives. However, Consideration
8%
nearly half of those who Adaptation for clim ate change
50%
are not currently using 6%
Agricultural dem ands
these measures (48%) are 17%
planning on using them in % of Respondents 0% 20% 40% 60% 80% 100%
the future.
When it comes to best management practices (BMPs), a significant number of
utilities are considering implementing them, but few are using them. The most
used BMP – establishing a metering plan to account for water use and losses –
has been adopted by just under 1 in 3 utilities (31%), although it is being
considered by another 44%. Other BMPs being commonly used or considered
include developing a water distribution system renewal plan (30% are using one,
41% are considering using one), water conservation (27% / 49%), and cross-
connection control (27% / 39%).
When seeking technical information, utility managers are most frequently turning
to professional consultants (54%), while water related associations (52%), and
seminars and conferences (46%) are other popular sources.
4
5. 2004 BC Water Conservation Survey
1.3 BCWWA Water Sustainability Committee Website
Figure 2 Nearly all utility managers surveyed
Perceived Value of BCWWA Com m ittee Website indicated that a website developed
by the BCWWA Water Sustainability
Committee to provide stakeholders
Occasionally with up-to-date information about
No real help
helpful tool / programs, water management
or benefit
resource
2%
initiatives, best management
63% practices, and utility- specific
success stories would be a helpful
Don't know
resource (see Figure 2). Nearly 1 in
5%
3 (31%) stated that such a website
Invaluable
would be an invaluable tool or
tool /
resource resource, while the majority of all
31% others (63%) felt that it would at the
very least be an occasionally helpful
tool or resource.
1.4 Operations and Management Tools
Of the operations and Figure 3
management tools most Te n Most Commonly Used Ope ra tions a nd
commonly used by utilities, Ma nageme nt Tools
emergency response plans Emergency response plan
69%
26%
are the most widespread,
66%
with more than 2 in 3 Commercial / Industrial metering
16%
utilities using these (see
52%
Figure 3). Commercial Water supply upgrades
33%
metering, water supply 50%
V oluntary w ater restrictions
upgrades, and voluntary 21%
water restrictions are also 47%
Computer upgrades
commonly used by at least 19%
half of those surveyed. 45%
Watershed protection
Tools that are used less 38%
frequently but are strongly Leak-detection program
31%
43%
being considered include
residential metering (49%), Residential metering
24%
49%
leak detection programs
(43%), and watershed A gricultural metering
23% Currently in
13% Place
protection (38%).
22% Being
Water audits 27% Considered
% of Re s ponde nts 0% 20% 40% 60% 80%
5
6. 2004 BC Water Conservation Survey
1.5 Lead-By-Example Tools
When it comes to leading by Figure 4
example, there are numerous
Lead By Example Tools
tools that are currently in place 75%
Operator education / training
within many BC utilities (see 13%
Figure 4). Three of 4 managers Employee education
50%
26%
surveyed have operator Water conservation applied to operations and 46%
education and training maintenance 28%
programs in place, while 1 in 2 Early leak detection and repair 45%
have other employee 29%
34%
education programs in place. Efficient outdoor w ater use and landscaping
25%
Other commonly used tools 32%
Education for elected officials
include water conservation 28%
applied to operations and Conservation library
23%
17%
maintenance (46%) and early
Low -flow fixture or retrofit program 23%
leak detection and repair 28%
(45%). While other tools and Reduced w ater pressure in buildings 19%
15% Currently using
programs are less commonly
2%
used, a large number of Greyw ater recycling 19%
Being considered
utilities are at least considering % of Respondents 0% 20% 40% 60% 80%
adopting a number of these.
1.6 Residential Education and Consultation Tools
Figure 5
Eight Most Commonly Used Residential
Numerous tools are used
Education / Consultation Tools to educate and consult
with residential users, but
61%
Media
9%
conventional media (61%),
58%
billing enclosures (58%),
Information with billing
23% and stand-alone
Stand-alone publications 54% publications (54%) are the
11% most frequently used (see
Website
44% Figure 5). Websites are
28%
used by just under half of
School programs,events and/or 31%
contests 17%
the utilities surveyed while
31%
more focussed programs,
Community events
22% such as school and
Publications for school children 29% Currently in place
community events are
18%
Being considered
used by just under 1 in 3
Workshops & Seminars
21% utilities.
17%
% of Respondents 0% 20% 40% 60% 80%
6
7. 2004 BC Water Conservation Survey
1.7 Agricultural Education and Consultation Tools
In contrast to education and Figure 6
consultation tools for
Six Most Commonly Used Agricultural Education /
residential water users, utility
Consultation Tools
managers appear to employ
far fewer methods for 38%
Information with
agricultural and ICI users billing 21%
(see Figure 6). Specifically,
efforts are far more focussed, 36%
Website
as evidenced by the common 18%
use of billing enclosures and
website information. Unlike Voluntary watering 32%
restrictions
for residential users, standard 8%
media and stand-alone
Stand-alone 31%
publications are used far less publications 8%
often to reach agricultural
and ICI users. It also appears 30%
that fewer utilities are Media
14%
planning on adopting new Currently using
education and consultation Community events
25%
Being considered
tools for these users, with 14%
most tools being considered
by less than 20% of utilities. % of Respondents 0% 20% 40% 60%
1.8 Economic and Financial Tools
Figure 7
Top Five Economic And Financial Tools Overall, few utilities are
utilising any formal
Analysis / study of 33% economic or financial
universal metering
or metering pilot 27%
tools to promote water
conservation (see
Cost / benefit
28%
Figure 7). The most
analysis of current
programs / projects 16%
widely used tool –
analysis and study of
Assessment of 26%
universal metering or
pricing structure 46% metering pilot – is
employed by just 1 in 3
22%
utilities surveyed, and is
Service charges
9%
being considered by just
over 1 in 4. Other tools
Currently in place employed include cost /
Fines for excess 18%
use Being considered benefit analysis,
16%
assessment of pricing
% of Respondents 0% 10% 20% 30% 40% 50% structures, and service
7
8. 2004 BC Water Conservation Survey
charges. While assessing pricing structures is not currently widespread, nearly
half of utilities surveyed (46%) do appear to be considering implementing this in
the future.
1.9 Partnerships and Co-operative Efforts
Figure 8
Compared with use of other tools and
management practices, the area of Top Five Partnerships And Co-operative Efforts
partnerships and co-operative efforts
Partnership /
to promote conservation is relatively cooperation w ith
27%
neglected (see Figure 8). In terms of other w ater utilities 5%
current partnerships, the most
Partnership /
common are with other water utilities cooperation w ith
27%
and regional governments at 27% of regional government 18%
utilities surveyed. Partnerships with
Partnerships /
neighbouring jurisdictions are nearly cooperation w ith 20%
as common (1 in 5 utilities), as are neighbouring v 16%
jurisdiction
partnerships with the provincial
Partnership /
government. Interestingly, it appears cooperation w ith 20%
that if utility managers have not provincial 9%
already established partnerships, they government Currently promoting
are unlikely to do so in the future. In Partnership / 16%
Being considered
terms of planned co-operative efforts, cooperation w ith
federal government 9%
18% of utilities do intend to pursue
partnership with regional % of Respondents 0% 10% 20% 30%
governments, while 16% intend to
pursue partnerships with neighbouring
jurisdictions. Figure 9
Top Five Long-Term Planning Tools
1.10 Long-Term Planning
71%
Tools Local or regional
land use planning
14%
Most utilities appear to be quite 59%
Long-range capital
forward thinking, as evidenced planning
27%
by the large number that
employ multiple long-term Growth
49%
planning tools (see Figure 9). management
27% Currently in place
planning
Overall, this focus on long-term Being considered
planning coincides with the Quality / continuous
49%
large number of utilities’ focus improvment
planning 32%
on implementing performance
measures in the near future 48%
Strategic planning
(see Section 1.1). About 7 in 10 30%
utilities have local or regional
land use planning in % of Respondents 0% 20% 40% 60% 80%
8
9. 2004 BC Water Conservation Survey
place and about 3 in 5 have long-range capital planning in place. In addition,
nearly half of utilities have growth management planning, quality and continuous
improvement planning, and strategic planning in place to promote water
conservation.
1.11 Legal Tools
Figure 10 Legal tools are another area
Long-Term Planning Tools that most utilities are using to
promote water conservation
62%
Bylaws
21%
(see Figure 10). Not
surprisingly, by-laws are the
Mandatory 49%
restrictions 23%
most common tool used, with
nearly 2 in 3 of those
43%
Regulations surveyed reporting their use.
23%
Mandatory restrictions are
41%
Standards also commonly used, as
25%
nearly half of utilities employ
23%
Licensing
18%
these. Other popular legal
tools include regulations and
21%
Zoning restrictions
23%
standards. Less commonly
Currently in Place
used tools include licensing
Restrictive Being Considered
covenants
12% (23%), zoning restrictions
14%
(21%) and restrictive
% of Respondents 0% 20% 40% 60% 80% covenants (12%), although
nearly 1 in 4 utilities surveyed
are considering the use of
zoning restrictions (23%).
9
10. 2004 BC Water Conservation Survey
2.0 METHODOLOGY
2.1 Collection
The 72-sample survey was collected via an online questionnaire emailed to
nearly 200 water utility managers across British Columbia. The survey
questionnaire, which was developed in collaboration with Alliance Professional
Services, was initially emailed to managers in late March as part of a cover letter
that requested their participation and subsequently outlined the survey
requirements. The questionnaire contained 65 open and closed-ended questions
to be completed by each utility manager. To help facilitate the considerable
length of the survey, respondents were assigned a unique login code, which
allowed them to save their progress and continue the survey at multiple intervals.
Survey progress was monitored over the ensuing month and a half, and frequent
follow-up calls were performed to assist and encourage further participation and
detail. Collection of the survey was finally closed in mid-May and the results
processed and detailed in the body of this report.
2.2 Margin Of Error
The margin of error for a 72-sample survey of a 190-element population is at
most + 9.1%. In other words, if all 190 water utility managers in British Columbia
had participated in the survey, the results of that survey would be within no more
than 9.1 percentage points of the results of this one, 19 times out of 20.
10
11. 2004 BC Water Conservation Survey
3.0 DETAILED RESULTS
3.1 GENERAL UTILITY INFORMATION
Q1. How many connections do you service?
IF MORE THAN 10,000:
Number of Connections
Percent Respondents How many?
Serviced
Fewer than 300 12.9% 9 • over 13,000
• 13,500
Between 300 and 1,000 27.1% 19
• 14,000
Between 1,000 and
35.7% 25 • 16,000
5,000 • 17,000 total
Between 5,000 and
5.7% 4 • 19,500
10,000 • 20,960
More than 10,000 18.6% 13 • 24,000
• 28,666 (2002)
Valid Sample 100.0% 70 • 30,000
• 38,000
• 100,000
Q2. What percentages of these connections are:
A. Domestic? B. Agricultural? C. ICI?
Mean Percentage of
83.17% 4.91% 11.92%
Connections By Type
Connections By Type Domestic Agricultural ICI
None (0%) 1.7% 65.0% 8.3%
1-25% 0.0% 30.1% 80.0%
26-50% 3.3% 3.3% 11.7%
51-75% 15.0% 0.0% 0.0%
76-99% 75.0% 0.0% 0.0%
All (100%) 5.0% 1.7% 0.0%
Valid Sample 60 60 60
11
12. 2004 BC Water Conservation Survey
Q3. What is the source of your water supply?
Source of Water Supply Percent Respondents
Surface water 40.6% 28
Groundwater 31.9% 22
Combination of surface
27.5% 19
water and groundwater
Valid Sample 100.0% 69
IF GROUNDWATER PART OF SOURCE: Q4. What is the estimated volume
of groundwater pumped annually?
M3 / Year 1,900,000 82,125,000
3,700 2,150,000 212,000,000
5,000 2,182,461 990,000,000
17,600 2,335,000 Igal / Year
25,375 2,770,000 2,000,000
48,679 2,800,000 11,124,240
150,000 3,300,000 115,000,000
320,000 4,875,460 130,000,000
330,000 6,300,000 160,000,000
550,000 10,680,000 365,000,000
1,041,000 Usgal / Year 410,000,000
1,600,000 60,000,000
Note: Each figure in the table above represents the unique amount specified by each water utility.
12
13. 2004 BC Water Conservation Survey
Q5. What is the projected annual rate of population growth in the area
serviced by your utility?
Projected Rate of
Population Percent Respondents
Growth
0% to 2% 71.4% 50
>2% to 4% 27.1% 19
>4% 1.4 1
Valid Sample 100.0% 70
Q6. Do you think your existing water license allows for this rate of growth
to the year 2020?
Water License
Will Allow For Percent Respondents
Projected Growth
Yes 64.6% 42
No 23.1% 15
Do not know 12.3% 8
Valid Sample 100.0% 65
13
14. 2004 BC Water Conservation Survey
Q7. Do you think your existing infrastructure will support this rate of
growth until 2020?
Existing
Infrastructure
Percent Respondents
Will Allow For
Projected Growth
Yes 36.8% 25
No 55.9% 38
Do not know 7.4% 5
Valid Sample 100.0% 68
Q8a. Are you currently planning system expansion?
Planning System
Percent Respondents
Expansion
Yes 76.8% 53
No 23.2% 16
Valid Sample 100.0% 69
14
15. 2004 BC Water Conservation Survey
IF PLANNING SYSTEM EXPANSION: Q8b. Are you committing funds for
system expansion?
Committing Funds For
Percent Respondents
System Expansion
Yes 88.2% 45
No 11.8% 6
Valid Sample 100.0% 51
IF NOT COMMITTING FUNDS: Q9. How do you plan to fund system
expansion?
Plans To Fund System
Percent Mentions
Expansion
Government funding 83.3% 5
Development cost
50.0% 3
charges
Increased customer rates 50.0% 3
Other (See below) 33.3% 2
Public / private
0.0% 0
partnership
Based on 6 respondents who were qualified to answer this question.
‘OTHER’ TYPE OF FUNDING:
• A grant from the GWAIL, which is a trust grant from the provincial government.
• RD funding through an infrastructure grant.
15
16. 2004 BC Water Conservation Survey
Q10. Do you work with an advisory committee that guides you on water
conservation issues?
Work With
Advisory Percent Respondents
Committee
Yes 26.1% 18
No 73.9% 51
Valid Sample 100.0% 69
Q11. Do you work with stewardship groups to promote water
conservation?
Work With
Stewardship Percent Respondents
Groups
Yes 26.1% 18
No 73.9% 51
Valid Sample 100.0% 69
16
17. 2004 BC Water Conservation Survey
Q12. Have you embarked on a demand management program to reduce
water consumption?
Have Embarked
Percent Respondents
On DMP
Yes 34.3% 24
No 65.7% 46
Valid Sample 100.0% 70
IF HAVE NOT EMBARKED ON DMP: Q13. Are you considering
implementing a demand management program?
Considering
Implementing Percent Respondents
DMP
Yes 54.3% 25
No 45.7% 21
Valid Sample 100.0% 46
17
18. 2004 BC Water Conservation Survey
IF YOU HAVE IMPLEMENTED OR ARE CONSIDERING IMPLEMENTING
DMP: Q14. What percentage of your operating budget will be applied
to such a program?
Percentage of ‘OTHER’ AMOUNTS:
Operating Budget Percentage Respondents
Applied to DMP • Twenty percent
• Seventy-one percent
Zero percent 10.5% 2
One percent 21.1% 4
Two percent 15.8% 3
Three percent 5.3% 1
Four percent 10.5% 2
Five percent 26.3% 5
More than five
10.5% 2
percent
Valid Sample 100.0% 19
18
19. 2004 BC Water Conservation Survey
Q15. How important are each of the following reasons for embarking on
or considering a demand management system:
Importance of Reason
Reasons For Valid
Implementing DMP A Primary A Secondary Not A Sample
Consideration Consideration Consideration
Increasing infrastructure 62.3% 35.8% 1.9% 53
Limited source quantity 51.9% 30.8% 17.3% 52
Public demand 37.7% 50.9% 11.3% 53
Public apathy / lack of
31.3% 54.2% 14.6% 48
awareness
Aging infrastructure 30.8% 53.8% 15.4% 52
Urban growth 30.8% 51.9% 17.3% 52
Environmental
30.0% 56.0% 14.0% 50
stewardship
Potential drought 28.3% 39.6% 32.1% 53
Impacts on water quality 25.5% 52.9% 21.6% 51
Impacts on fish / habitat
15.7% 41.2% 43.1% 51
flows
Competing uses 12.5% 18.8% 68.8% 48
Adaptation for climate
8.0% 50.0% 42.0% 50
change
Agricultural demands 5.8% 17.3% 76.9% 52
‘OTHER’ REASONS CONSIDERED FOR EMBARKING ON DMP:
• A requirement of the government grant we received for our water plant upgrade.
• Demand management was required by the provincial government to process a new
water license application.
• Loss of fire protection.
• Reduced energy and treatment costs.
• Reduction in water wastes and shift of peak use.
19
20. 2004 BC Water Conservation Survey
Q16. How significant are each of these potential challenges or barriers to
achieving your water conservation objectives:
Significance of Challenge / Barrier
Potential
A Major A Moderate Not A Valid
Challenges /
Challenge/ Challenge/ Challenge/ Sample
Barriers
Barrier Barrier Barrier
Cost 51.6% 35.9% 12.5% 64
Competing priorities 33.9% 35.5% 30.6% 62
Lack of education
and / or 15.9% 55.6% 28.6% 63
communication
Lack of planning 13.1% 50.8% 36.1% 61
Legislative
12.3% 36.8% 50.9% 57
inadequacies
Jurisdictional
12.3% 36.8% 50.9% 57
complexities
Lack of data 10.9% 37.5% 51.6% 64
Lack of coordination /
cooperation among 9.7% 46.8% 43.5% 62
stakeholders
‘OTHER’ CHALLENGES OR BARRIERS OF SIGNIFICANCE:
• Land claim issues.
• Political will to charge.
• SEKID's demand program focused on agricultural water use because it is about eighty-
five percent.
• Willingness of reducing water waste.
20
21. 2004 BC Water Conservation Survey
Q17. “Performance Measures” compare the observed results of water
conservation tools to intended results. Is your utility using performance
measures to determine if you have achieved your water conservation
objectives?
Using
Performance Percent Respondents
Measures
Yes 29.2% 19
No 70.8% 46
Valid Sample 100.0% 65
IF USING PERFORMANCE MEASURES: Q18. What data are you collecting
to measure performance?
• A daily water demand, which is system wide, weather conditions and power
consumption records.
• Average daily consumption peak and daily consumption.
• Continuous flow monitor.
• Daily demand trial metering program.
• Flow monitoring data.
• Individual water use by property, annual water use by district, and water supply
and storage inventory.
• Limited data because all customers are not metered. We are using treatment
plant production numbers.
• Meter reading data.
• Overall liters per capita per day, demand by ICI sectors peak day use by
member municipalities.
• Residential consumption per capita and summer consumption peak.
• The amount of water going out compared to that coming in.
• The annual power consumption.
• Water consumption rates each day.
• Water meters.
21
22. 2004 BC Water Conservation Survey
IF NOT CURRENTLY USING PERFORMANCE MEASURES: Q19. Are you
considering using performance measures in the future?
Considering
Using PM’s In Percent Respondents
Future
Yes 47.8% 22
No 21.7% 10
Do not know 30.4% 14
Valid Sample 100.0% 46
Q20A. “Best Management Practices” are industry-accepted procedures
used by organisations to maximise the efficiency and cost-effectiveness of
specific initiatives. Please indicate which areas, if any, your utility is using
best management practices in:
Currently Considering Valid
Best Management Practices Neither
Using Using Sample
Water accountability / establishing
a metering plan to account for 30.5% 44.1% 25.4% 59
water use and losses
Developing a water distribution
30.4% 41.1% 28.6% 56
system renewal plan
Water conservation 27.1% 49.2% 23.7% 59
Cross connection control 27.1% 39.0% 33.9% 59
Reducing losses in transmission
25.9% 44.8% 29.3% 58
and distribution systems
Uni-directional flushing 25.0% 26.7% 48.3% 60
Water utility planning 24.6% 33.3% 42.1% 57
Water pricing and rates setting 23.7% 40.7% 35.6% 59
Deterioration and inspection of
21.7% 43.3% 35.0% 60
water distribution systems
22
23. 2004 BC Water Conservation Survey
Q20B. Now, for each of the above BMPs that your utility is currently
using or considering, please describe its origin:
Water conservation:
• BCWWA 2 mentions
• Ad hoc
• AWWA
• AWWA and EPCORE developed programs.
• Developed internally.
• Metering
• Water conservation study by Dayton & Knight Ltd.
Cross connection control:
• AWWA 3 mentions
• BCWWA 2 mentions
• AWWA and BCWWA.
• BCWWA cross connection control course.
• Internally. Public Works Inspection prior to connecting to a Municipal Utility.
• Staff trained in CCC Survey program management.
• Ted Van der Gulik
Uni-directional flushing:
• AWWA 3 mentions
• AWWA BCWWA 2 mentions
• BCWWA
• BCWWA distribution courses and SAC manuals.
• Consultants
• Consulting Engineer
• EPCORE developed and marketed product.
• Internally. Public Works flushes from source to the outlying distribution areas.
Deterioration and inspection of water distribution systems:
• AWWA
• AWWA and BCWWA.
• BCWWA
• Engineering firm.
• EPCORE developed product.
• Replacing all old cast iron distribution lines with PVC.
• Reviewed with Consulting Engineer.
• This is not done. We currently keep track of the ages of pipe and the material.
23
24. 2004 BC Water Conservation Survey
Q20B. continued
Reducing losses in transmission and distribution systems:
• As above, we are replacing all old cast iron distribution lines with PVC.
• AWWA
• AWWA and BCWWA.
• AWWA and Epcor expertise.
• BCWWA
• Engineering firm.
• IWA
Water accountability / establishing a metering plan to account for water use
and losses:
• Ad hoc
• AWWA and BCWWA.
• BCWWA
• District of Port Hardy and an EPCOR plan.
• Have started industrial and commercial metering program. We are about
seventy-five percent complete.
• Only commercial on meters. No funds to put residential on meters.
• Self
Water pricing and rates setting:
• Agriculture only and this was developed internally.
• As above, we have started industrial and commercial metering program. We
are about seventy-five percent complete.
• AWWA
• AWWA and BCWWA
• AWWA and Port Hardy.
• In-house
• Staff currently amending water bylaw and fees. Consistently being monitored
and compared to operating costs and neighboring municipalities.
24
25. 2004 BC Water Conservation Survey
Q20B. continued
Water utility planning:
• AWWA
• AWWA and BCWWA.
• BCWWA
• Epcor and AWWA.
• In-house
• Subdivision expansion, rural water line expansion.
• This is updated every two to three years.
• We have budgeted in 2004 an update to our 1994 Dayton & Knight Water
Supply Study.
Developing a water distribution system renewal plan:
• AWWA
• AWWA and BCWWA.
• Consultant and water model.
• Engineering firm.
• Internal planning.
• Line replacement in progress and is ongoing for over twenty years.
• As above, we have budgeted in 2004 an update to our 1994 Dayton & Knight
Water Supply Study.
Other BMP'S currently being used or considered:
• Hydrometric assessment of watershed.
• Water audits of municipal facilities. Using artificial neural networks to reduce
chemical costs and optimize water quality. Benchmarking.
25
26. 2004 BC Water Conservation Survey
Q21. Where do you get technical information to help you manage your
system?
Sources of Technical
Percent Mentions
Information
Consultants 54.0% 34
Water related associations 52.4% 33
Seminars / conferences 46.0% 29
Reference materials 39.7% 25
Other water utilities 38.1% 24
Other (See below) 11.1% 7
Based on 63 respondents who provided a response to this question.
‘OTHER’ SOURCES:
• Benchmarking with other utilities and industries.
• Department of Health Officer.
• EPA and Canadian Drinking Water Guidelines.
• Our own internal modeling.
• Parts distributors.
• Provincial and Federal agencies.
• The web.
26
27. 2004 BC Water Conservation Survey
3.2 BCWWA WATER SUSTAINABILITY COMMITTEE WEBSITE
A website focusing on timely water issues and initiatives is in the early
stages of development by the BCWWA Water Sustainability Committee.
Intended for all stakeholders in BC, the website would provide up-to-date
information about programs, water management initiatives, best
management practices, and utility specific success stories. It would also
provide opportunities for information sharing and discussion.
Q22. As a potential resource for your department, would you consider
such a website to be an invaluable tool or resource, an occasionally helpful
tool or resource, or of no real help or benefit?
Perceived Value Of
Percent Respondents
BCWWA Website
An invaluable tool /
31.3% 20
resource
An occasionally helpful
62.5% 40
tool / resource
Of no real help or benefit 1.6% 1
Do not know 4.7% 3
Valid Sample 100.0% 64
Q23A. If you support the development of such a website, what
components, features, and services would you like to see included?
• Approved water use fixtures outside watering tips.
• BMP, water management initiatives, seminars and courses.
• Calculation of user rates, programs for unaccounted losses, public relations and
communications.
• Case histories of various communities with water conservation methods, capital
and costs of various municipal plants and distribution systems.
• Consumption and some characteristics.
• Cross connection practices, treatment problem solving, source protection,
testing problems and practices and cost saving measures.
• Current technologies and updates.
27
28. 2004 BC Water Conservation Survey
Q23A. continued
• Groundwater issues and water treatment.
• High degree of user friendliness. Make navigation easy.
• Information on small water systems.
• Latest legislation online, such as drinking water and a question and answer
section or forum.
• Links to their industry sites, regulations, manufactures, associations, research
organizations, information on incoming regulatory changes, other industry
news, and an exchange of ideas and information.
• Material specifications and BMPs.
• My preference would be that this function would be better handled by a
government ministry, such as WLAP, where there would be less influence by
commercial interests.
• Not on Internet or public works.
• Posted BMPs with links to their locations, case studies, program development
examples and opportunities to post.
• Product lines, troubleshooting, guides resource and directories.
• Programs, training, conservation methods, new initiatives, best management
practices, plus changes in legislation.
• Such a website would be most useful if it sets out to promote and support
specific actions of reducing water wastes and optimizing system peak
distribution by advocating new technologies, regulations or policies, and
information on available resources.
• Training to use a computer.
• Water conservation frequently asked questions in a downloadable format.
• Water restriction policies, enforcements, water meter hints, bylaws, procedures,
and etceteras.
• We do not have high-speed Internet and have difficulty accessing some
websites.
• While water sustainability is important, our biggest challenge at this time is
satisfying all the legal requirements under the drinking water protection act.
Perhaps it would be helpful if some attention could be focused on this issue
also.
28
29. 2004 BC Water Conservation Survey
Q23B. If you do not support the websites development or would not use
it, what could be added to make it a useful tool or resource for your
department?
• AWWA has a website so piggy back with the CWWA and BCWWA sites.
Provide a special informational section. Providing another source is duplication
and not beneficial to the CWWA and BCWWA sites.
• Information sharing and discussion, and best management practices would be
useful.
• Water management initiatives in other communities, cost related information
associated initiatives and derived benefits.
29
30. 2004 BC Water Conservation Survey
3.3 OPERATIONS AND MANAGEMENT TOOLS
Q24. Please indicate which operations and management tools are in place or
are being considered by your utility:
Currently Being Don't Valid
Operations / Management Tools Neither
In Place Considered Know Sample
Emergency response plan 69.0% 25.9% 5.2% 0.0% 58
Commercial / Industrial metering 65.5% 15.5% 19.0% 0.0% 58
Water supply upgrades 51.7% 32.8% 15.5% 0.0% 58
Voluntary water restrictions 50.0% 20.7% 25.9% 3.4% 58
Computer upgrades 47.5% 18.6% 33.9% 0.0% 59
Watershed protection 44.8% 37.9% 13.8% 3.4% 58
Leak-detection program 31.0% 43.1% 24.1% 1.7% 58
Residential metering 23.7% 49.2% 25.4% 1.7% 59
Agricultural metering 23.2% 12.5% 62.5% 1.8% 56
Water audits 21.8% 27.3% 43.6% 7.3% 55
Benchmarking 17.9% 21.4% 42.9% 17.9% 56
Sector demand study or pilot 15.8% 22.8% 47.4% 14.0% 57
Climate comfort systems 13.8% 12.1% 65.5% 8.6% 58
Pilot programs or projects 13.0% 16.7% 59.3% 11.1% 54
"Green" design / Smartgrowth 12.1% 19.0% 55.2% 13.8% 58
Voluntary in-home, low-low fixture program 10.3% 31.0% 50.0% 8.6% 58
Xeriscaping program 7.1% 16.1% 58.9% 17.9% 56
Low-flow fixture / retrofit program 5.2% 31.0% 55.2% 8.6% 58
Water reclamation, re-use, recycling programs 5.2% 22.4% 63.8% 8.6% 58
Agricultural / irrigation technologies & programs 3.5% 8.8% 73.7% 14.0% 57
Residential technologies and programs 3.4% 15.5% 63.8% 17.2% 58
Industrial & commercial technologies / programs 3.4% 10.3% 67.2% 19.0% 58
30
31. 2004 BC Water Conservation Survey
Q24. continued
‘OTHER’ OPERATIONS / MANAGEMENT TOOLS:
CURRENTLY IN PLACE
• A “Water Wise" program outlining a five-year plan to reduce water use.
BEING CONSIDERED
• Low flush toilet fixtures and sprinkler restrictions in the summer.
• Training seminars and PM programs.
• Weekly education programs.
NOT SPECIFIED WHETHER CURRENTLY IN PLACE OR BEING CONSIDERED
• A telemetry system from water release for storage to greatly reduce waste.
• Peak demand reduction programs and customer cost sharing.
• Public education on conservation.
• Water conservation such as sprinkling enforcement.
31
32. 2004 BC Water Conservation Survey
Q25. Which operations and management tool would you consider most effective
in helping achieve your water conservation objectives? Why?
• Metering 5 mentions
• Best management practices.
• Bylaw implementations.
• Customer education and awareness. If the customer does not understand the
need, they will not buy into the process.
• Demand study so we can locate other sources of water.
• Educating the user because they use the resource.
• Education and dole values, agriculture and possibly meters for residential.
• Education. For a small cost a lot can be accomplished.
• Education; low flow fixtures. Water is too easy to waste.
• Flow monitoring and commercial and residential metering.
• Kid’s education program.
• Leak detection of the old infrastructure.
• Leak detection, as we are able to quantify how much the system is leaking.
• Mandatory watering restrictions and low flow fixture installation in new pumps.
• Metering for tracking of consumption and to identify problem areas.
• Metering. Direct customer accountability through customer and pay philosophy.
• Meters. People with meters use less water. They have been in place here since the early 60's.
• One sprinkler and water early morning or evening.
• Public education on education and voluntary restrictions.
• Public involvement.
• Residential metering and high irrigation demands.
• Residential metering over capacity in summer.
• Residential metering, customer awareness and a great planning tool, watering audits,
assist with customer awareness and social marketing strategy, leak detection,
demonstrate utility commitment also allows for up to a ten percent reduction in losses.
• Residential metering.
• Residential metering. Give public a greater awareness of water as valuable resource.
• Residential metering. User pay system should slow careless use.
• SCADA. Currently only have bi-monthly meter reads.
• Sprinkling enforcement and reduce peak fines and therefore capital and operating costs.
• Sprinkling restrictions and a thirty percent reduction.
• The system has only twenty-five connections so this portion of this system is
the most useful tool.
• There are no current water conservation objectives.
• Universal metering.
• Water meters and knowledge to users.
• Water meters, increasing block toll rate and public education.
• Water Smart program has a twelve-year proven effectiveness.
• Water supply upgrade improved quality.
32
33. 2004 BC Water Conservation Survey
Q26. What is 1 major challenge or barrier to implementing or maximizing
the effectiveness of operations and management tools?
• Cost 7 mentions
• Budget constraints.
• Budget to complete residential metering.
• Cost and public acceptance.
• Cost of implementation.
• Council and old habits, tax dollars and most do not want to pay.
• Decision maker and customer misunderstanding of the water meter as the tool
that benefits all lack of understanding of the relationships between metering
and customer education.
• Educating the user because they use the resource.
• Funding
• Getting people to realize the price of water. It is harder to convey to the older
generation.
• Human resources.
• Human Resources. One person to develop plans for all infrastructures.
• Inequity, different rules for municipalities and improvement district mismanaged
municipalities and get money for not operating well.
• It is voluntary.
• Lack of funds. The system is too small to be economical.
• Lack of personnel resources.
• Money and changing old ways of thought.
• Political and cost.
• Political and the public’s will to accept water metering.
• Public awareness.
• Public perception that water should be free.
• Public resistance.
• Remove scale rates from bylaw schedule.
• Resources
• Staff time and budget.
• The competing priorities of capital planning and long range plan.
• The cost of implementing and maintaining universal metering is major barrier.
• The low cost of and abundance of water.
• This is what was always done.
• Time and resources.
• Water supply for fire protection.
33
34. 2004 BC Water Conservation Survey
Q27. How could the following sectors help you use operations and
management tools more effectively?
Federal government:
• Grants 8 mentions
• Funding 3 mentions
• More money 2 mentions
• Agricultural metering program and farm education.
• Approve the green grant for meters that has been applied for.
• Bring cost down.
• Broader input on promised legislation changes.
• It depends on the size of the meter and funding.
• Education and money for upgrades.
• Funding support and national policy of water conservation.
• Global direction and Environment Canada’s global warning studies to confirm
long-term trends.
• HRDC money for training or part-time students.
• Infrastructure program setting clearer goal posts.
• Mandate metering in the building codes.
• Measurement Canada should not enter into area of consumer testing of water meters.
• Regulation and funding.
Provincial government:
• Grants 7 mentions
• Funding 2 mentions
• Adoption of mandatory programs legislation.
• Agricultural metering program and farm education.
• Bring cost down.
• Change the code.
• Establishing value of water promoting efficient use of water.
• Infrastructure program and setting clearer goal posts.
• Legislation, education and money.
• Mandate all new home use water efficient fixtures and have it simple so you
know what is a water saver.
• More money.
• Provide funds and education.
• Regulation and funding.
• Same rules for everyone and legislate water meters.
• Seminars and information tools such as a website.
• Stop downloading.
• Training.
34
35. 2004 BC Water Conservation Survey
Q27. continued
Regional government:
• All users pay.
• Combined planning for adjacent utilities.
• Consistent approach to public awareness.
• Education.
• Funding.
• Grants.
• Improve co-operation.
• Improve O&M of bulk water supply meters.
• Legislation and education of users.
• More cash and more commitment.
• Provide funds and education.
• Public awareness.
• Regional management strategies and regional education.
• Regional water supply.
• Standardized resources.
• They need to consult with water purveyors.
• Training and expertise.
• Understanding educating customers on true cost of service to supply.
Private Sector:
• Better-qualified technical sales representatives.
• Consulting for specific projects.
• Education and encouragement.
• Education and communication.
• Improved awareness.
• Listen.
• More aggressive approaches to partnerships.
• Promote low volume fixtures and recapping.
• Promote low water use products by selling them and offer workshops on low
water use products.
• Responsible water use and planning for water efficiency.
• Technical support.
35
36. 2004 BC Water Conservation Survey
Q27. continued
NGO / Volunteer Sector:
• Education 2 mentions
• Change a wasteful mindset.
• Involve them based on partnerships.
• Limited, although there is potential.
• Promote the value of water and promote value of environment.
• Provide reasonable and common sense solutions.
• Public forum and education.
• Water conservation gardens.
Professional Associations:
• Education 2 mentions
• Continued professional development of members to promote water
conservation.
• Creative system designs and current adoption of water saving and
management devices.
• Design and an advice liaison with Federal land Provincial government.
• Develop a common action plan.
• Ensure associations advise and decision makes regulatory of industry trends
and perspectives.
• Incorporate water conservation methods into planning and building, facilities
and subdivisions.
• Key in providing training.
• Newsletters and training.
• Provide ongoing training in specific areas.
• Selling ideas for water conservation.
• Technology review and promotion.
• Training.
36
37. 2004 BC Water Conservation Survey
Q28. Please describe any successes your utility has had with a particular
operations or management tool, such as might help other utilities realize
their water conservation objectives.
Specifics:
• A study on our agriculture meter program is available from MAFF and an
internal report is available from SEKID's website.
• Cost efficient leakage analysis and measure winter and night time flows.
• Education of growers for water use reduction.
• Enforced water restrictions.
• Enforcement of sprinkling regulations has reduced our peak demand by about
forty-five percent.
• Industrial water meters.
• Metering.
• Pilot meter replacement program.
• Power reduction planning and groundwater studies for recharge and protection.
• Recent water restrictions and monitoring.
• Reduced water demand by twenty percent through leak detection program.
• Summer lawn sprinkling restriction to twice a week.
• The educational programs aimed at the Vancouver elementary school and the
public. Namely the school play, A2Z of H2O and the Water Wise Gardening
Grow Natural program. The objective to the school play is to make future
generations aware and the Grow Natural Water Wise Gardening is aimed at
adults.
• Water audit, benchmarking, leak detection, public education and infrastructure
upgrades.
• Water conservation programs have achieved a twenty percent reduction to
date, significant capital deferral, social marketing strategy and partnerships
work.
• Water restrictions, newspaper advertisements and school education program.
• Water Smart bike patrol and in school education.
• We are just in the midst of implementing initiatives.
• We are too early in our process to determine successes.
• Without executive metering it is difficult to tell how effective specific measures.
However the stage three plus stage four measures, implemented by the GORO
were effective.
37
38. 2004 BC Water Conservation Survey
Q28. continued
Performance Targets and Measures / Indicators:
• Ability run our Okanagan Lake and inter convection.
• Demand reduction has resulted in a twenty-five percent off the peak energy
cost savings.
• It is difficult to measure and quantify attitude changes of the public.
• Metering.
• Not clearly defined.
• Reduce consumption.
• Reduce power bills and better groundwater management.
• Shooting for twenty-five to thirty percent reduction.
• They pay for what they use.
• We will be monitoring our water demands.
Water Savings:
• Unknown 2 mentions
• A twenty percent reduction.
• About fifteen percent in peak reduction since 1993.
• Average twenty-three percent reduction in peak-day use.
• Cut back on water use.
• Increasing block toll rates and water meters.
• Reduces pumping costs.
• Somewhere between twenty-two percent and thirty-two percent.
• Ten to twelve percent.
• Yes.
Cost Savings:
• Unknown 3 mentions
• A cost-benefit analysis shows a conservative 1:1:5 ratio.
• Capital program over twenty years has reduced from nineteen million to twenty-
seven million dollars.
• Efficient testing of pump systems replacement of old pumps.
• Estimate average $75,000 per year in power cost savings plus $300,000per
year in deferred capital projects over past twelve years.
• It is hard to measure because of upgrades on old system.
• Reduced maintenance and hydro costs and reduced treatment costs.
• Yes.
38
39. 2004 BC Water Conservation Survey
3.4 LEAD-BY-EXAMPLE TOOLS
Q29. Please indicate how your utility is leading by example:
Type Of Lead By Currently Being Don't Valid
Neither
Example Tool Using Considered Know Sample
Operator education /
74.5% 12.7% 9.1% 3.6% 55
training
Employee education 50.0% 25.9% 22.2% 1.9% 54
Water conservation
applied to operations and 46.3% 27.8% 24.1% 1.9% 54
maintenance
Early leak detection and
45.5% 29.1% 23.6% 1.8% 55
repair
Efficient outdoor water
34.0% 24.5% 41.5% 0.0% 53
use and landscaping
Education for elected 53
32.1% 28.3% 32.1% 7.5%
officials
Conservation library 22.9% 16.7% 54.2% 6.3% 48
Low-flow fixture or retrofit
22.6% 28.3% 45.3% 3.8% 53
program
Reduced water pressure
18.5% 14.8% 61.1% 5.6% 54
in buildings
Greywater recycling 1.9% 18.9% 75.5% 3.8% 53
‘OTHER’ WAYS UTILITY IS LEADING BY EXAMPLE:
• At present it is not.
• Extensive customer interaction and social marketing.
• Mandatory low flow fixture bylaw.
• Presentation and trade publication presentations.
• Research and testing innovative technologies.
• Retrofitting local parks to reuse water.
39
40. 2004 BC Water Conservation Survey
Q30. Which lead-by-example tool would you consider most effective in
helping achieve your water conservation objectives? Why?
• Education 2 mentions
• Efficient outdoor water use and landscaping. 2 mentions
• Any initiatives that supports less water usage.
• Applied water conservation education.
• Demonstrate examples of customers who are responding and take the
education and information to the customer right in their neighborhood.
• Early leak detection. Lower water consumption and easier on the water
system.
• Education for elected officials so that they have a better understanding of
challenges to water conservation.
• Education for elected officials.
• Education for elected officials. This will lead to implementation of water
conservation measures and their funding.
• Efficient outdoor water use and landscaping. The greatest increase in demand
occurs in summer months due to lawn sprinkling.
• Efficient outdoor water use in all parks, use only what is necessary and time
clocks.
• Employee education.
• Irrigating town green spaces during dawn and dusk hours. A lot of wasted
water used for sprinkling and watering.
• Low flow fixtures.
• Low flow toilets and education.
• Meter and current data.
• Operator education and training. If you do not have properly trained personnel
operating your system how can you justify any of the other examples? It starts
there and builds outward.
• Parks computerized irrigation. You can see the results and measure the
savings. An estimated thirty percent of water lies used in parks.
• Part of our system is metered.
• Public isolation.
• Pump station and underground irrigation systems of timers.
• Water meter.
• With such a small system, conservation it is not an issue.
40
41. 2004 BC Water Conservation Survey
Q31. What is 1 major challenge or barrier to implementing or maximizing
the effectiveness lead-by-example tools?
• Cost 3 mentions
• A lack of resources.
• A lack of water use data.
• Budget for larger capital retrofits.
• Changing bylaws and plumbing codes.
• Communication and lack of understanding.
• Cost and education of elected officials.
• Cost of hiring additional staff.
• Costs to reduce water pressure.
• Funding.
• Funding and political desire.
• Money.
• Most of the year the reservoir is overflowing and people can see this and do not
practice conservation.
• Old mindset, resistance to change and thoughtlessness.
• Performance monitoring and reporting.
• Plentiful supply with low treatment costs.
• Political will.
• Public education and council members that abuse water use.
• Public objectives.
• Show case of maintenance and minimal water use.
• The misconception and misunderstanding by politicians and decision makers.
More work needs to occur to develop and to begin at this level and to show
time cost of water.
• There is no strategic plan in place to direct conservation.
• Time and resources.
41
42. 2004 BC Water Conservation Survey
Q32. How could the following sectors help you use lead-by-example tools
more effectively?
Federal government:
• Grants. 6 mentions
• Money. 2 mentions
• Education.
• Financial subsidy and product guidelines.
• Funding.
• Have countrywide programs.
• Improved grants for conservation initiatives.
• Legislation and funding.
• NRC and IRC representation at more conferences or workshops.
• Tie all funding assistance to water efficient implementation.
Provincial government:
• Grants. 7 mentions
• Auto shut off and building taps with low flow devices.
• Education.
• Improved grants for conservation initiatives.
• Include in building codes water use fixtures.
• Legislation and funding.
• Money.
• Partnerships
• Regulations.
• As with the Federal Government, tie all funding assistance to water efficient
implementation.
Regional government:
• Money.
• Adapting and demonstrating regional affective practices.
• Education and legislation.
• Expertise.
• Grants.
• Harmonized bylaws and programs.
• Initiatives and reward those communities and individuals who do well.
• More cash.
• Offer grants.
• Set an example by charging bylaws.
• Some sort of participation.
42
43. 2004 BC Water Conservation Survey
Q32. continued
Private Sector:
• Be responsible and acknowledgment of value of water.
• Information and education.
• Lead by example.
• Listen.
• Motivations.
• Ongoing.
NGO / Volunteer Sector:
• Education.
• Lead by example.
• Participation in other sectors.
• Promote efficient water use and promote environment protection.
• School education.
Professional Associations:
• Design and install water saving devices.
• Educate and use proven methods elsewhere.
• Experience.
• Newsletters.
• Ongoing.
• Standards.
• Technical input.
43
44. 2004 BC Water Conservation Survey
Q33. Please describe any successes your utility has had with a particular
lead-by-example tool, such as might help other utilities realize their water
conservation objectives.
Specifics:
• A proactive leak survey program, Water Wise gardening, Rain Barrel program
and education.
• Bylaw enforcement water regulator.
• Early leak detection, training and reduced pressure.
• Education of selected officials, foster a culture to conserve within the
corporation and work with media and community stakeholders.
• Employee education.
• Operator education.
• Power audit.
• Reservoir cleaning.
• Sprinkling restrictions.
• Too early in the process to determine successes.
• Water restrictions during summer.
Performance Targets and Measures / Indicators:
• Education of grower and domestic irrigation users.
• Reduced operating costs.
• Three year pay back of infrastructure improvement from new equipment.
• Well-managed system.
Water Savings:
• A twenty percent reduction.
• Fifteen percent in water savings.
• Less water used in parks by information and education.
• The tanks are not drained.
Cost Savings:
• Labor, materials and equipment saved two-thirds the normal cost.
• Significant capital cost savings to customers.
• The data provided by leak surveys is valuable for proving court cases.
• Thirty percent in power savings.
44
45. 2004 BC Water Conservation Survey
3.5 RESIDENTIAL EDUCATION AND CONSULTATION TOOLS
Q34. Please indicate which education / consultation tools are in place or
being considered by your utility for residential users:
Education / Currently Being Don't Valid
Neither
Consultation Tools In Place Considered Know Sample
Media 61.1% 9.3% 29.6% 0.0% 54
Information with billing 58.5% 22.6% 17.0% 1.9% 53
Stand-alone publications 53.7% 11.1% 33.3% 1.9% 54
Website 44.4% 27.8% 27.8% 0.0% 54
Community events 31.5% 22.2% 46.3% 0.0% 54
School programs, events
31.5% 16.7% 48.1% 3.7% 54
and / or contests
Publications for school
29.1% 18.2% 49.1% 3.6% 55
children
Workshops & seminars 20.8% 17.0% 60.4% 1.9% 53
Public opinion survey 18.5% 16.7% 63.0% 1.9% 54
Citizen committee / task
17.0% 13.2% 64.2% 5.7% 53
force
Eco-education programs 15.4% 11.5% 67.3% 5.8% 52
Awards or recognition 13.2% 11.3% 69.8% 5.7% 53
Outdoor advertising 11.5% 21.2% 65.4% 1.9% 52
Student representatives
active in community 10.9% 16.4% 65.5% 7.3% 55
outreach
Focus groups 7.5% 17.0% 71.7% 3.8% 53
Referendum 3.9% 21.6% 70.6% 3.9% 51
“OTHER” EDUCATION / CONSULTATION TOOLS:
• Co-ordination through water conservation Co-ordinators.
• Internet discussion.
• Public open house.
45
46. 2004 BC Water Conservation Survey
Q35. Which education / consultation tool would you consider most
effective in helping achieve your water conservation objectives for
residential users? Why?
• Information with billing. 4 mentions
• Education on efficient use of limits to supplies. Higher costs and lower quality.
• I do not know. There is no way to monitor the effectiveness of the education
program.
• Information with billing and stand-alone publications gets the message to the
user. School education is a great idea to instill conservation at young age.
• Lawn sprinkling regulation.
• Media.
• Media and broadcast distribution of message.
• Media and public education over the radio and newspaper has shown definite
per capita decrease in consumption.
• Media campaign, community outreach, information on website on water usage
and cost and methods to conserve.
• Media coverage because it is free publicity when stories are publicized on Rain
Barrels, Water Wise Gardening, mulching, composting, etceteras.
• Metering plus education.
• Public opinion survey.
• Public programs.
• Referendum and metering proven to lower usage.
• School programs are an effective way of informing reading parents.
• School watershed visits.
• Stand alone publication and notices at post office.
• Stand alone publications and school programs.
• Students because they teach the older people to shut off taps.
• Water meters.
• Water Smart Bike team in school education.
• Website and billing.
46
47. 2004 BC Water Conservation Survey
Q36. What is 1 major challenge / barrier to implementing or maximizing
the effectiveness education / consultation for residential users?
• Buy, touch sell and cost.
• Changing the mind set regarding water conservation issues.
• Changing the old style thought process. There is plenty of water with the use
as much as I want to attitude.
• Cost.
• Cost and pressures.
• Decision makers, communities and understanding of refits of metering, proper
rates and education as a package.
• Dollars.
• Funding, staffing and political will.
• It is difficult to have people recognize the value of water.
• Knowing how effective it is.
• No adopted communication plan.
• Past practice.
• Public understanding.
• Residential user’s resistance to change despite being informed of water
conservation.
• Resources.
• Staff time to co-ordinate, implement and manage.
• The lack of financial impact until metering is in place.
• The lack of long-term vision in water resources and its impacts on communities.
• The lack of resources.
• Time and resources.
• Time to implement.
• Water hogs.
• We have a lot of seniors and people that do not seem to care.
47
48. 2004 BC Water Conservation Survey
Q37. How could the following sectors help you use education /
consultation tools for residential users more effectively?
Federal government:
• Grants. 3 mentions
• Money. 2 mentions
• Education.
• Information that exists in order to promote.
• Long-term policy.
• More exposure and policy on conservation tied to funding.
• Possibly legislation restrictions.
• Provide funding for infrastructure that must promote water as a motherhood
issue, promote how precious water is and show how to use it efficiently.
• Provide money.
• Provide more advertisement funding from a Federal level.
• Standard programs and material.
Provincial government:
• Grants. 3 mentions
• Money. 2 mentions
• As above; tie funding to grants and assistance.
• Education
• Have solid waste, such as garbage and recycling and water conservation as
part of the school curriculum. Elementary aged kids are the future residential
users.
• Possibly legislation restrictions.
• Provide money.
• As above, information that exists in order to promote.
• School curriculum and programs.
Regional government:
• Come together on the issue with a united view.
• Common advertising campaign to promote water use efficiency.
• Education and more cash.
• Education, legislating local by-laws and metering.
• Expertise.
• Expose regional water challenges.
• Mandate community outreach.
• Provide money.
• As above, information that exists in order to promote.
48
49. 2004 BC Water Conservation Survey
Q37. continued
Private Sector:
• Affordability of changing equipment and practices the participation.
• Green development.
• Lead by example.
• Not to carry or support products that do meet water conservation goals.
• Promote low volume fixtures and Xeriscaping.
• Promote products and services and partner.
• Provide money.
NGO / Volunteer Sector:
• Community associations and ask them to be involved.
• Lead by example.
• Organization
• Promote conservation efforts.
Professional Associations:
• BMPs.
• Newsletters.
• Promote and make available efficient products.
• Show cost savings realized elsewhere.
• Work with the above as a voice of the industry.
49
50. 2004 BC Water Conservation Survey
Q38. Please describe any successes your utility has had with a particular
education tool for residential users, such as might help other utilities
realize their water conservation objectives.
Specifics:
• Bike patrol to inform and educate public in wise use of water.
• Door hangers advising of restrictions and explaining why.
• Lawn sprinkling regulation.
• Media and information.
• Peak demands reduction pilot programs, school programs, community tent
events education and media advertising.
• Provide reasons for restrictions to consumers.
• School programs on conservation, radio and newspaper advertisements on
conservation tips.
• The school play A2Z of H2O aimed at school children, Rain Barrel program,
Water Wise Gardening Grow Natural program.
• We feel mail outs with billing is effective.
Performance Targets and Measures / Indicators:
• Fifty community tent events in 2004 and consumption education of an additional
sixteen percent by area serviced.
• Cost savings with reduced usage.
• To cut water consumption in high summer use.
Water Savings:
• Twenty percent today and then achieved additional fifteen is being sought.
Cost Savings:
• Huge capital cost savings and deferral of infrastructure.
• When consumption is cut the city pays less in electrical, cost and pump
statistics and groundwater.
50
51. 2004 BC Water Conservation Survey
Q39. Please describe any successes your utility has had with a particular
consultation tool for residential, such as might help other utilities realize
their water conservation objectives.
Specifics:
• Consultation is an educational tool.
• Water audit and committee of interested parties.
51
52. 2004 BC Water Conservation Survey
3.6 AGRICULTURAL EDUCATION AND CONSULTATION TOOLS
Q40. Please indicate which education / consultation tools are in place or
being considered by your utility for ICI and agricultural users:
Education / Currently Being Valid
Neither
Consultation Tool Using Considered Sample
Information with billing 38.5% 20.5% 41.0% 39
Website 35.9% 17.9% 46.2% 39
Voluntary watering
32.4% 8.1% 59.5% 37
restrictions
Stand-alone publications 30.6% 8.3% 61.1% 36
Media 29.7% 13.5% 56.8% 37
Community events 25.0% 13.9% 61.1% 36
Citizen committee / task
12.5% 12.5% 75.0% 32
force
Workshops & seminars 11.8% 11.8% 76.5% 34
Eco-education programs 11.4% 11.4% 77.1% 35
Outdoor advertising 9.1% 18.2% 72.7% 33
Focus groups 9.1% 21.2% 69.7% 33
Public opinion survey 6.3% 6.3% 87.5% 32
Voluntary low-flow fixture
5.9% 29.4% 64.7% 34
program
Referendum 3.0% 18.2% 78.8% 33
‘OTHER’ EDUCATION / CONSULTATION TOOLS:
• Audits one and two.
• Encouraging water audits.
• Metering.
52
53. 2004 BC Water Conservation Survey
Q41. Then indicate since what year or, if being considered, what year it is
being considered for:
Media Workshops & seminars
• 2004
• 2004 2 mentions
Focus groups
Information with billing
• 2004
• 2004 2 mentions
Citizen committee / task force
Stand-alone publications
• 2004
• 2004 2 mentions
• 1994
Voluntary watering restrictions
Community events • 2004
• 2004 2 mentions
Voluntary low-flow fixture program
Outdoor advertising • 2004
• 2004
Other
Website • 2004 (Encouraging water audits)
• 2004 2 mentions
• 2003
53