Download as PDF, PPTX


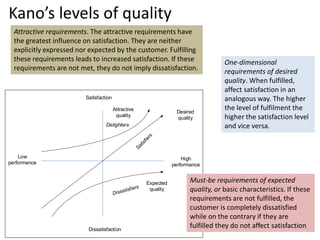
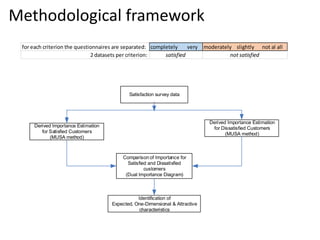
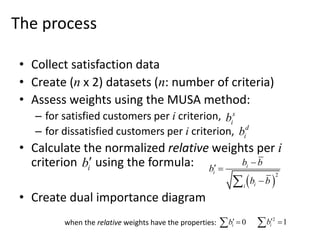
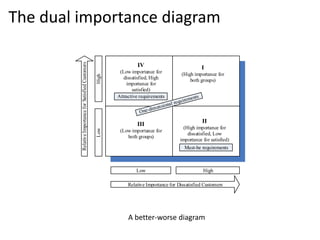
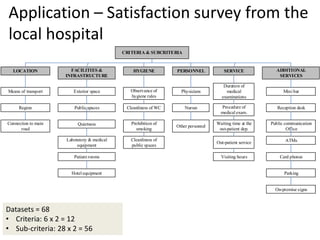
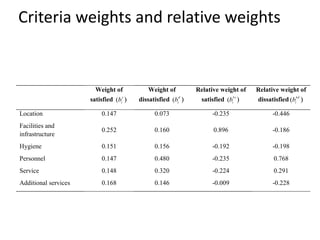
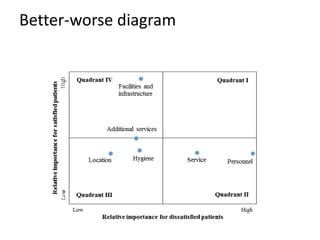
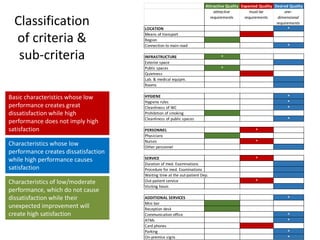


The document outlines a framework for classifying customer satisfaction criteria using the Multi-Criteria Decision Analysis (MCDA) and Kano's model, focusing on three levels of quality: must-be, one-dimensional, and attractive requirements. It details a methodological approach for analyzing satisfaction surveys, specifically from a local hospital, to assess the importance of various criteria and develop a dual importance diagram. The findings can inform improvements in customer satisfaction by identifying key areas for enhancement based on customer feedback.


