Download to read offline


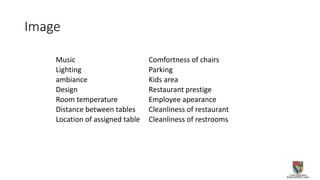
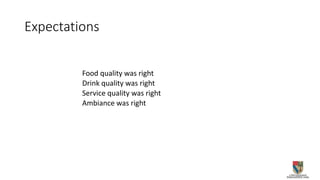
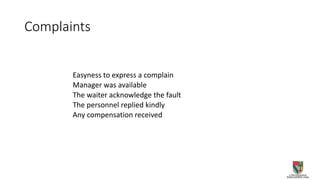


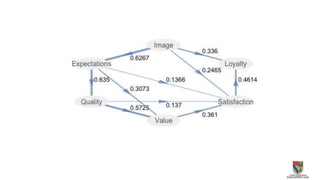

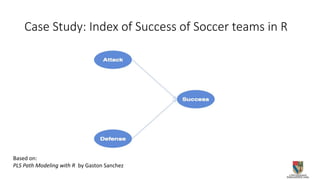


This document presents research on measuring customer satisfaction in the restaurant industry in Mexico using a Partial Least Squares Path Modeling (PLS-PM) approach. It provides context on the importance of the restaurant industry in Mexico. The researcher conducted a survey to measure various factors that influence customer satisfaction, such as perceived quality, expectations, value, complaints and loyalty. Results of the PLS-PM analysis are also presented. The document concludes by noting some other marketing applications of PLS-PM.


