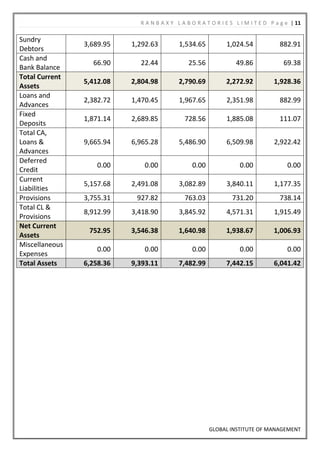
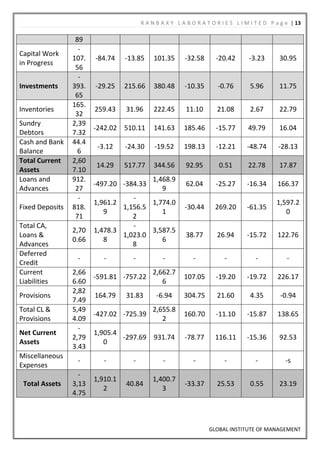
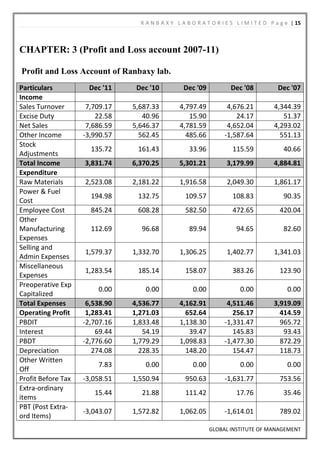
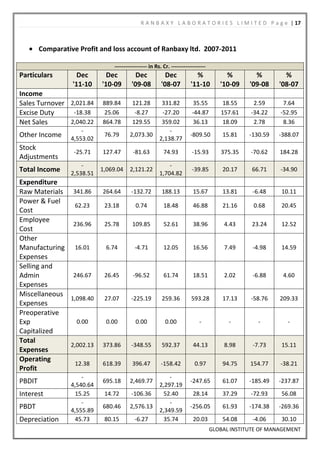
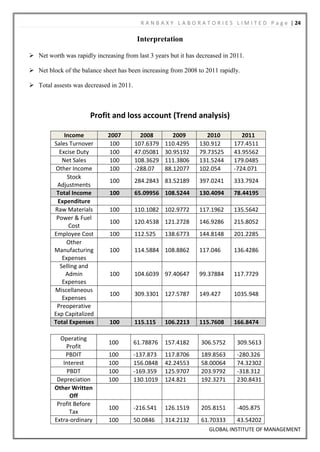
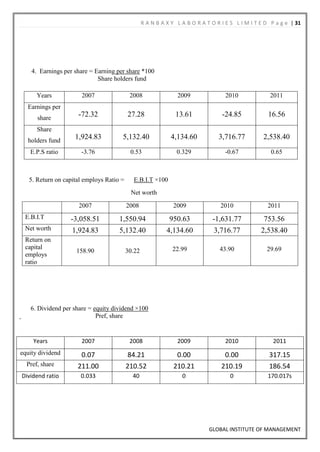
This document provides an overview of Ranbaxy Laboratories Limited, an Indian pharmaceutical company. It discusses the company's history, products, and financial reports from 2007-2012. Ranbaxy was founded in 1961 and went public in 1973. It manufactures generic drugs, branded generics, active pharmaceutical ingredients, and intermediates. The top selling products include Valacyclovir, Simvastatin, and various statins, antibiotics, and vitamins. Financial reports from the last 5 years are analyzed regarding the company's balance sheet, profit and loss, cash flows, ratios and other accounting details.
while persuing my BBA(H), i have done project on financial research of Ranbaxy Laboratories Limited, the main subject of my project is to show the effects of leverage in deceision making.
Flevy.com - World's First Research Report-cum-Financial ModelDavid Tracy
This is a partial preview of the document found here:
https://flevy.com/browse/business-document/Research-Report-cum-Financial-Model-121
Description:
Multi Commodity Exchange of India Ltd. operates MCX, India's leading commodity futures exchange, and has recently going public.
We are a firm of independent analysts based in Mumbai, India. Our research is truly independent, since we are not affiliated with any i-bank.
We introduce herewith a new presentation format - 'Fusion of a Research Report and a Financial Model' - 'possibly' for the first time in the global research community. Please excuse us, if you've seen a similar format earlier! Please refer the Disclaimer sheet.
This research report-cum-financial model contains a wealth of information about commodity futures exchanges as an industry, the regulatory environment in India, trading volumes, business model, strengths, financials and earnings estimates of MCX, and global peer financial highlights and valuations. This document is an unlocked spreadsheet and is print-ready.
Bonus: our proprietary 'IPO Analysis Checklist' is included.
We believe this report-cum-customizable model will remain relevant all the time, and across geographies. Just plug in the current stock price, make changes in underlying assumptions and arrive at your own earnings estimates and valuations, incl. DCF, and your own target price!
This report cum model can be used as a template by US based investors / analysts tracking commodity futures exchanges, such as ICE and CBOE.
This document provides an editorial and overview of India's top 500 companies for the 2008-2009 fiscal year based on an analysis conducted by The Financial Express. It highlights that:
1) Indian companies largely met the challenges of the global recession and headwinds with resoluteness, growing their revenues at a relatively high rate of 19.35% despite declines in profitability.
2) The larger companies were better able to preserve bottom line growth through scale advantages despite the difficult business environment.
3) Reliance Industries ranked first in the analysis due to its continued focus on strong execution.
4) The analysis methodology gives greater weight to revenue growth and reduced weight to market capitalization, which proved beneficial
- The document provides a financial analysis of Reliance Industries Ltd for the year ending March 2012, including income statements, balance sheets, ratio analysis, and growth trends.
- Key highlights are a 5.26% decline in EBDITA to Rs. 38,388 crore for FY12, and a 1.21% decline in reported net profit to Rs. 20,040 crore.
- ROE declined from 14% in FY11 to 12% in FY12 due to lower profitability, though the company maintained strong asset turnover and financial leverage.
Bharat Forge Limited : A Project of Corporate Finance by Asokendu SamantaDr. Asokendu Samanta
Abstract – Bharat Forge Limited (BFL), one of the world's largest forging companies is based in Pune, India and has nine manufacturing plants in India, Germany, Sweden, United States, Scotland, United Kingdom and mainland China. The flagship company of the USD 2.4 billion Kalyani Group was founded by Indian billionaire Baba Kalyani in 1961 and is listed both in BSE and NSE. BFL manufactures various forged and machined components for the automotive and non-automotive sector (Fig. 1). In this present report, analyses of BFL, mainly from corporate finance point of view are made. Various aspects (cash flow analysis, ratio analysis, capital budgeting, valuation of stock, working capital management, analysis with its peers) are done chapter wise collecting data mainly from company’s website and annual report. Sample calculations (ratio, NPV, IRR, Intrinsic value of stock) are shown in details and remarks are made wherever required. At the end, conclusions are drawn in chapter seven analyzing all aspects.
This document summarizes the financial review of VF Corporation for 2005. It includes management's discussion and analysis of results and financial condition, consolidated financial statements including balance sheets, income statements, cash flows, and notes. Key highlights include revenues increasing to $6.5 billion in 2005, gross margins of 41.8%, long-term financial targets of 6-8% annual revenue growth and operating income of 14% of revenues, and strategies to grow organically and through acquisitions while expanding brands and customers into new international geographies.
This document provides an overview of Suzano Pulp and Paper, including:
1) Suzano is the second largest eucalyptus pulp producer and one of the top 10 market pulp producers, as well as a leader in the regional paper market.
2) It has a diversified portfolio of printing/writing papers, market pulp, and paperboard, with 57% of revenue from exports.
3) Suzano is undertaking a new growth cycle to increase its pulp and paper capacity by 130% to 5.9 million tons per year through projects in Piauí and Maranhão.
4) The presentation discusses Suzano's business units, operations, management model,
This document provides a financial analysis of Cipla Ltd, an Indian pharmaceutical company, including:
- A summary of the company's latest yearly and quarterly results showing declines in EBDITA but growth in adjusted PAT.
- A valuation matrix comparing the company's stock to industry ratios like P/E and P/Book Value.
- An analysis of the company's return on equity over the past 5 years, showing an increase in reported PAT/PBT to 2.31 in March 2011.
- Sections analyzing the company's income statement, balance sheet, cashflow statement, quarterly results, and various financial ratios over time.
Detailed Analysis of Tata Motors Ltd. by calculating its cost of capital usin...Tushar Sharma
The purpose of the study is to do a detailed analysis of a manufacturing company, Tata Motors Ltd. In this report, we have calculated the beta, cost of equity and the cost of capital for Tata Motors Ltd., one of the largest two-wheeler manufacturing organizations in India. Along with this, we have also studied the capital structure and calculated the degree of financial and operating leverages of Tata Motors Ltd. for the years 2014-15. Data for calculating the beta and risk free rate has been obtained from the Ace Equity. To find out the capital structure and the degree of financial and operating leverage, data has been taken from the annual report of the company
Tata Motors and Maruti Suzuki are two major automobile companies in India. Tata Motors has a higher debt to equity ratio, indicating it is more reliant on debt financing. Maruti Suzuki has significantly higher reserves and surplus compared to Tata Motors, and saw a 23% increase in reserves year-over-year compared to 14% for Tata. While both companies have experienced declines in share prices recently, Tata Motors may be a better investment due to underperformance from declining sales and profits in recent years from investments and acquisitions.
Tata Motors is India's largest automobile company, established in 1945. It has revenues of Rs. 35651.48 crores in 2007-08 and is a leader in commercial vehicles and among the top 3 in passenger vehicles. It is the 4th largest truck manufacturer and 2nd largest bus manufacturer globally. Over the years, Tata Motors has expanded its product portfolio, acquired foreign brands like Jaguar and Land Rover, and increased its global presence through strategic partnerships and acquisitions. It currently employs over 23,000 people worldwide.
This document analyzes and compares the capital structures of Maruti Suzuki India Ltd and Infosys. Maruti Suzuki is an automobile manufacturer established in 1981 in India, while Infosys is an IT company founded in 1981 that has expanded globally. The analysis finds that Infosys has a stronger financial position, with zero debt and high liquidity, while Maruti has taken on some debt to finance expansion. The document examines various ratios and trends over time to evaluate the solvency and leverage of the two companies.
The document discusses various aspects of capital structure including:
- Defining capital structure and the components that make up a company's financial structure
- Approaches to determine the appropriate capital structure such as EBIT-EPS, valuation, and cash flow approaches
- The concept of optimal capital structure which maximizes share price value and minimizes cost of capital
- Different forms of capital structure such as equity only, combinations of equity and debt, etc.
- The concepts of leverage including operating, financial, and combined leverage and how they impact risk and returns
Tata Motors is the largest automobile and commercial vehicle manufacturer in India. It is part of the $70 billion Tata group and has a market worth of $22 billion. Tata Motors acquired Jaguar Land Rover in 2008. While it manufactures many passenger and commercial vehicles in India, it has faced financial challenges maintaining liquidity and profitability due to expansion plans and costs associated with acquiring Jaguar Land Rover. Compared to its main competitor Maruti Suzuki, Tata Motors has higher debt levels, lower current ratios, and longer inventory holding periods.
Capital structure Analysis of Indian Oil Corporation Limited (IOCL)Kangkan Deka
The document discusses the capital structure analysis of Indian Oil Corporation Limited (IOCL). It provides background information on IOCL, describing it as India's largest company by sales. The document outlines IOCL's vision, mission and values. It then discusses the methodology used for the capital structure analysis, which involves analyzing data from IOCL's annual reports. Various components of IOCL's capital structure are examined, including share capital, paid-up capital, long-term debt and leverage ratios.
The capital structure of a company refers to the composition of its long-term financing, including loans, reserves, shares, and bonds. A company's capital structure is influenced by both internal factors like financial leverage, risk tolerance, and growth plans as well as external factors like industry norms, availability of funds, and tax policies. An optimal capital structure maximizes the value of the company by balancing the use of debt financing which increases earnings per share but also increases financial risk. The point of indifference is the earnings level at which earnings per share remains the same regardless of the debt-to-equity mix. Leverage refers to using fixed-cost funds to increase returns to owners, either through financial leverage of long-term debt or operating
This document analyzes Coca-Cola's financial statements and business strategies. It begins with an analysis of Coca-Cola's governance, including details about the CEO, board of directors, and executive compensation. It then discusses Porter's Five Forces analysis of the soda industry, finding rivalry to be high but threats of new entrants and substitutes to be medium. The document also analyzes Coca-Cola's income statements, balance sheets, profitability, and forecasts growth.
The document discusses capital structure, which is the mix of debt and equity used to finance a firm. The value of a firm is equal to the value of its debt plus the value of its equity. The optimal capital structure maximizes firm value by balancing the debt-equity ratio. Factors that influence the capital structure decision include business risk, taxes, financial flexibility, growth opportunities, and market conditions. Leverage increases risk for shareholders but also increases potential returns, as interest payments are tax deductible. Higher debt leads to greater financial risk.
Honda Motor Company is a Japanese manufacturer of motorcycles, automobiles, and power equipment. It was founded in 1948 and began producing motorcycles in 1949. Honda has manufacturing facilities around the world and is a major exporter, especially to the United States. Honda's Indian subsidiary, Honda Cars India Ltd, has three manufacturing plants in India that produce models like the Honda City, Amaze, and CR-V. The manufacturing process involves pressing body panels, welding bodies, painting, assembling components, and quality inspections.
while persuing my BBA(H), i have done project on financial research of Ranbaxy Laboratories Limited, the main subject of my project is to show the effects of leverage in deceision making.
Honda is a large Japanese manufacturer of automobiles and motorcycles. It employs over 179,000 people and has subsidiaries like Acura. Honda implements total quality management to continuously improve products and processes. This involves management, workforce, suppliers, and customers. Honda uses a quality cycle and quality enhancement system to implement TQM using methods like the PDCA cycle to bridge gaps between targets and current performance. Honda also provides quality management education to improve worker skills. Honda recalled over 962,000 vehicles globally to repair power window problems.
The document discusses different approaches to capital structure and the Modigliani-Miller model. It summarizes key assumptions of the MM model, including that capital markets are perfect, leverage at the personal and corporate level are substitutes, and there are no taxes or transaction costs. The MM model shows that firm value and cost of capital are independent of capital structure.
The internet is being developed rapidly since last two decades, and with relevant digital economy that is driven by information technology also being developed worldwide. After a long term development of internet, which rapidly increased web users and highly speed internet connection, and some new technology also have been developed and used for web developing, those lead to firms can promote and enhance images of product and services through web site. Therefore, detailed product information and improved service attracts more and more people changed their consumer behaviour from the traditional mode to more rely on the internet shopping. On the other hand, more companies have realized that the consumer behaviour transformation is unavoidable trend, and thus change their marketing strategy. As the recent researches have indicated that, the internet shopping particularly in business to consumer (B2C) has risen and online shopping become more popular to many people. According to the report, The Emerging Digital Economy II, published by the US Department of Commerce, in some companies, the weight of e-commerce in total sales is quite high. For instance, the Dell computer company have reached 18 million dollars sales through the internet during the first quarter of 1999. As a result, about 30% of its 5.5 billion dollars total sales were achieved through the internet (Moon, 2004). Therefore, to understand internet shopping and its impact on consumer behaviour could help companies making use of it as a form of doing e-business.
There are many reasons for such a rapid developing of internet shopping, which mainly due to the benefits that internet provides. First of all, the internet offers different kind of convenience to consumers. Obviously, consumers do not need go out looking for product information as the internet can help them to search from online sites, and it also helps evaluate between each sites to get the cheapest price for purchase. Furthermore, the internet can enhance consumer use product more efficiently and effectively than other channels to satisfy their needs. Through the different search engines, consumers save time to access to the consumption related information, and which information with mixture of images, sound, and very detailed text description to help consumer learning and choosing the most suitable product (Moon, 2004). However, internet shopping has potential risks for the customers, such as payment safety, and after service. Due to the internet technology developed, internet payment recently becomes prevalent way for purchasing goods from the internet. Internet payment increase consumptive efficiency, at the same time, as its virtual property reduced internet security. After service is another way to stop customer shopping online. It is not like traditional retail, customer has risk that some after service should face to face serve, and especially in some complicated goods.
This document discusses capital structure and various capital structure theories. It begins by defining capital structure as the mix of owned and borrowed capital used to finance a company's assets. The key considerations in planning capital structure are return, cost, risk, control, flexibility, and capacity. It then covers four capital structure theories - net income approach, net operating income approach, Modigliani-Miller model, and traditional approach. The net income approach proposes that firm value increases with more debt due to lower costs. The net operating income approach argues firm value is independent of capital structure. The Modigliani-Miller model supports the net operating income view. The traditional approach finds an optimal capital structure that minimizes costs.
The document discusses capital structure and leverage. It defines capital structure and discusses questions to consider when making financing decisions, such as determining the optimal financing mix. Appropriate capital structures should have features like profitability, solvency, flexibility, capacity, and control. Capital structure is determined by factors like taxes, flexibility, industry norms, and investor requirements. Firms can use different forms of capital structure involving various proportions of equity, debt, and preference shares. Financial leverage refers to using debt financing to magnify returns, and it can be measured using ratios like debt ratio and interest coverage. Capital structure theories address whether firm value depends on capital structure.
This document provides an overview of the organizational structure and design of Sintex Industries Limited, an Indian company that operates in textiles and plastics. It describes the top management including the Chairman and Vice Chairman and discusses the hierarchy, organizational chart, and basis for departmentalization by product, customer, and geography given the company's large product range and multiple plant locations. The organizational design aims to effectively manage the diverse operations of Sintex Industries.
This document provides information about the Chittoor Co-operative Sugars Ltd located in Chittoor, Andhra Pradesh. It was established in 1955 to help sugarcane farmers in the region process their harvest and get fair prices. The company owns 85.96 acres and has gradually expanded its cane crushing capacity over the years. It is currently able to crush 1800-2000 tons of cane per day. The original capital came from shareholder contributions and loans. Financial statements and ratio analysis will be used to analyze the company's performance and financial position from 2003-2007.
Ratio analysis @ gadag textile mill project report mba financeBabasab Patil
The document provides an overview of a study on the analysis and interpretation of financial statements for Gadag Co-Operative Textile Mill Ltd Hulkoti. It includes 16 tables and charts that will be used in the analysis. It also outlines the 4 chapters that will comprise the study, including an introduction to the company, techniques for analysis and interpretation, findings and conclusions.
Lassib 2012 industry advisory report on operational excellence previewLASSIBSociety
This report captures the synopsis of the discussion and analysis held by the panel on Operational Excellence at the LASSIB CXO Round Table Conference held in Mumbai on 14th July 2012. In this report we focus on the central views discussed towards state of Operational excellence and continuous improvement initiatives that organizations are working towards, or need to think about in order to excel.
LASSIB 2012 Industry Advisory Report on Operational Excellence - PreviewLASSIBSociety
LASSIB 2012 Industry Advisory Report on ‘Operational Excellence’ captures the synopsis of the discussion and analysis held by the panel on Operational Excellence at the LASSIB CXO Round Table Conference held in Mumbai on 14th July 2012.
The document is a report on leverage analysis of Ranbaxy Laboratories Limited conducted by Rahul Rai. It includes an introduction to the company, its operations worldwide, and products. It also provides theoretical background on relevant financial concepts like leverage, capital structure, CVP analysis and EBIT/EPS analysis. The report then analyzes Ranbaxy's financial performance over 10 years and provides recommendations. It discusses the advantages and limitations of leverage analysis and concludes with references.
This document provides a financial analysis of Hindustan Unilever Limited (HUL) and Godrej Consumer Products Limited (GCPL) for short term investment objectives. It includes comparative analysis of key financial ratios like P/E ratio, P/BV ratio, EPS, beta value and share price for both companies over the last 5 financial years. The analysis is intended to help evaluate the two companies for potential short term investment of less than 1 year.
The document discusses financial ratio analysis of BDK Process Control Private Ltd. It provides background on the company and outlines the objectives of analyzing the company's financial ratios over three years. The analysis will evaluate the company's liquidity, profitability, efficiency and overall financial performance and position. It aims to identify strengths and weaknesses so management can take corrective actions to improve performance if needed.
Summer Training Report on Financial Performance Analysis for MBAMegha Bansal
This document provides an overview of a summer training project report on the financial performance analysis of Surya Roshni Limited conducted over 45 days. It includes an acknowledgement, declaration, abstract, table of contents, and lists of tables and charts. The report analyzes the company's financial statements from 2013-2016 using various techniques like common size statements, ratio analysis, comparative statements, and cash flow analysis to evaluate the company's financial performance and position over time.
REPORT ON SUMMER TRAINING A FINANCIAL STATEMENT ANALYSIS AND INTERPRETATION...priya bansal
REPORT ON SUMMER TRAINING
A FINANCIAL STATEMENT ANALYSIS AND INTERPRETATION OF B.K. TRADING CO.
I HELP'S U HOW TO PREPARE INTERNSHIP TRAINING REPORT ON A FINANCIAL STATEMENT ANALYSIS AND INTERPRETATION
This document analyzes the financial performance of Radico Khaitan Ltd over several years using ratio analysis. It begins with an introduction and outlines the company profile. The analysis then calculates and compares various liquidity, profitability, and turnover ratios from 2016-2020. Key findings include the company's satisfactory but improving liquidity and profitability positions. The document concludes with recommendations to maintain profits and control costs, while acknowledging limitations of only considering monetary financial data.
Financial ratio annalysis dharwad milk project report mbaBabasab Patil
This document provides an index and chapter outline for a study on the financial ratio analysis of Dharwad Milk Producers Union Limited (DMUL). The index lists 6 chapters that will analyze DMUL's industry profile, organization profile, research methodology, data analysis, findings, and conclusions. Chapter 1 provides an executive summary and outlines the objectives to study DMUL's financial performance over 5 years using ratio analysis and determine how it can improve profits by utilizing financial resources.
The document provides a detailed analysis of The Boeing Company, including its annual and quarterly financial performance, valuation, growth, ratios, and projections. Key highlights from the latest annual and quarterly results show an increase in sales, EBITDA, adjusted profit, and EPS. The company has a lower P/E than its industry average but a higher price to sales ratio. Its ROE increased in 2011 driven by growth in sales and profits.
This document is a project report submitted by Paul Jose in partial fulfillment of the requirements for a Master's degree in Business Administration from Sri Venkateswara College of Computer Applications and Management. The project analyzes the capital structure of Federal Bank Aluva over a 5 year period using ratio analysis and financial statement trends. The report includes an introduction, industry profile of banking in India, company profile of Federal Bank, literature review, findings and suggestions.
ANALYSIS OF FINANCIAL PERFORMANCE OF THOMAS COOK (INDIA) LTD. USING RATIO ANA...Anirban Chakraborty
ANALYSIS OF FINANCIAL PERFORMANCE OF THOMAS COOK (INDIA) LTD. USING RATIO ANALYSIS
This study gives in detail the analysis of various financial ratios based upon the past as well as
the present performance of Thomas Cook (India) Ltd. expressed in financial data. Based upon
the results from these financial ratios conclusions are driven out that whether the company has
been earning profits or not and also that how much it has used these results in its growth. So, the
company can also manage each of its current assets namely cash management, accounts
receivable management and also its liabilities like creditors, loans, bills payables etc. so that it
can maintain an identical financial ratio for each of its business aspects like solvency ratios,
turnover ratios, profitability ratios etc.
This document discusses various techniques of financial analysis used to analyze financial statements, including ratio analysis. It provides background on ratio analysis and defines key financial ratios such as current ratio, quick ratio, debt equity ratio, proprietary ratio, net profit ratio, and capital turnover ratio. Ratio analysis of Punjab National Bank from 2011-2015 is then presented, calculating and interpreting various ratios to analyze the bank's financial performance and position over those years. The ratios indicate the bank has maintained strong liquidity and an increasing equity position over time.
Dr. Reddy's Laboratories Ltd is an Indian pharmaceutical company with a market capitalization of Rs. 25561.24 crore. Some key highlights from the document:
- For the year ending March 2011, EBDITA grew 5.13% to Rs. 1335 crore and adjusted PAT grew 16.12% to Rs. 891.90 crore.
- The company trades at a reported P/E of 28.84 with a price to sales ratio of 4.97 and price to book value of 4.28.
- Major shareholders include promoters (26%), FIIs (25%), MFs (7%) and general public (8%).
Financial ratios at b.d.k. ltd. hubli project reportBabasab Patil
This document provides an overview of BDK Process Control Pvt. Ltd., including its objectives, products, and strengths. It discusses the company's formation in 1961 and expansion over time. The objectives of the company are outlined, including striving for excellence in quality and developing competence. The document also lists the company's products such as different types of valves and pumps. It notes the company's annual production capacity and highlights innovation as one of its strengths.
In a tight labour market, job-seekers gain bargaining power and leverage it into greater job quality—at least, that’s the conventional wisdom.
Michael, LMIC Economist, presented findings that reveal a weakened relationship between labour market tightness and job quality indicators following the pandemic. Labour market tightness coincided with growth in real wages for only a portion of workers: those in low-wage jobs requiring little education. Several factors—including labour market composition, worker and employer behaviour, and labour market practices—have contributed to the absence of worker benefits. These will be investigated further in future work.
How Does CRISIL Evaluate Lenders in India for Credit RatingsShaheen Kumar
CRISIL evaluates lenders in India by analyzing financial performance, loan portfolio quality, risk management practices, capital adequacy, market position, and adherence to regulatory requirements. This comprehensive assessment ensures a thorough evaluation of creditworthiness and financial strength. Each criterion is meticulously examined to provide credible and reliable ratings.
Seminar: Gender Board Diversity through Ownership NetworksGRAPE
Seminar on gender diversity spillovers through ownership networks at FAME|GRAPE. Presenting novel research. Studies in economics and management using econometrics methods.
1. Elemental Economics - Introduction to mining.pdfNeal Brewster
After this first you should: Understand the nature of mining; have an awareness of the industry’s boundaries, corporate structure and size; appreciation the complex motivations and objectives of the industries’ various participants; know how mineral reserves are defined and estimated, and how they evolve over time.
OJP data from firms like Vicinity Jobs have emerged as a complement to traditional sources of labour demand data, such as the Job Vacancy and Wages Survey (JVWS). Ibrahim Abuallail, PhD Candidate, University of Ottawa, presented research relating to bias in OJPs and a proposed approach to effectively adjust OJP data to complement existing official data (such as from the JVWS) and improve the measurement of labour demand.
2. Elemental Economics - Mineral demand.pdfNeal Brewster
After this second you should be able to: Explain the main determinants of demand for any mineral product, and their relative importance; recognise and explain how demand for any product is likely to change with economic activity; recognise and explain the roles of technology and relative prices in influencing demand; be able to explain the differences between the rates of growth of demand for different products.
Solution Manual For Financial Accounting, 8th Canadian Edition 2024, by Libby...Donc Test
Solution Manual For Financial Accounting, 8th Canadian Edition 2024, by Libby, Hodge, Verified Chapters 1 - 13, Complete Newest Version Solution Manual For Financial Accounting, 8th Canadian Edition by Libby, Hodge, Verified Chapters 1 - 13, Complete Newest Version Solution Manual For Financial Accounting 8th Canadian Edition Pdf Chapters Download Stuvia Solution Manual For Financial Accounting 8th Canadian Edition Ebook Download Stuvia Solution Manual For Financial Accounting 8th Canadian Edition Pdf Solution Manual For Financial Accounting 8th Canadian Edition Pdf Download Stuvia Financial Accounting 8th Canadian Edition Pdf Chapters Download Stuvia Financial Accounting 8th Canadian Edition Ebook Download Stuvia Financial Accounting 8th Canadian Edition Pdf Financial Accounting 8th Canadian Edition Pdf Download Stuvia
Vicinity Jobs’ data includes more than three million 2023 OJPs and thousands of skills. Most skills appear in less than 0.02% of job postings, so most postings rely on a small subset of commonly used terms, like teamwork.
Laura Adkins-Hackett, Economist, LMIC, and Sukriti Trehan, Data Scientist, LMIC, presented their research exploring trends in the skills listed in OJPs to develop a deeper understanding of in-demand skills. This research project uses pointwise mutual information and other methods to extract more information about common skills from the relationships between skills, occupations and regions.
Does teamwork really matter? Looking beyond the job posting to understand lab...
Komal dulam
1. RANBAXY LABORATORIES LIMITED Page |1
A
Project Report
On
Financial Analysis
Of
Submitted to
Global Institute of Management
Gujarat Technological University
On
10/12/2012
In Partial fulfillment of the requirements for the
Accounting for Managers course in the
Master of Business Administration Programme
Submitted By:
komal Dulam (16)
Ronak Modi (17)
Asha Desai (18)
Devika Singh (19)
Ketul Patel (20)
GLOBAL INSTITUTE OF MANAGEMENT
2. RANBAXY LABORATORIES LIMITED Page |2
Preface
The subject matter of financial management has been changing at a rapid phase about three
decades ago; the scope of financial management was circumscribed to the raising of funds, whenever needed
and little significance use to attach to the financial decision making of problem solving the mid fifties, the
emphasis shifted to wise utilization of funds.
The „modern‟ thinking in the financial management gives greater importance of management and
decision makes policy. Today the financial mgt is not in a passive role of a scorekeeper of the accounting
information and arranging funds.
We as a student of management cannot keep ourselves isolated from this field of financial
management. We need to know the practical application of or other theoretical knowledge so we have
prepared a financial report on “Ranbaxy Laboratories Ltd.” and have tried to analysis each and every report
of annual report of five successive years and put it in logical format as per my analysis.
GLOBAL INSTITUTE OF MANAGEMENT
3. RANBAXY LABORATORIES LIMITED Page |3
Acknowledgement
We are very much thankful to Ranbaxy laboratories Ltd. for these all type of information
is taken from the last five year financial statement.
We are also thankful to our Director Mr. Kishor Bhunsali who encourages us for studying the
finance.
We are mostly thankful to our Prof. Dhaval Patel for helping us in our practical studies in our
sem-1 (MBA) program and also very much thankful to her valuable suggestion, guidance in preparing this
report.
Also thankful to our parents for providing oriented and for all encouragement.
GLOBAL INSTITUTE OF MANAGEMENT
4. RANBAXY LABORATORIES LIMITED Page |4
Executive summary
Operating expenses may be defined as those that pertain to the production process, or, more
generally, the process of carrying out the business. Such processes include all those pertaining to purchases,
human resources, production and marketing and selling. Conventionally, expenses incurred on rising or
using finances are not considered as operational expenses. There are a few more - amortization, write-offs,
prior-period expenses, etc. Often, the distinction between operating and non-operating expenses is clear. But
at times there is some ambiguity regarding the nature of the expense.
As a result, the basic framework of data capture at CMIE avoids the classification of expense heads
as operational and non-operational. However, disclosure practices of companies often compel us to use the
term "operational expenses". Expenses that can be posted without the use of such a term are posted
appropriately into CMIE's detailed classification of expense items and, the remaining "operational expenses”
are clubbed into one of the two data-fields: "Other operational expenses of industrial enterprises" or "Other
operational expenses of non-financial services enterprises".
This data-field includes all operating expenses of an industrial enterprise that are not already
covered in any of the other data field. These are likely to be industry-specific operational expenses.
Examples of such expenses can be preservation expenses, laboratory expenses, testing expenses etc.
GLOBAL INSTITUTE OF MANAGEMENT
5. RANBAXY LABORATORIES LIMITED Page |5
Index
Sr.No. Content Page no.
Chapter :1
1 5
Introduction of Company
Chapter-2:
2 10
Comparative Balance sheet and Analysis of Balance Sheet
Chapter-3:
3 15
Comparative Profit and Loss Account and Analysis of Profit & Loss Statement
Chapter-4:
4 19
Common Size Statements
Chapter 5:
5 23
Trend Analysis (Index Analysis)
Chapter 6:
6 26
Analysis of Cash flow Statement
Chapter 7:
7 27
Ratio Analysis
Chapter 9:
9 36
Contemporary Issues in Accounting of the company
GLOBAL INSTITUTE OF MANAGEMENT
6. RANBAXY LABORATORIES LIMITED Page |6
CHAPTER: 1 (Company profile)
1.1 Introduction of Company
Ranbaxy was started by Ranbir Singh and Gurbax Singh in 1937 as a distributor for a Japanese
company Shionogi. The name Ranbaxy is a portmanteau word from the names of its first owners Ranbir and
Gurbax. Bhai Mohan Singh bought the company in 1952 from his cousins Ranbir Singh and Gurbax Singh.
After Bhai Mohan Singh's son Parvinder Singh joined the company in 1967, the company saw a significant
transformation in its business and scale. His sons Malvinder Mohan Singh and Shivinder Mohan Singh sold
the company to the Japanese company Daiichi Sankyo in June 2008.
Ranbaxy was established in 1961 and went public in the year 1973. It has global sales of US
$1340 million for the year ended on 31st December, 2006. It has the largest market in USA (sales appx. US
$380 million); then come Europe and BRICS (Brazil, Russia, India, China, South Africa).
1.2Company Details:
Type - Public
Founded - 1961
Headquarters- Gurgaon, Haryana, India
Employees - 1100 in R&D
Website - www.ranbaxy.com
For enquiries contact:
M. Giridhar Venugopal
Director – Global Business Development & Acquisitions
Ranbaxy Laboratories Limited
Plot No. 90, Sector 32,
Gurgaon – 122001 (Haryana), India
E-mail: business.development@ranbaxy.com
Registered Office
A-41, Industrial Area Phase VIII-A,
Sahibzada Ajit Singh Nagar,
Mohali - 160 071 (Punjab), INDIA
GLOBAL INSTITUTE OF MANAGEMENT
7. RANBAXY LABORATORIES LIMITED Page |7
1.3Products
Using the finest R&D and Manufacturing facilities, Ranbaxy Laboratories Limited manufactures
and markets generic pharmaceuticals, value added generic pharmaceuticals, branded generics, active
Pharmaceuticals (API) and intermediates.
The Company remains focused on ascending the value chain in the marketing of pharmaceutical
substances and are determined to bring in increased revenues from dosage forms sales.
Ranbaxy's diverse product basket of over 5,000 SKUs available in over 125 countries worldwide
encompasses a wide therapeutic mix covering a majority of the chronic and acute segments. Healthcare
trends project that the chronic treatment segments will outpace the acute treatment segments, primarily
driven by a growing aging population and dominance of lifestyle diseases. Their robust performance in
Cardiovasculars, Central Nervous System, Respiratory, Dermatology, Orthopedics, Nutritionals and Urology
segments, clearly indicates that the Company has strengthened its presence in the fast-growing chronic and
lifestyle disease segments.
Top 10 Molecules (2012)
• Valacyclovir
• Simvastatin
• Donepezil
• Atorvastatin & Combinations
• Co-amoxyclav & Combinations
• Ciprofloxacin & Combinations
• Ketorolac Tromethamine
• Imipenem+Cilastatin
• Ginseng+Vitamins
• Loratadine & Combinations
GLOBAL INSTITUTE OF MANAGEMENT
8. RANBAXY LABORATORIES LIMITED Page |8
1.4 Company History:
Ranbaxy Laboratories Ltd. is the largest pharmaceutical company in India, and one of the
world's top 100 pharmaceutical companies. Long a specialist in the preparation of generic drugs,
Ranbaxy is also one of the world's top 10 in that pharmaceutical category as well. Yet, with India's
agreement to apply international patent law at the beginning of 2005, Ranbaxy has begun converting
itself into a full-fledged research-based pharmaceutical company.
A major part of this effort has been the establishment of the company's own research and
development center, which has enabled the company to begin to enter the new chemical entities (NCE)
and novel drug delivery systems (NDDS) markets. In the mid-2000s, the company had a number of
NCEs in progress, and had already launched its first NDDS product, a single daily dosage formulation
of ciprofloxacin.
Ranbaxy is a truly global operation, producing its pharmaceutical preparations in
manufacturing facilities in seven countries, supported by sales and marketing subsidiaries in 44
countries, reaching more than 100 countries throughout the world. The United States, which alone
accounts for nearly half of all pharmaceutical sales in the world, is the company's largest international
market, representing more than 40 percent of group sales. In Europe, the company's purchase of RPG
(Aventis) S.A. makes it the largest generics producer in that market.
The company is also a leading generics producer in the United Kingdom and Germany and
elsewhere in Europe. European sales added 16 percent to the company's sales in 2004. Ranbaxy's other
major markets include Brazil, Russia, and China, as well as India, which together added 26 percent to
the group's sales. Ranbaxy posted revenues of $1.18 billion in 2004. The company, which remains
controlled and led by the founding Singh family, is listed on the National Stock Exchange of India in
Mumbai.
GLOBAL INSTITUTE OF MANAGEMENT
9. RANBAXY LABORATORIES LIMITED Page |9
1.5 Board of Directors
At the helm of the entire operations is the experience and able direction of the people who make it all
happen. Ranbaxy acknowledges their inspiring stewardship and indefatigable work.
Dr. Tsutomu Une Mr. Arun Sawhney Mr. Takashi Shoda
Chairman CEO & Managing Director Non Executive &
Non Executive & Non Independent Director
Non Independent Director
Dr. Kazunori Hirokawa Dr. Anthony H. Wild Mr. Rajesh V. Shah
Non Executive & Independent Director Independent Director
Non Independent Director
Mr. Akihiro Watanabe Mr. Percy K. Shroff
Independent Director Independent Director
GLOBAL INSTITUTE OF MANAGEMENT
10. R A N B A X Y L A B O R A T O R I E S L I M I T E D P a g e | 10
+
CHAPTER: 2 (Balance sheet 2008-2012)
Balance Sheet of Ranbaxy Laboratories of 2007-2011
------------------ in Rs. Cr. -------------------
Particulars Dec '11 Dec '10 Dec '09 Dec '08 Dec '07
Sources Of Funds
Total Share
211.00 210.52 210.21 210.19 186.54
Capital
Equity Share
211.00 210.52 210.21 210.19 186.54
Capital
Share
Application 0.67 6.60 175.85 175.66 1.18
Money
Preference
0.00 0.00 0.00 0.00 0.00
Share Capital
Reserves 1,713.16 4,915.28 3,748.54 3,330.92 2,350.68
Revaluation
0.00 0.00 0.00 0.00 0.00
Reserves
Net worth 1,924.83 5,132.40 4,134.60 3,716.77 2,538.40
Secured
229.59 195.39 175.83 162.07 365.07
Loans
Unsecured
4,103.94 4,065.33 3,172.55 3,563.30 3,137.96
Loans
Total Debt 4,333.53 4,260.72 3,348.38 3,725.37 3,503.03
Total
6,258.36 9,393.12 7,482.98 7,442.14 6,041.43
Liabilities
Application Of Funds
Gross Block 3,094.07 2,857.63 2,620.92 2,386.75 2,261.48
Less: Accum.
1,222.07 1,145.52 1,027.52 930.07 791.96
Depreciation
Net Block 1,872.00 1,712.11 1,593.40 1,456.68 1,469.52
Capital Work
222.62 330.18 414.92 428.77 327.42
in Progress
Investments 3,410.79 3,804.44 3,833.69 3,618.03 3,237.55
Inventories 1,655.23 1,489.91 1,230.48 1,198.52 976.07
GLOBAL INSTITUTE OF MANAGEMENT
11. R A N B A X Y L A B O R A T O R I E S L I M I T E D P a g e | 11
Sundry
3,689.95 1,292.63 1,534.65 1,024.54 882.91
Debtors
Cash and
66.90 22.44 25.56 49.86 69.38
Bank Balance
Total Current
5,412.08 2,804.98 2,790.69 2,272.92 1,928.36
Assets
Loans and
2,382.72 1,470.45 1,967.65 2,351.98 882.99
Advances
Fixed
1,871.14 2,689.85 728.56 1,885.08 111.07
Deposits
Total CA,
Loans & 9,665.94 6,965.28 5,486.90 6,509.98 2,922.42
Advances
Deferred
0.00 0.00 0.00 0.00 0.00
Credit
Current
5,157.68 2,491.08 3,082.89 3,840.11 1,177.35
Liabilities
Provisions 3,755.31 927.82 763.03 731.20 738.14
Total CL &
8,912.99 3,418.90 3,845.92 4,571.31 1,915.49
Provisions
Net Current
752.95 3,546.38 1,640.98 1,938.67 1,006.93
Assets
Miscellaneous
0.00 0.00 0.00 0.00 0.00
Expenses
Total Assets 6,258.36 9,393.11 7,482.99 7,442.15 6,041.42
GLOBAL INSTITUTE OF MANAGEMENT
12. R A N B A X Y L A B O R A T O R I E S L I M I T E D P a g e | 12
Comparative Balance sheet of Ranbaxy Laboratories of 2007-2011
------------------ in Rs. Cr. -------------------
Dec
Dec Dec Dec % % % %
Particulars '11-
'10-09 '09-08 '08-07 '11-10 '10-09 '09-08 '08-07
10
Sources Of Funds
Total Share 0.22800 0.14747 0.00951 12.6782
0.48 0.31 0.02 23.65
Capital 7 2 5 5
Equity Share 0.22800 0.14747 0.00951 12.6782
0.48 0.31 0.02 23.65
Capital 7 2 5 5
Share
- - 0.10816 14786.4
Application -5.93 -169.25 0.19 174.48
89.8485 96.2468 3 4
Money
Preference
- - - - - - - -
Share Capital
-
1166.7 - 31.1251 12.5376 41.7002
Reserves 3202 417.62 980.24
4 65.1462 8 8 7
.12
Revaluation
- - - - - - - -
Reserves
-
1178.3 - 24.1329 11.2417 46.4217
Net worth 3207 997.8 417.83
7 62.4965 3 5 6
.57
17.5034 11.1243 8.49015 -
Secured Loans 34.2 19.56 13.76 -203
5 8 9 55.6058
Unsecured 38.6 0.94973 28.1407 13.5546
892.78 -390.75 425.34 -10.966
Loans 1 8 7 7
72.8 1.70886 27.2472 - 6.34707
Total Debt 912.34 -376.99 222.34
1 6 1 10.1195 7
-
Total 1910.1 1400.7 - 25.5264 0.54876 23.1850
3134 40.84
Liabilities 4 1 33.3729 6 7 7
.76
Application Of Funds
236.
Gross Block 236.71 234.17 125.27 8.27 9.03 9.81 5.54
44
Less: Accum. 76.5
118.00 97.45 138.11 6.68 11.48 10.48 17.44
Depreciation 5
Net Block 159. 118.71 136.72 -12.84 9.34 7.45 9.39 -0.87
GLOBAL INSTITUTE OF MANAGEMENT
13. R A N B A X Y L A B O R A T O R I E S L I M I T E D P a g e | 13
89
-
Capital Work
107. -84.74 -13.85 101.35 -32.58 -20.42 -3.23 30.95
in Progress
56
-
Investments 393. -29.25 215.66 380.48 -10.35 -0.76 5.96 11.75
65
165.
Inventories 259.43 31.96 222.45 11.10 21.08 2.67 22.79
32
Sundry 2,39
-242.02 510.11 141.63 185.46 -15.77 49.79 16.04
Debtors 7.32
Cash and Bank 44.4
-3.12 -24.30 -19.52 198.13 -12.21 -48.74 -28.13
Balance 6
Total Current 2,60
14.29 517.77 344.56 92.95 0.51 22.78 17.87
Assets 7.10
Loans and 912. 1,468.9
-497.20 -384.33 62.04 -25.27 -16.34 166.37
Advances 27 9
- -
1,961.2 1,774.0 1,597.2
Fixed Deposits 818. 1,156.5 -30.44 269.20 -61.35
9 1 0
71 2
Total CA, -
2,70 1,478.3 3,587.5
Loans & 1,023.0 38.77 26.94 -15.72 122.76
0.66 8 6
Advances 8
Deferred
- - - - - - - -
Credit
Current 2,66 2,662.7
-591.81 -757.22 107.05 -19.20 -19.72 226.17
Liabilities 6.60 6
2,82
Provisions 164.79 31.83 -6.94 304.75 21.60 4.35 -0.94
7.49
Total CL & 5,49 2,655.8
-427.02 -725.39 160.70 -11.10 -15.87 138.65
Provisions 4.09 2
-
Net Current 1,905.4
2,79 -297.69 931.74 -78.77 116.11 -15.36 92.53
Assets 0
3.43
Miscellaneous
- - - - - - - -s
Expenses
-
1,910.1 1,400.7
Total Assets 3,13 40.84 -33.37 25.53 0.55 23.19
2 3
4.75
GLOBAL INSTITUTE OF MANAGEMENT
14. R A N B A X Y L A B O R A T O R I E S L I M I T E D P a g e | 14
Interpretation
Total of the shareholder funds and liabilities increase continuously in 2009 to 2011 because of
growth of the company.
Total liabilities have been increasing till 2011.
Current liabilities have also been increased in 2011.
The total assets also increase year which shows that company
Purchases investments and assets every year.
Its shows company‟s good profitability and financial soundness.
The Net Block of a company was continuously increased for but in 2010 it was decreased.
GLOBAL INSTITUTE OF MANAGEMENT
15. R A N B A X Y L A B O R A T O R I E S L I M I T E D P a g e | 15
CHAPTER: 3 (Profit and Loss account 2007-11)
Profit and Loss Account of Ranbaxy lab.
Particulars Dec '11 Dec '10 Dec '09 Dec '08 Dec '07
Income
Sales Turnover 7,709.17 5,687.33 4,797.49 4,676.21 4,344.39
Excise Duty 22.58 40.96 15.90 24.17 51.37
Net Sales 7,686.59 5,646.37 4,781.59 4,652.04 4,293.02
Other Income -3,990.57 562.45 485.66 -1,587.64 551.13
Stock
135.72 161.43 33.96 115.59 40.66
Adjustments
Total Income 3,831.74 6,370.25 5,301.21 3,179.99 4,884.81
Expenditure
Raw Materials 2,523.08 2,181.22 1,916.58 2,049.30 1,861.17
Power & Fuel
194.98 132.75 109.57 108.83 90.35
Cost
Employee Cost 845.24 608.28 582.50 472.65 420.04
Other
Manufacturing 112.69 96.68 89.94 94.65 82.60
Expenses
Selling and
1,579.37 1,332.70 1,306.25 1,402.77 1,341.03
Admin Expenses
Miscellaneous
1,283.54 185.14 158.07 383.26 123.90
Expenses
Preoperative Exp
0.00 0.00 0.00 0.00 0.00
Capitalized
Total Expenses 6,538.90 4,536.77 4,162.91 4,511.46 3,919.09
Operating Profit 1,283.41 1,271.03 652.64 256.17 414.59
PBDIT -2,707.16 1,833.48 1,138.30 -1,331.47 965.72
Interest 69.44 54.19 39.47 145.83 93.43
PBDT -2,776.60 1,779.29 1,098.83 -1,477.30 872.29
Depreciation 274.08 228.35 148.20 154.47 118.73
Other Written
7.83 0.00 0.00 0.00 0.00
Off
Profit Before Tax -3,058.51 1,550.94 950.63 -1,631.77 753.56
Extra-ordinary
15.44 21.88 111.42 17.76 35.46
items
PBT (Post Extra-
-3,043.07 1,572.82 1,062.05 -1,614.01 789.02
ord Items)
GLOBAL INSTITUTE OF MANAGEMENT
16. R A N B A X Y L A B O R A T O R I E S L I M I T E D P a g e | 16
Tax 6.69 415.48 488.86 -574.24 156.69
Reported Net
-3,052.05 1,148.73 571.98 -1,044.80 617.72
Profit
Total Value
4,015.82 2,355.55 2,246.33 2,462.16 2,057.93
Addition
Preference
0.00 0.00 0.00 0.00 0.00
Dividend
Equity Dividend 0.07 84.21 0.00 0.00 317.15
Corporate
-0.32 13.99 0.00 0.00 53.90
Dividend Tax
Shares in issue
4,220.00 4,210.41 4,204.17 4,203.70 3,730.71
(lakhs)
Earnings Per
-72.32 27.28 13.61 -24.85 16.56
Share (Rs)
Equity Dividend
0.03 40.00 0.00 0.00 170.00
(%)
GLOBAL INSTITUTE OF MANAGEMENT
17. R A N B A X Y L A B O R A T O R I E S L I M I T E D P a g e | 17
Comparative Profit and loss account of Ranbaxy ltd. 2007-2011
------------------ in Rs. Cr. -------------------
Particulars Dec Dec Dec Dec % % % %
'11-10 '10-09 '09-08 '08-07 '11-10 '10-09 '09-08 '08-07
Income
Sales Turnover 2,021.84 889.84 121.28 331.82 35.55 18.55 2.59 7.64
Excise Duty -18.38 25.06 -8.27 -27.20 -44.87 157.61 -34.22 -52.95
Net Sales 2,040.22 864.78 129.55 359.02 36.13 18.09 2.78 8.36
- -
Other Income 4,553.02
76.79 2,073.30
2,138.77
-809.50 15.81 -130.59 -388.07
Stock
-25.71 127.47 -81.63 74.93 -15.93 375.35 -70.62 184.28
Adjustments
- -
Total Income 2,538.51
1,069.04 2,121.22
1,704.82
-39.85 20.17 66.71 -34.90
Expenditure
Raw Materials 341.86 264.64 -132.72 188.13 15.67 13.81 -6.48 10.11
Power & Fuel
62.23 23.18 0.74 18.48 46.88 21.16 0.68 20.45
Cost
Employee
236.96 25.78 109.85 52.61 38.96 4.43 23.24 12.52
Cost
Other
Manufacturing 16.01 6.74 -4.71 12.05 16.56 7.49 -4.98 14.59
Expenses
Selling and
Admin 246.67 26.45 -96.52 61.74 18.51 2.02 -6.88 4.60
Expenses
Miscellaneous
1,098.40 27.07 -225.19 259.36 593.28 17.13 -58.76 209.33
Expenses
Preoperative
Exp 0.00 0.00 0.00 0.00 - - - -
Capitalized
Total
2,002.13 373.86 -348.55 592.37 44.13 8.98 -7.73 15.11
Expenses
Operating
12.38 618.39 396.47 -158.42 0.97 94.75 154.77 -38.21
Profit
- -
PBDIT 4,540.64
695.18 2,469.77
2,297.19
-247.65 61.07 -185.49 -237.87
Interest 15.25 14.72 -106.36 52.40 28.14 37.29 -72.93 56.08
- -
PBDT 4,555.89
680.46 2,576.13
2,349.59
-256.05 61.93 -174.38 -269.36
Depreciation 45.73 80.15 -6.27 35.74 20.03 54.08 -4.06 30.10
GLOBAL INSTITUTE OF MANAGEMENT
18. R A N B A X Y L A B O R A T O R I E S L I M I T E D P a g e | 18
Other Written
7.83 0.00 0.00 0.00 - - - -
Off
Profit Before - -
600.31 2,582.40 -297.20 63.15 -158.26 -316.54
Tax 4,609.45 2,385.33
Extra-ordinary
-6.44 -89.54 93.66 -17.70 -29.43 -80.36 527.36 -49.92
items
PBT (Post
- -
Extra-ord 4,615.89
510.77 2,676.06
2,403.03
-293.48 48.09 -165.80 -304.56
Items)
Tax -408.79 -73.38 1,063.10 -730.93 -98.39 -15.01 -185.13 -466.48
Reported Net - -
576.75 1,616.78 -365.69 100.83 -154.75 -269.14
Profit 4,200.78 1,662.52
Total Value
1,660.27 109.22 -215.83 404.23 70.48 4.86 -8.77 19.64
Addition
Preference
0.00 0.00 0.00 0.00 - - - -
Dividend
Equity
-84.14 84.21 0.00 -317.15 -99.92 - - -100.00
Dividend
Corporate
-14.31 13.99 0.00 -53.90 -102.29 - -- -100.00
Dividend Tax
Shares in issue
9.59 6.24 0.47 472.99 0.23 0.15 0.01 12.68
(lakhs)
Earnings Per
-99.60 13.67 38.46 -41.41 -365.10 100.44 -154.77 -250.06
Share (Rs)
Equity
-39.97 40.00 0.00 -170.00 -99.93 - - -100.00
Dividend (%)
Interpretation
Total income is more than total expenditure in every year.
Net profit has been increased in 2011 around 620%.
In 2011 the earning per share shows in negative change. It represent losses, non beneficial to the
company.
GLOBAL INSTITUTE OF MANAGEMENT
19. R A N B A X Y L A B O R A T O R I E S L I M I T E D P a g e | 19
CHAPTER:4 Common size Statement of Ranbaxy ltd.
Balance Sheet of Ranbaxy Laboratories of 2007-2011
------------------ in Rs. Cr. -------------------
Particulars Dec '11 Dec '10 Dec '09 Dec '08 Dec '07
Sources Of Funds
Total Share
3.37149 2.241215 2.809175 2.824322 3.08768
Capital
Equity Share
3.37149 2.241215 2.809175 2.824322 3.08768
Capital
Share
Application 0.010706 0.070264 2.3499996 2.360343 0.019532
Money
Preference
0 0 0 0 0
Share Capital
Reserves 27.37394 52.32851 50.094214 44.75756 38.90933
Revaluation
0 0 0 0 0
Reserves
Net worth 30.75614 54.63999 55.253388 49.94222 42.01654
Secured
3.668533 2.08014 2.3497323 2.177734 6.042775
Loans
Unsecured
65.57533 43.27987 42.396879 47.88005 51.94068
Loans
Total Debt 69.24386 45.36001 44.746612 50.05778 57.98346
Total
100 100 100 100 100
Liabilities
Application Of Funds
Gross Block 49.43899 30.42262 35.025037 32.07071 37.43292
Less: Accum.
19.527 12.19532 13.73141 12.49733 13.10884
Depreciation
Net Block 29.91199 18.2273 21.293627 19.57338 24.32408
Capital Work
3.557162 3.51513 5.5448424 5.761373 5.419587
in Progress
Investments 54.49974 40.50245 51.232061 48.61539 53.58922
Inventories 26.4483 15.86173 16.443694 16.10449 16.1563
GLOBAL INSTITUTE OF MANAGEMENT
20. R A N B A X Y L A B O R A T O R I E S L I M I T E D P a g e | 20
Sundry
58.96033 13.76147 20.508513 13.76672 14.61428
Debtors
Cash and
1.06897 0.238899 0.3415747 0.669968 1.148406
Bank Balance
Total Current
86.47761 29.8621 37.293782 30.54117 31.91899
Assets
Loans and
38.07259 15.65456 26.29497 31.6035 14.6156
Advances
Fixed
29.89825 28.63642 9.7362151 25.32978 1.838475
Deposits
Total CA,
Loans & 154.4484 74.15308 73.324968 87.47445 48.37306
Advances
Deferred
0 0 0 0 0
Credit
Current
82.41264 26.52029 41.198639 51.59947 19.48797
Liabilities
Provisions 60.0047 9.877666 10.19686 9.825118 12.21799
Total CL &
142.4173 36.39796 51.395498 61.42459 31.70596
Provisions
Net Current
12.03111 37.75512 21.929469 26.04986 16.66711
Assets
Miscellaneous
0 0 0 0 0
Expenses
Total Assets 100 100 100 100 100
GLOBAL INSTITUTE OF MANAGEMENT
21. R A N B A X Y L A B O R A T O R I E S L I M I T E D P a g e | 21
Profit and loss account (common size statement)
Particulars Dec '11 Dec '10 Dec '09 Dec '08 Dec '07
Income
Sales Turnover 100.00 100.00 100.00 100.00 100
Excise Duty 0.29 0.72 0.33 0.52 1.182444
Net Sales 99.71 99.28 99.67 99.48 98.81756
Other Income -51.76 9.89 10.12 -33.95 12.68602
Stock
1.76 2.84 0.71 2.47 0.93592
Adjustments
Total Income 49.70 112.01 110.50 68.00 112.4395
Expenditure
Raw Materials 32.73 38.35 39.95 43.82 42.84077
Power & Fuel
2.53 2.33 2.28 2.33 2.079694
Cost
Employee Cost 10.96 10.70 12.14 10.11 9.668561
Other
Manufacturing 1.46 1.70 1.87 2.02 1.901303
Expenses
Selling and
20.49 23.43 27.23 30.00 30.86809
Admin Expenses
Miscellaneous
16.65 3.26 3.29 8.20 2.851954
Expenses
Preoperative Exp
0.00 0.00 0.00 0.00 0
Capitalized
Total Expenses 84.82 79.77 86.77 96.48 90.21036
Operating Profit 16.65 22.35 13.60 5.48 9.543112
PBDIT -35.12 32.24 23.73 -28.47 22.22913
Interest 0.90 0.95 0.82 3.12 2.15059
PBDT -36.02 31.29 22.90 -31.59 20.07854
Depreciation 3.56 4.02 3.09 3.30 2.73295
Other Written
0.10 0.00 0.00 0.00 0
Off
Profit Before Tax -39.67 27.27 19.82 -34.90 17.34559
Extra-ordinary
0.20 0.38 2.32 0.38 0.816225
items
PBT (Post Extra-
-39.47 27.65 22.14 -34.52 18.16181
rod Items)
Tax 0.09 7.31 10.19 -12.28 3.60672
GLOBAL INSTITUTE OF MANAGEMENT
22. R A N B A X Y L A B O R A T O R I E S L I M I T E D P a g e | 22
Reported Net
-39.59 20.20 11.92 -22.34 14.2188
Profit
Total Value
52.09 41.42 46.82 52.65 47.36983
Addition
Preference
0.00 0.00 0.00 0.00 0
Dividend
Equity Dividend 0.00 1.48 0.00 0.00 7.300219
Corporate
0.00 0.25 0.00 0.00 1.240681
Dividend Tax
Shares in issue
54.74 74.03 87.63 89.90 85.8742
(laths)
Earnings Per
-0.94 0.48 0.28 -0.53 0.381181
Share (Rs)
Equity Dividend
0.00 0.70 0.00 0.00 3.913093
(%)
Analysis of Common Size Statement
The contribution of net sales in total income was nearly same in all the year
It was near about 98 to 100%.
The contribution of total expenditure was continuous decrease year by year, but in 2011 it
Increased.
So that from the above common size statement we can easily find out that
Company is at a growing stage.
GLOBAL INSTITUTE OF MANAGEMENT
23. R A N B A X Y L A B O R A T O R I E S L I M I T E D P a g e | 23
CHAPTER 5 (Trend analysis)
Balance sheet of Ranbaxy ltd.
particulars 2007 2008 2009 2010 2011
Sources Of Funds
Total Share Capital 100 112.6782 112.689 112.8552 113.1125
Equity Share Capital 100 112.6782 112.689 112.8552 113.1125
Share Application
Money 100 14886.44 14902.54 559.322 56.77966
Preference Share
Capital
Reserves 100 141.7003 159.4662 209.1003 72.87934
Revaluation Reserves
Net worth 100 146.4218 162.8821 202.1904 75.82847
Secured Loans 100 44.39423 48.16337 53.52124 62.88931
Unsecured Loans 100 113.5547 101.1023 129.5533 130.7837
Total Debt 100 106.3471 95.58525 121.6296 123.708
Total Liabilities 100 123.1851 123.8611 155.4784 103.5907
Application Of Funds
Gross Block 100 105.5393 115.894 126.3611 136.8162
Less: Accum.
Depreciation 100 117.439 129.7439 144.6437 154.3096
Net Block 100 99.12625 108.43 116.5081 127.3885
Capital Work in
Progress 100 130.9541 126.7241 100.843 67.99218
Investments 100 111.7521 118.4133 117.5098 105.351
Inventories 100 122.7904 126.0647 152.6438 169.5811
Sundry Debtors 100 116.0413 173.8173 146.4056 417.9305
Cash and Bank Balance 100 71.86509 36.84059 32.34361 96.42548
Total Current Assets 100 117.868 144.7183 145.4594 280.6571
Loans and Advances 100 266.3654 222.8394 166.5308 269.8468
Fixed Deposits 100 1697.2 655.9467 2421.761 1684.649
Total CA, Loans &
Advances 100 222.7599 187.7519 238.3395 330.7512
Differed Credit
Current Liabilities 100 326.1655 261.8499 211.5836 438.0753
Provisions 100 99.0598 103.372 125.697 508.7531
Total CL & Provisions 100 238.6496 200.78 178.487 465.3112
Net Current Assets 100 192.5327 162.9686 352.1973 74.7768
Miscellaneous Expenses
Total Assets 100 123.1854 123.8614 155.4785 103.5909
Contingent Liabilities 100 125.796 129.8756 137.3781 148.01
Book Value (Rs) 100 123.8641 138.4502 179.0031 67.04896
GLOBAL INSTITUTE OF MANAGEMENT
24. R A N B A X Y L A B O R A T O R I E S L I M I T E D P a g e | 24
Interpretation
Net worth was rapidly increasing from last 3 years but it has decreased in 2011.
Net block of the balance sheet has been increasing from 2008 to 2011 rapidly.
Total assests was decreased in 2011.
Profit and loss account (Trend analysis)
Income 2007 2008 2009 2010 2011
Sales Turnover 100 107.6379 110.4295 130.912 177.4511
Excise Duty 100 47.05081 30.95192 79.73525 43.95562
Net Sales 100 108.3629 111.3806 131.5244 179.0485
Other Income 100 -288.07 88.12077 102.054 -724.071
Stock
100 284.2843 83.52189 397.0241 333.7924
Adjustments
Total Income 100 65.09956 108.5244 130.4094 78.44195
Expenditure
Raw Materials 100 110.1082 102.9772 117.1962 135.5642
Power & Fuel
100 120.4538 121.2728 146.9286 215.8052
Cost
Employee Cost 100 112.525 138.6773 144.8148 201.2285
Other
Manufacturing 100 114.5884 108.8862 117.046 136.4286
Expenses
Selling and
Admin 100 104.6039 97.40647 99.37884 117.7729
Expenses
Miscellaneous
100 309.3301 127.5787 149.427 1035.948
Expenses
Preoperative
Exp Capitalized
Total Expenses 100 115.115 106.2213 115.7608 166.8474
Operating
100 61.78876 157.4182 306.5752 309.5613
Profit
PBDIT 100 -137.873 117.8706 189.8563 -280.326
Interest 100 156.0848 42.24553 58.00064 74.32302
PBDT 100 -169.359 125.9707 203.9792 -318.312
Depreciation 100 130.1019 124.821 192.3271 230.8431
Other Written
Off
Profit Before
100 -216.541 126.1519 205.8151 -405.875
Tax
Extra-ordinary 100 50.0846 314.2132 61.70333 43.54202
GLOBAL INSTITUTE OF MANAGEMENT
25. R A N B A X Y L A B O R A T O R I E S L I M I T E D P a g e | 25
items
PBT (Post
Extra-ord 100 -204.559 134.6037 199.3384 -385.677
Items)
Tax 100 -366.482 311.9918 265.1605 4.269577
Reported Net
100 -169.138 92.59535 185.9629 -494.083
Profit
Total Value
100 119.6426 109.1548 114.4621 195.1388
Addition
Preference
Dividend
Equity
100 0 0 26.5521 0.022072
Dividend
Corporate
100 0 0 25.95547 -0.59369
Dividend Tax
Per share data
(annualized)
Shares in issue
100 112.6783 112.6909 112.8581 113.1152
(lakhs)
Earnings Per
100 -150.06 82.18599 164.7343 -436.715
Share (Rs)
Equity
100 0 0 23.52941 0.017647
Dividend (%)
Book Value
100 123.8641 138.4502 179.0031 67.04896
(Rs)
Interpretation
Total income of the company is decreased in 2011 as compared to last four years.
Expenditure is increased in 2011, which is loss for a company.
Earnings per share were increasing till 2010, but it went to negative in 2011.
GLOBAL INSTITUTE OF MANAGEMENT
26. R A N B A X Y L A B O R A T O R I E S L I M I T E D P a g e | 26
CHAPTER 6: (Cashflow Statement)
Cash Flow of Ranbaxy Laboratories in Rs. Cr.
Particulars. Dec '11 Dec '10 Dec '09 Dec '08 Dec '07
1565.2
Net Profit Before Tax -3048.67 1061.92 -1619.08 774.41
5
1168.8
Net Cash From Operating Activities 138.14 -665.43 -599.22 685.77
9
-
Net Cash (used in)/from
1094.73 2067.8 86.12 -462.91 -708.18
Investing Activities
0
Net Cash (used in)/from Financing Activities -1268.98 991.48 -214.14 2817.20 132.19
Net (decrease)/increase In Cash and Cash
-35.13 92.57 -793.46 1755.07 109.78
Equivalents
Opening Cash & Cash Equivalents 161.83 69.26 862.39 172.14 62.36
Closing Cash & Cash Equivalents 126.70 161.83 68.93 1927.21 172.14
Interpretation:
It shows the cash inflow and outflow of the company.
The highest cash equivalents in the year 2008 in last five years.
There is a major difference between the financing activities of the year
2007 & 2008 because of company issue shares more than last year
Cash generated from operating activities is also highest in the 2010 as compare
to the last five years. It may be because of high collection of
debtors or sales of goods and services.
It shows from the last five year analysis that cash flow is in increasing and decreasing mood.
GLOBAL INSTITUTE OF MANAGEMENT
27. R A N B A X Y L A B O R A T O R I E S L I M I T E D P a g e | 27
Chapter 6 (Ratio analysis)
6.1- CLASSIFICATION OF RATIO
As per requirement of various users the ratio may be classified in following groups.
Profitability Ratio:-
1. Gross profit ratio.
2. Net profit ratio
3. Return on capital employs ratio
4. Return on share holders fund
5. Return on equity share holders fund
6. Operating ratio
7. Expenses ratio
8. Earnings per share
9. Dividend per share
10. Price Earnings ratio
Liquidity ratio:-
1. Current ratio
2. Liquid ratio
Leverage ratio:-
1. Debt equity ratio
2. Proprietary ratio
3. Capital gearing ratio
4. Long term fund to fixed assets
Activity ratio:-
1. Sales turnover ratio
2. Total assets turnover ratio
3. Debtor ratio
4. Creditor ratio
5. Book value per share
6. Working capital turnover ratio
Coverage ratio:-
1. Debt service coverage ratio
2. Interest coverage ratio
GLOBAL INSTITUTE OF MANAGEMENT
28. R A N B A X Y L A B O R A T O R I E S L I M I T E D P a g e | 28
Profitability ratio
1. Gross profit ratio.= Gross profit *100
Sales
Year 2007 2008 2009 2010 2011
Gross
profit
3,094.07 2,857.63 2,620.92 2,386.75 2,261.48
Sales 7,709.17 5,687.33 4,797.49 4,676.21 4,344.39
Profit 40.13493 50.24555 54.63107 51.04027 52.05518
margin%
Gross profit
60
54.63107
51.04027 52.05518
50.24555
50
40.13493
40
30
Profit
20
10
0
2007 2008 2009 2010 2011
Interpretation: Profit is increased in 2009 because of more production. It is in 2007 is very less as
compare to other.
GLOBAL INSTITUTE OF MANAGEMENT
29. R A N B A X Y L A B O R A T O R I E S L I M I T E D P a g e | 29
2. Net profit ratio = Net profit ×100
Sales
Year 2007 2008 2009 2010 2011
Net profit 1,872.00 1,712.11 1,593.40 1,456.68 1,469.52
Sales 7,709.17 5,687.33 4,797.49 4,676.21 4,344.39
Profit
24.2828 30.1039 33.2132 31.1509 33.8257
margin%
Net profit
40
33.2132 33.8257
35
30.1039 31.1509
30
24.2828
25
20
profit
15
10
5
0
2007 2008 2009 2010 2011
Interpretation: Net profit is increased in the 2011 by 33.83% while it is less in the
2007 by 24.28%. It because of increasing in more selling of products.
GLOBAL INSTITUTE OF MANAGEMENT
30. R A N B A X Y L A B O R A T O R I E S L I M I T E D P a g e | 30
3. Operating ratio = Operating exps ×100
Sales
Years 2007 2008 2009 2010 2011s
Operating exps 6,538.90 4,536.77 4,162.91 4,511.46 3,919.09
Sales 7,709.17 5,687.33 4,797.49 4,676.21 4,344.39
Operating 84.82 79.77 86.77 96.48 90.21
ratio%
Operating ratio
120
100 96.48
90.21
84.82 86.77
79.77
80
60
Operating ratio
40
20
0
2007 2008 2009 2010 2011
Interpretation: In the ratio exps is 96.48% in the 2010 it decrease the profit of the company.
GLOBAL INSTITUTE OF MANAGEMENT
31. R A N B A X Y L A B O R A T O R I E S L I M I T E D P a g e | 31
4. Earnings per share = Earning per share *100
Share holders fund
Years 2007 2008 2009 2010 2011
Earnings per
share
-72.32 27.28 13.61 -24.85 16.56
Share
holders fund
1,924.83 5,132.40 4,134.60 3,716.77 2,538.40
E.P.S ratio -3.76 0.53 0.329 -0.67 0.65
5. Return on capital employs Ratio = E.B.I.T ×100
Net worth
2007 2008 2009 2010 2011
E.B.I.T -3,058.51 1,550.94 950.63 -1,631.77 753.56
Net worth 1,924.83 5,132.40 4,134.60 3,716.77 2,538.40
Return on
capital 22.99 43.90 29.69
158.90 30.22
employs
ratio
6. Dividend per share = equity dividend ×100
Pref, share
Years 2007 2008 2009 2010 2011
equity dividend 0.07 84.21 0.00 0.00 317.15
Pref, share 211.00 210.52 210.21 210.19 186.54
Dividend ratio 0.033 40 0 0 170.017s
GLOBAL INSTITUTE OF MANAGEMENT
32. R A N B A X Y L A B O R A T O R I E S L I M I T E D P a g e | 32
Liquidity ratio:-
1. Current ratio = Current Assets
Current liabilities
Years 2007 2008 2009 2010 2011
Current assests 5,412.08 2,804.98 2,790.69 2,272.92 1,928.36
Current
liabilities 5,157.68 2,491.08 3,082.89 3,840.11 1,177.35
Ratio 1.05 1.13 0.90 0.59 1.64
Current ratio
1.8
1.64
1.6
1.4
1.2 1.13
1.05
1 0.9
0.8 Current ratio
0.59
0.6
0.4
0.2
0
2007 2008 2009 2010 2011
Interpretation: ration is increased by 1.05 in the 2007 while it is 1.64 in last year so it is good for company
GLOBAL INSTITUTE OF MANAGEMENT
33. R A N B A X Y L A B O R A T O R I E S L I M I T E D P a g e | 33
2. Liquid ratio = Current assests –(stock-prepared exps).
Current liabilities.
Years 2007 2008 2009 2010 2011
Current
assests –
(stock-
prepared 5,276.36 2,643.55 2,756.73 2,157.33 1,887.70
exps).
Current
liabilities. 5,157.68 2,491.08 3,082.89 3,840.11 1,177.35
Ratio 1.023 1.06 0.89 0.56 1.60
Liquid ratio
1.8
1.6
1.6
1.4
1.2 1.023 1.06
1 0.89
0.8 Liqui ratio
0.56
0.6
0.4
0.2
0
2007 2008 2009 2010 2011
Interpretation: In the year 2011 it is 1.6 so reduces the liabilities.
GLOBAL INSTITUTE OF MANAGEMENT
34. R A N B A X Y L A B O R A T O R I E S L I M I T E D P a g e | 34
Leverage ratio:-
1. Debt equity ratio = Long term debt
Share holders fund
Year 2007 2008 2009 2010 2011
Long term debt 4,333.53 4,260.72 3,348.38 3,725.37 3,503.03
Share holders
1,924.83 5,132.40 4,134.60 3,716.77 2,538.40
fund
Ratio 2.25 0.83 0.81 1.00 1.38
Debt ratio
2.5
2.25
2
1.5 1.38
1 debt ratio
1 0.83 0.81
0.5
0
2007 2008 2009 2010 2011
Interpretation: In the year 2007 it is 2.25 while it is1.38 in the 2011.
GLOBAL INSTITUTE OF MANAGEMENT
35. R A N B A X Y L A B O R A T O R I E S L I M I T E D P a g e | 35
2. Proprietary ratio= Share holders fund
Total assets
Years 2007 2008 2009 2010 2011
Share
holders 1,924.83 5,132.40 4,134.60 3,716.77 2,538.40
fund
Total
assets 6,258.36 9,393.11 7,482.99 7,442.15 6,041.42
Ratio 0.31 0.55 0.55 0.50 0.42
Proprietary ratio
0.6 0.55 0.55
0.5
0.5
0.42
0.4
0.31
0.3
Proprietary ratio
0.2
0.1
0
2007 2008 2009 2010 2011
Interpretation: In the 2008 & 2009 it is 0.55 while it is in the 2007 by 0.31.
GLOBAL INSTITUTE OF MANAGEMENT
36. R A N B A X Y L A B O R A T O R I E S L I M I T E D P a g e | 36
ACCOUNTIG POLICES AND NOTES
Significant accounting polices:-
Schedule ‘N’:-
a. Basis preparation of financial statement:-
The financial statement are prepared under the historical cost conventional accept for certain
fixed assets which are revalued in accordance with the generally accepted accounting
principles in India. And the provisions of the companies act 1956.
b. Use of estimates :-
The preparation of financial statements requires estimates and assumptions to be made that
affect the reported amount of assets and liabilities on the date of the financial statements and
the reported amount of revenues and expense during the accounting period.
c. Own fixes assts:-
Fixed assets are stated at cost net of value added tax. And includes amounts added on
revaluations less accumulated depreciation and impairment loss if any all cost including
financial cost in commencement of commercial product net charges on foreign exchange
contract arising from exchange rate variations attribute table to the fixed assets are
capitalized.
d. Leased assts:-
Operating leases rentals are expensed with reference to lease terms and other considerations.
I. finance leases prior to 1st April, 2001: rentals are expensed with reference to lease terms and other
consideration.
II. Financial leases on or after 1st April. 2001: the lower of the value of the assets and present value of the
minimum lease rentals is capitalized as fixed assets with corresponding amount shown as lease liability. The
principal component in the lease rental is adjusted against the lease liability and the interest component is
charged to profit and loss account.
e. Intangible assets:-
Intangible assets are stated at cost of acquisition less accumulated amortiosation.
f. Depreciation:-
Depreciation on fixes assets is provided to the extent of depreciable amount on written down
value method at rates and in the manner prescribed in the company‟s act 1956.
GLOBAL INSTITUTE OF MANAGEMENT
37. R A N B A X Y L A B O R A T O R I E S L I M I T E D P a g e | 37
Depreciation is provided on straight line method over their useful life. 100% depreciation is
provided in the year of additions, on additions forming an integral part of existing plans
including incremental cost arising on account of translation of foreign currency liabilities for
accusation of fixed assets. Depreciation is provided as aforesaid over the residual life of the
assets as certifies by values on assets acquired under fiancé lease from 1st April 2001.
Depreciation is provided over the lease term.
g. Foreign currency transactions:-
Transactions denominated in foreign currencies are recorded at the exchange rate
prevailing on the date of the transaction.
Monitory items denominated in foreign currency at year and are restated at year end
rates in case of items which are covered by forward exchange contracts.
Nonmonetary currency items are carried at cost.
h. Inventories:-
Items of inventories are measured at lower of the cost and net realizable value after providing
for obsolescence if any. Cost of inventories comprises of cost of purchase, cost of conversion
and other cost incurred in bringing them to their respective present location and condition.
i. Employee benefits:-
Short term employee benefits are recognize as an expense at the undiscounted amount
in pal account of the year in which the rendered services is rendered.
In respect of employees stock options the excess of fair price on the date of grant over
the exercise price is recognized as differed compensation cost amortized over the
vesting period.
j. Provision for current differed tax:-
Provision for tax is made after taking in to consideration benefits admissible under the
provisions of the income tax act 1961. Differed tax resulting from timing difference between
taxable and accounting income is accounted for using the tax rates and laws that are in acted
as on the balacesheet date.
k. Provisions contingent liabilities and assts:-
Provisions involving substantial degree of estimation in measurement are recognized when
there is a present obligation is a result of past events. Contingent liabilities are not recognized
but are disclosed in the notes. Contingent assets are neither recognized not disclosed.
GLOBAL INSTITUTE OF MANAGEMENT
38. R A N B A X Y L A B O R A T O R I E S L I M I T E D P a g e | 38
Conclusion
The RANBAXY Project has documented substantial differences in the treatment of student and
faculty in the College of Medicine. Current objectives are to
1) continue with analysis of the data collected, particularly the ethnographic interviews with faculty
and department chairs, and
2) Continue to meet with faculty and administration to identify additional strategies for solving the
problems identified.
The ultimate goal of the project is to achieve parity for student and faculty in an environment of
academic excellence.
GLOBAL INSTITUTE OF MANAGEMENT
39. R A N B A X Y L A B O R A T O R I E S L I M I T E D P a g e | 39
Bibliography (References):
www.google.com
http://www.moneycontrol.com/financials/ranbaxylaboratories/balance-sheet/RL#RL
www.ranbaxy.com
International Directory of Company Histories, Vol. 70. St. James Press, 2005.
http://www.fundinguniverse.com/company-histories/ranbaxy-laboratories-ltd-history/
GLOBAL INSTITUTE OF MANAGEMENT