TITLE:Hepatoprotective effect ofMoringa oleifera extract on TNF-α and TGF-β expression in
acetaminophen-induced liver fibrosis in rats
AUTHORS: Omnia Aly , Dalia M. Abouelfadl, Olfat G. Shaker, Gehan A. Hegazy,
Ahmed M. Fayez and Hanan Hassan Zaki
SOURCE: Egyptian Journal of Medical Human Genetics
https://doi.org/10.1186/s43042-020-00106-z
YEAR OF PUBLICATION: 2020
PRESENTER: ADESINA-ALASHE KOFOWOROLA JUSTINA
COURSE CODE: BCH 452(special Topics/Seminar in Biochemistry)
SUPERVISOR: DR R.A LAWAL
2.
• Liver isan important organ responsible for a variety of critical biochemical and physiological
phenomena, such as the metabolism and detoxification of endogenous and exogenous substances,
such as drugs, xenobiotics, and homeostasis(Kahaar et al (2018)
• Acetaminophen (N-acetyl-para-aminophenol, paraceta- mol, APAP) is one of the most widely used
analgesic and antipyretic agents that does not require a prescription (Agrawal et al, Khazaeni,et al
2020)
• At toxic doses, acetaminophen is metabolized to NAPQI, which depletes glutathione, causing
oxidative stress, hepatocyte damage, inflammation, and fibrosis.
INTRODUCTION
3.
• In lightof recent scientific developments around the world, the medicinal features of the plants have
also been examined due to their potent pharmacological activity, low toxicity, and economic
feasibility compared to synthetic drugs (Singh et al 2011)
• Moringa oleifera extracts exhibit multiple nutritional or pharmacological functions (Ramadan 2019
INTRODUCTION(cont’d)
4.
AIM OF STUDY
•The aim of this study was to evaluate the hepatoprotective role of Moringa
oleifera extract on acetaminophen-induced liver fibrosis in albino rats by
assessing liver enzymes, inflammatory markers, gene expression, and
histopathological changes.
• TNF-α and TGF-β were selected as key inflammatory and fibrogenic
markers of liver injury.
5.
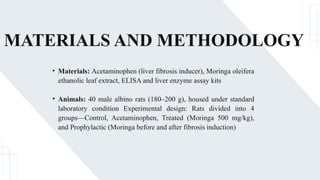
MATERIALS AND METHODOLOGY
•Materials: Acetaminophen (liver fibrosis inducer), Moringa oleifera
ethanolic leaf extract, ELISA and liver enzyme assay kits
• Animals: 40 male albino rats (180–200 g), housed under standard
laboratory condition Experimental design: Rats divided into 4
groups—Control, Acetaminophen, Treated (Moringa 500 mg/kg),
and Prophylactic (Moringa before and after fibrosis induction)
6.
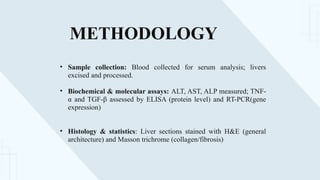
METHODOLOGY
• Sample collection:Blood collected for serum analysis; livers
excised and processed.
• Biochemical & molecular assays: ALT, AST, ALP measured; TNF-
α and TGF-β assessed by ELISA (protein level) and RT-PCR(gene
expression)
• Histology & statistics: Liver sections stained with H&E (general
architecture) and Masson trichrome (collagen/fibrosis)
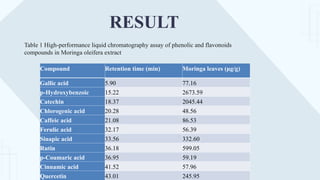
RESULT
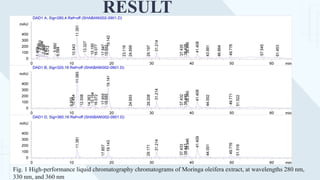
Fig. 1 High-performanceliquid chromatography chromatograms of Moringa oleifera extract, at wavelengths 280 nm,
330 nm, and 360 nm
9.
RESULT
Groups Parameters
ALT (IU/L)AST (IU/L) ALP (IU/L)
Control group 51.53 ± 4.89 126.12 ± 10.94 175.59 ± 5.36
Acetaminophen
group
181.99 ± 7.20a
580.5 ± 52.34a
259.34 ± 14.37a
Treated group 65.42 ± 2.44a,b
154.81 ± 8.92a,b
184.25 ± 5.31a,b
Prophylactic group 50.36 ± 1.94b
125.75 ± 5.18b
173.68 ± 8.9b
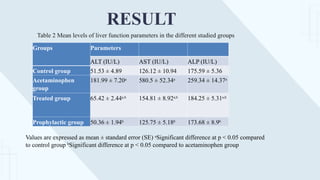
Table 2 Mean levels of liver function parameters in the different studied groups
Values are expressed as mean ± standard error (SE) a
Significant difference at p < 0.05 compared
to control group b
Significant difference at p < 0.05 compared to acetaminophen group
10.
RESULT
Groups Parameters
TNF-α ng/gTGF-B ng/g
Control group 141.1 ± 1.17 238.8 ± 10.81
Acetaminophen group 558.8 ± 26.55a
968.3 ± 15.46a
Treated group 231.4 ± 7.18a,b
311.5 ± 7.17a,b
Prophylactic group 137.2 ± 2.34b
232.9 ± 9.77b
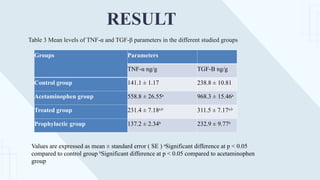
Table 3 Mean levels of TNF-α and TGF-β parameters in the different studied groups
Values are expressed as mean ± standard error ( SE ) a
Significant difference at p < 0.05
compared to control group b
Significant difference at p < 0.05 compared to acetaminophen
group
11.
RESULT
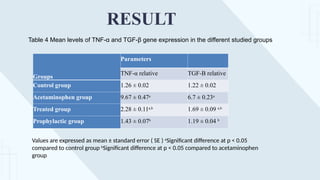
Table 4 Meanlevels of TNF-α and TGF-β gene expression in the different studied groups
Values are expressed as mean ± standard error ( SE ) a
Significant difference at p < 0.05
compared to control group b
Significant difference at p < 0.05 compared to acetaminophen
group
Groups
Parameters
TNF-α relative TGF-B relative
Control group 1.26 ± 0.02 1.22 ± 0.02
Acetaminophen group 9.67 ± 0.47a
6.7 ± 0.23a
Treated group 2.28 ± 0.11a,b
1.69 ± 0.09 a,b
Prophylactic group 1.43 ± 0.07b
1.19 ± 0.04 b
12.
RESULT
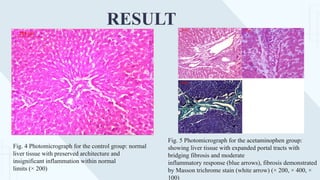
Fig. 4 Photomicrographfor the control group: normal
liver tissue with preserved architecture and
insignificant inflammation within normal
limits (× 200)
Fig. 5 Photomicrograph for the acetaminophen group:
showing liver tissue with expanded portal tracts with
bridging fibrosis and moderate
inflammatory response (blue arrows), fibrosis demonstrated
by Masson trichrome stain (white arrow) (× 200, × 400, ×
100)
13.
RESULT
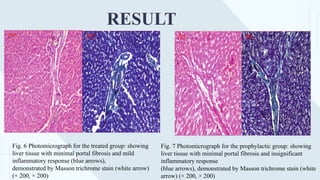
Fig. 6 Photomicrographfor the treated group: showing
liver tissue with minimal portal fibrosis and mild
inflammatory response (blue arrows),
demonstrated by Masson trichrome stain (white arrow)
(× 200, × 200)
Fig. 7 Photomicrograph for the prophylactic group: showing
liver tissue with minimal portal fibrosis and insignificant
inflammatory response
(blue arrows), demonstrated by Masson trichrome stain (white
arrow) (× 200, × 200)
14.
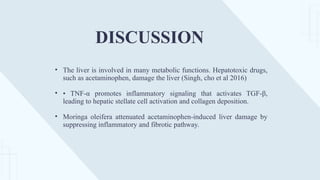
• The liveris involved in many metabolic functions. Hepatotoxic drugs,
such as acetaminophen, damage the liver (Singh, cho et al 2016)
• • TNF-α promotes inflammatory signaling that activates TGF-β,
leading to hepatic stellate cell activation and collagen deposition.
• Moringa oleifera attenuated acetaminophen-induced liver damage by
suppressing inflammatory and fibrotic pathway.
DISCUSSION
15.
CONCLUSION
• Biochemical parametersand histopathology responses provide
evidence that Moringa oleifera ethanol extract has a great
Hepatoprotective effect
16.
REFERENCES
• Singh D,Kaur R, Chander V, Chopra K (2006) Antioxidants in the preventionof renal disease. J
Med Food. 9(4):443–450Wallace JL (2004) Acetaminophen hepatotoxicity: NO to the rescue.
Br.J. Pharmacol. 143(1):1–2
• Singh D, Cho WC, Upadhyay G (2016) Drug induced liver toxicity and prevention by herbal
antioxidants: an overview. Front Physiol. 26(6):36
• Ramamurthy V, Abarna T (2014) Hepatoprotective activity of Phyllanthus niruri whole plant
extract against Staphylococcus aureus intoxicated albino rats. G.J.B.A.H.S. 3(3):256–260
• Saleem HT, El-Maali AN, Hassan HM, Mohamed AN, Mostafa MAN, Kahaar AE et al (2018)
Comparative protective effects of N-acetylcysteine, N-acetyl methionine, and N-acetyl
glucosamine against paracetamol and phenacetin therapeutic doses–induced hepatotoxicity in
rats. Int J Hepatol 2018(8):1–8.