This document provides an overview of a paper submitted by Edward Knish to fulfill honors requirements at the University of North Carolina Wilmington. The paper explores methods for evaluating the value of information systems from both historical and current perspectives. It first defines key terms like information and information systems. It then reviews qualitative, economic, and financial valuation methods used historically. Current methods like IT option pricing and Tobin's Q are also examined. The goal is to synthesize these approaches into a practical model for practitioners to evaluate individual information systems based on determining scope, requirements, impact levels, and matching costs and benefits. The paper concludes that a single valuation method cannot apply to all systems due to their unique nature, requiring instead a standard evaluation approach tailored for
![4
I. Introduction
IT business value research encompasses a variety of disciplines in an attempt to prescribe
financial value to an information system (IS) and its related technologies. While this research may seem to
be a simple marriage of information system studies and financial practice, IT business value research
extends across fields from ergonomics to macroeconomics, psychology to operations management, and
even epistemology to software engineering. A comprehensive review of IT business value would take
volumes to fully integrate all of these concepts. This paper does not seek to provide this corresponding
magnitude of information. Rather, the focus remains on historical and current methods of deriving the
value of information systems and exploring these various frameworks in order to establish a way for
financial practitioners to calculate the intrinsic value of a proposed information system.
With the birth of wide-scale internet access and its resulting technological revolution, a majority
of IT professionals have come to perceive information systems as sources of enormous intrinsic value.
However, the financial field still tends to approach them as cost centers rather than value creators [1, p. 4].
For those not particularly motivated by the study of ITBV, its importance to business professionals cannot
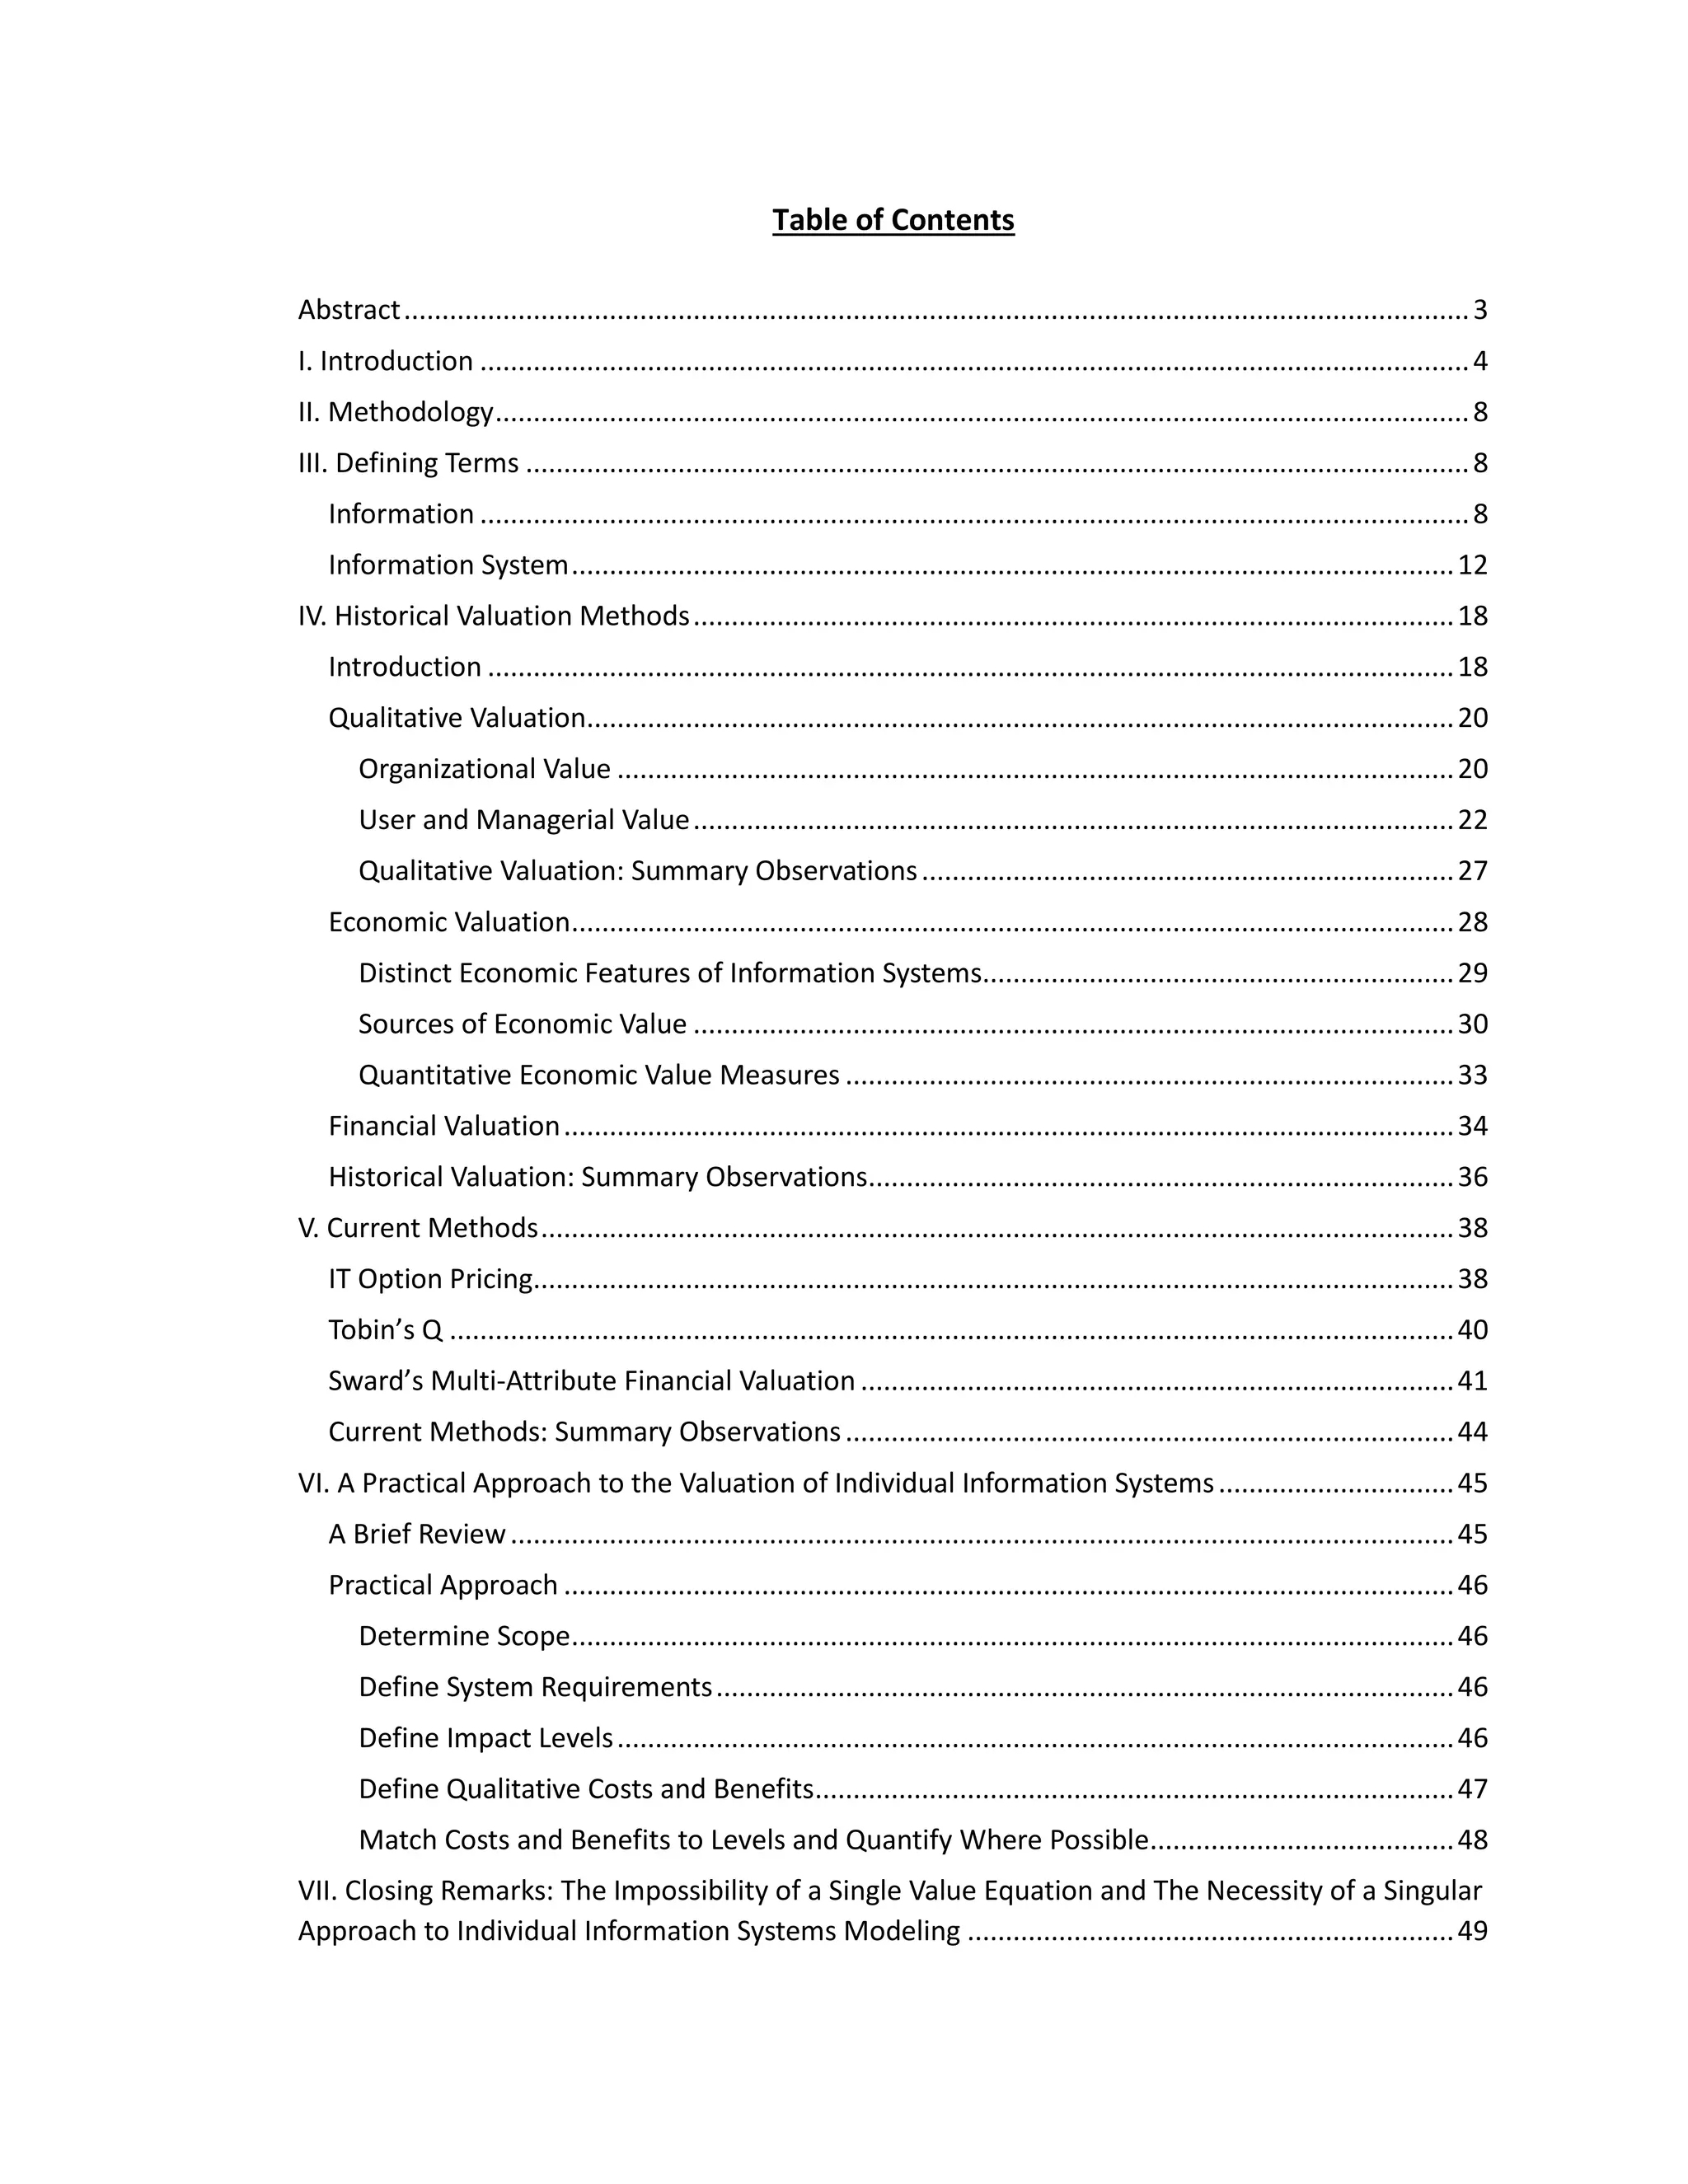
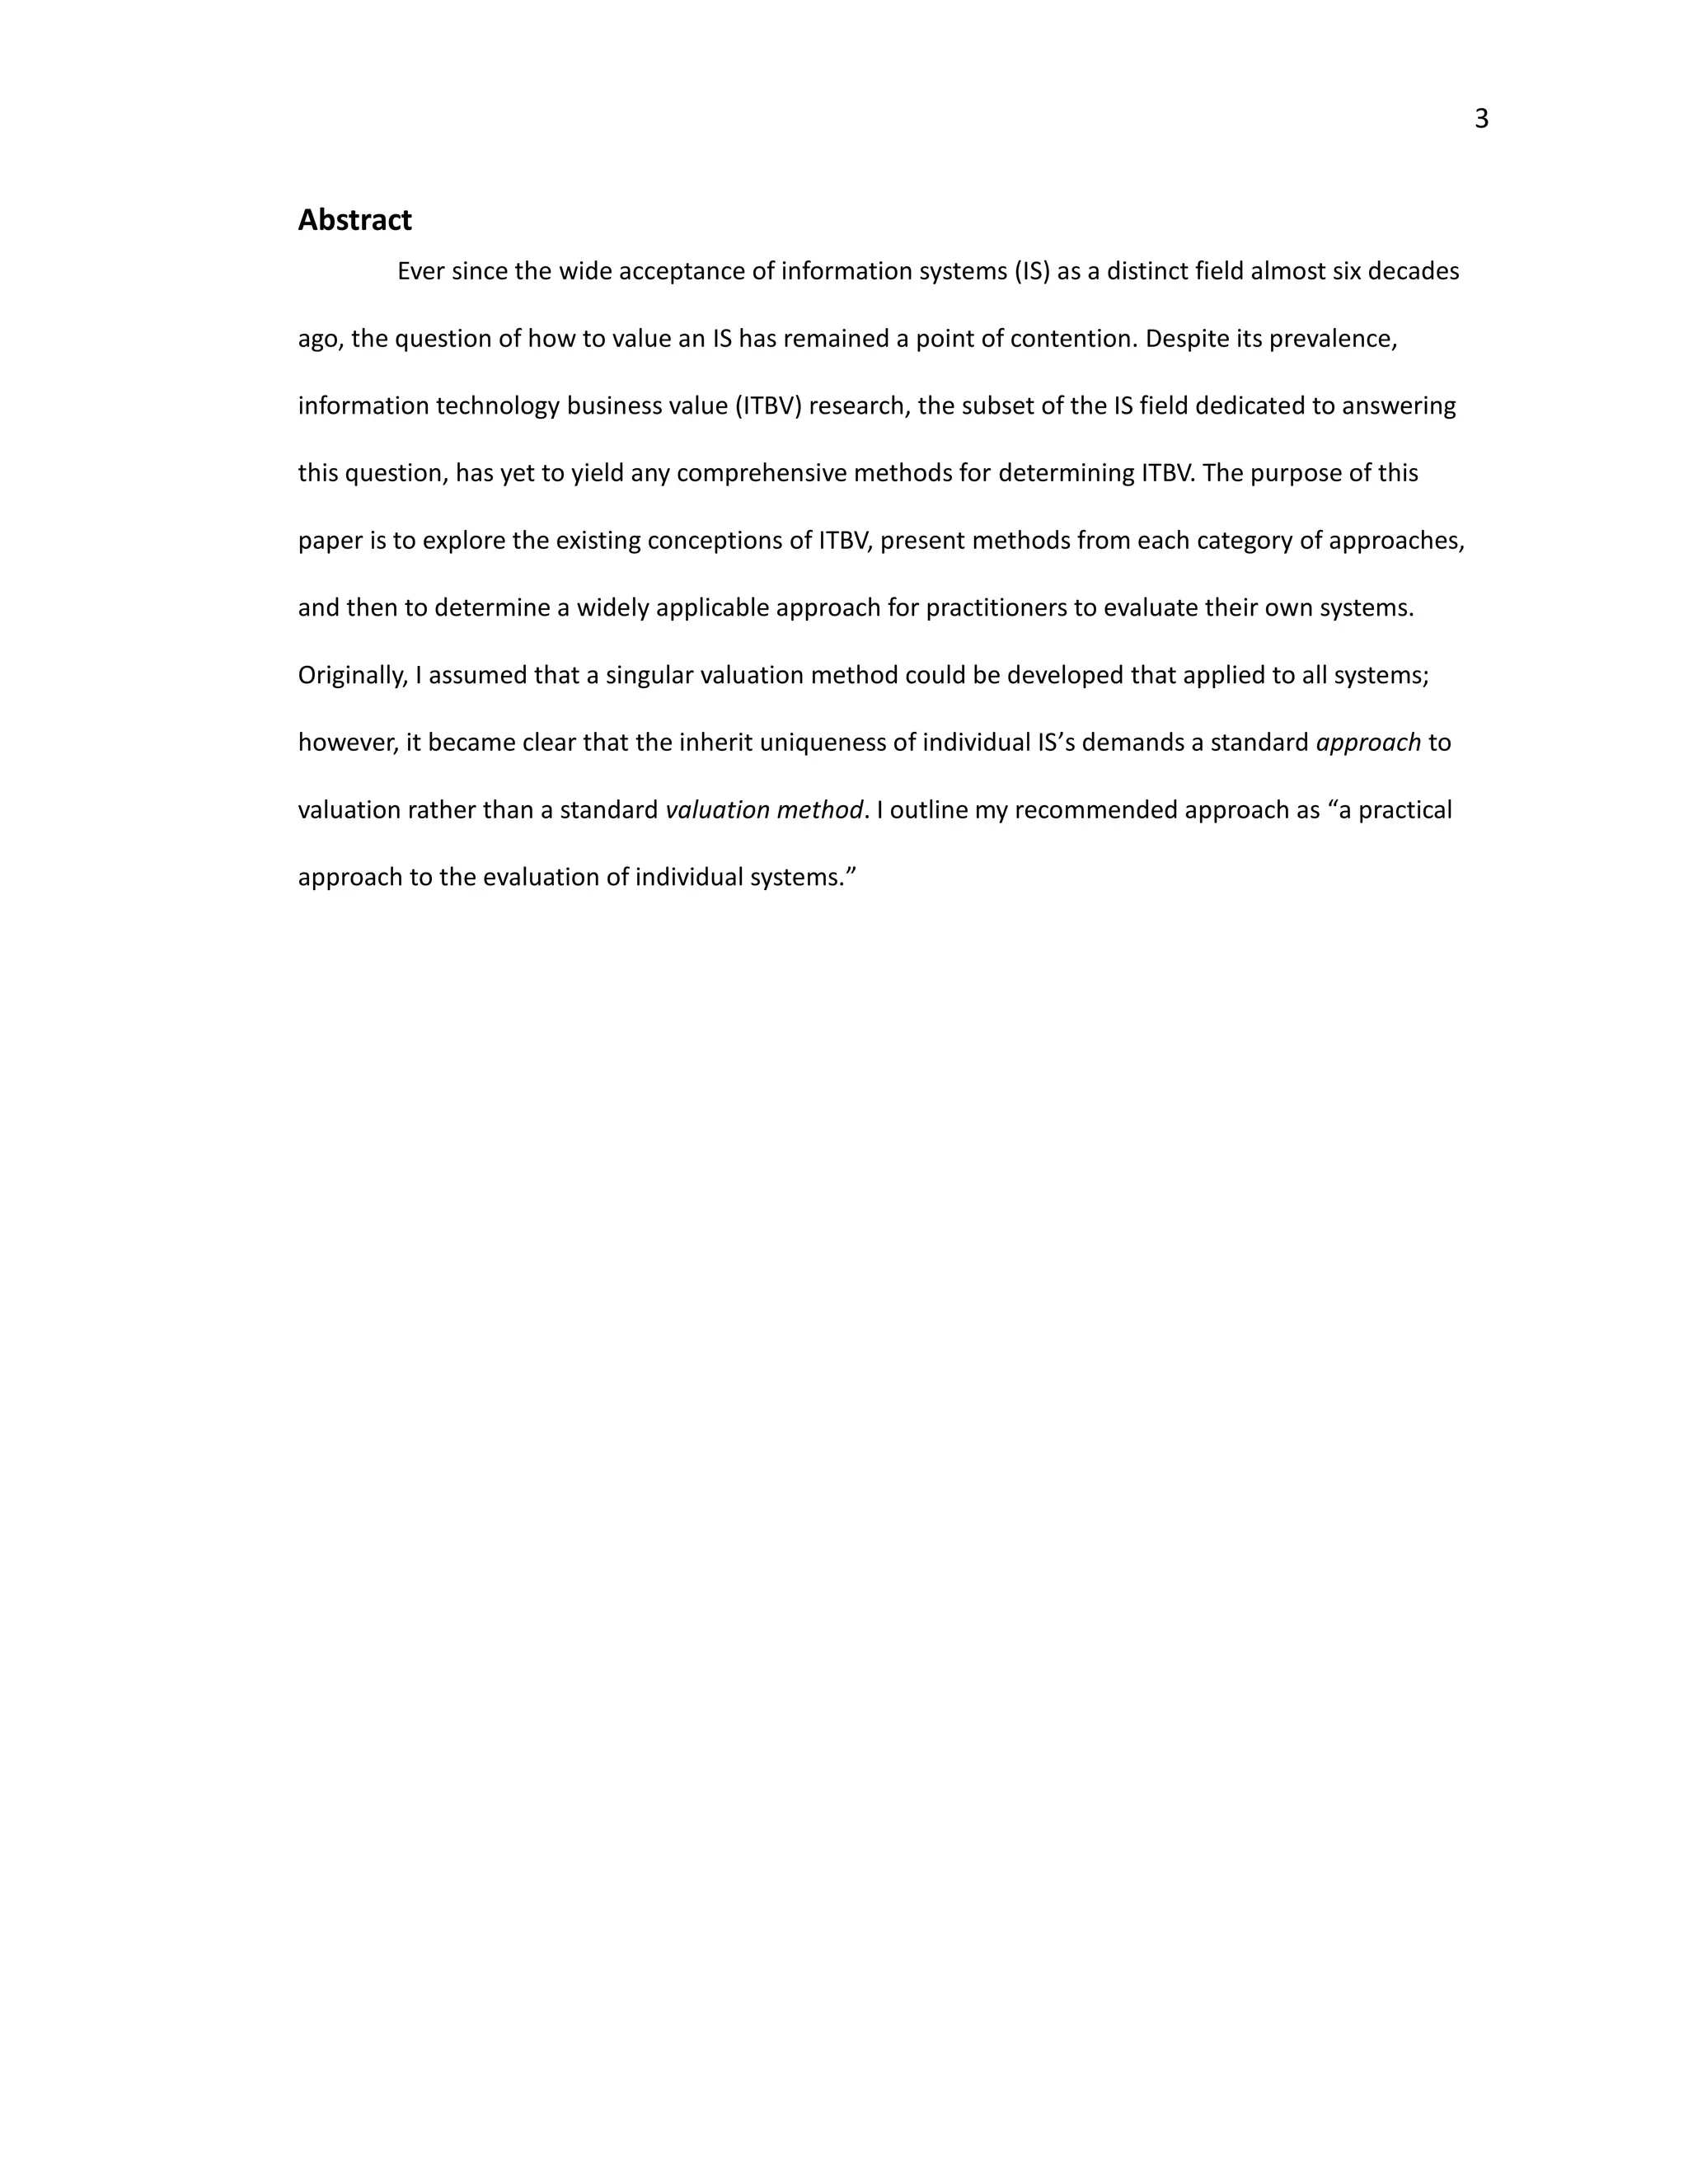
be overstated. Figure 1 – U.S. IT Expenditures, taken and adjusted data from the US Bureau of Economic
Analysis [2] shows the inflation-adjusted levels of IT expenditures from 1960-2014 in terms of 2014
dollars. Using standard linear regression, I calculated a year-over-year $8.21 billion average annual growth
in corporate IT expenditures between 1960 and 1999. While expenditures peaked in 2000 and have yet to
climb back to the maximum $401.8 billion outlay, they remain at an all-time high in the context of IS
history. Furthermore, the current slump seems to have tapered to a consistent ~$300 billion annual IT
outlay. This data underscores the huge role that IT plays in the corporate world and the sometimes
enormous costs associated with it. ITBV research is integral to developing the ability to reliably evaluate
information technology investments which represent large percentages of yearly corporate budgets and
directly affect how and how well a company will operate. The pervasiveness and high costs of IT make
neglecting ITBV a very costly decision. (Graph data presented in Table 1)](https://image.slidesharecdn.com/4c50210b-939f-4c7a-aa9c-2c2e10faf755-160510070431/75/KNISH-EDWARD-Spring2016-4-2048.jpg)
![5
0
50
100
150
200
250
300
350
400
450
1950 1960 1970 1980 1990 2000 2010 2020
Expenditures(Billions)
Year
Inflation Adjusted IT Expenditures
Figure 1 – U.S. IT Expenditures, taken and adjusted data from the US Bureau of
Economic Analysis [2]](https://image.slidesharecdn.com/4c50210b-939f-4c7a-aa9c-2c2e10faf755-160510070431/75/KNISH-EDWARD-Spring2016-5-2048.jpg)
![6
Table 1 National Information Technology Expenditures (In Billions of Dollars)
Raw Data from US BEA [2], Average Annual CPI data from InflationData.com [3]
Year
Information pro-
cessing equipment
Aver-
age
CPI
CPI Ra-
tio
Inflation Adjusted
IT Expenditures
% Annual
Growth
1960 4.7 29.6 8.0 37.6 6.91%
1961 5.1 29.9 7.9 40.4 6.34%
1962 5.5 30.2 7.8 43.1 8.64%
1963 6.1 30.6 7.7 47.2 9.12%
1964 6.8 31.0 7.6 51.9 11.41%
1965 7.8 31.5 7.5 58.6 17.29%
1966 9.7 32.4 7.3 70.9 1.00%
1967 10.1 33.4 7.1 71.6 0.72%
1968 10.6 34.8 6.8 72.1 12.67%
1969 12.8 36.7 6.5 82.6 5.37%
1970 14.3 38.8 6.1 87.3 -0.18%
1971 14.9 40.5 5.8 87.1 7.91%
1972 16.7 41.8 5.7 94.6 10.86%
1973 19.9 44.4 5.3 106.1 4.35%
1974 23.1 49.3 4.8 110.9 -5.92%
1975 23.8 53.8 4.4 104.7 8.47%
1976 27.5 56.9 4.2 114.4 13.09%
1977 33.7 60.6 3.9 131.7 14.28%
1978 42.3 65.2 3.6 153.6 6.36%
1979 50.3 72.6 3.3 164.0 3.07%
1980 58.9 82.4 2.9 169.2 6.64%
1981 69.6 90.9 2.6 181.3 0.42%
1982 74.2 96.5 2.5 182.0 8.50%
1983 83.7 99.6 2.4 198.9 13.72%
1984 101.2 103.9 2.3 230.6 1.68%
1985 106.6 107.6 2.2 234.5 2.27%
1986 111.1 109.6 2.2 240.0 -2.63%
1987 112.2 113.6 2.1 233.8 3.28%
1988 120.8 118.3 2.0 241.7 3.12%
1989 130.7 124.0 1.9 249.5 -6.30%
1990 129.6 130.7 1.8 234.7 -4.53%
1991 129.2 136.2 1.7 224.6 6.01%
1992 141.6 140.3 1.7 238.9 4.56%
1993 152.8 144.5 1.6 250.3 5.82%
1994 166.4 148.2 1.6 265.8 8.84%
1995 187.7 152.4 1.6 291.6 5.23%
1996 203.9 156.9 1.5 307.7 6.26%
1997 222.5 160.5 1.5 328.2 5.61%
1998 239.4 163.0 1.5 347.7 5.38%
1999 258.6 166.6 1.4 367.5 8.56%
2000 292.3 172.2 1.4 401.8 -13.83%
2001 264.1 177.1 1.3 353.0 -14.39%
2002 234.5 179.9 1.3 308.6 -0.47%
2003 238.7 184.0 1.3 307.2 2.19%](https://image.slidesharecdn.com/4c50210b-939f-4c7a-aa9c-2c2e10faf755-160510070431/75/KNISH-EDWARD-Spring2016-6-2048.jpg)
![8
II. Methodology
In the pursuit of an answer to the question of information systems value, this research reviews
current and historical literature regarding information systems evaluation. The purpose of this research is
not to provide a comprehensive review of IT business value methods, rather I explore a sample of
methods correlating to leading categories of IT business value research in order to familiarize readers with
the ideas underlying IS valuation. The intent of this research lies in finding common themes among
researchers in an effort to provide a consolidated approach to IS valuation for current financial and IT
practitioners. I separate these techniques according to their place on the timeline of IS research in order
to show the foundations for these techniques and their evolution. After discussing and reviewing the
literature, I present a widely applicable, practical approach to measuring the business value of an
information system through individual modeling based on the common themes discovered during review. I
begin by defining the terms information and information systems.
III. Defining Terms
Information
Before moving into any models of evaluation for information systems, I need to explicitly define
the terms “information” and “information system.” Although the meaning of the word “information”
differs among scholars depending on their intellectual starting point, a full discussion of epistemology falls
well outside the scope of this paper. Fortunately, “in both the information systems textbooks and the
knowledge management literature, information is defined in terms of data, and is seen to be organized or
structured data” [3, p. 172]. Further consensus indicates that information consists of more than just
organized data and requires that the act of “processing [the data] lends the data relevance for a specific
purpose or context, and thereby makes it meaningful, valuable, useful and relevant” [3, p. 172]. So, when
individual data points undergo meaningful organization and processing through some medium, they
collectively become information. This research will provide very specific definitions for “information” and
“data;” however, on the surface level, this paper concurs with Paige Balztan’s simpler definitions for these](https://image.slidesharecdn.com/4c50210b-939f-4c7a-aa9c-2c2e10faf755-160510070431/75/KNISH-EDWARD-Spring2016-8-2048.jpg)
![9
terms. In essence, “data are facts” and information is “data converted into a meaningful and useful
context” [4].
This conceptualization of information lies in a larger structure informally referred to as the DIKW
(Data, Information, Knowledge, Wisdom) pyramid shown in Figure 2 [5]. In this model, data serves as the
foundation for information, which becomes the foundation for knowledge, which serves as a basis for
wisdom [3, p. 166]. Starting with data (a collection of datum), each additional level of this pyramid arises
from the further organization and contextual analysis of groupings of the level that preceded it. For
example, many datum can be analyzed in tandem to produce a single piece of information and many
pieces of information can be meaningfully organized to create an instance of knowledge.
Chaim Zins reports at length on the varying definitions of data, information, and knowledge in
the context of this DIKW pyramid [5, pp. 486-487]. He provides a useful framework for analyzing these
ideas by starting with the three general types of knowledge defined in classical epistemology: procedural
knowledge, acquaintance knowledge, and propositional knowledge [5, p. 486]. The last of these,
propositional knowledge, “is the reflective and/or the expressed content of what a person thinks that he
or she knows” [5, p. 486]. To explain further, “a proposition is something which can be expressed by a
declarative sentence, and which purports to describe a fact or a state of affairs,” such as a math equation
[7]. In epistemology, the proposition “2 + 3 = 5” becomes propositional knowledge simply by a subject
being able to produce that statement in thought or speech from their internal memory. Propositional
knowledge can be further broken down into two subtypes: inferential and non-inferential propositional
knowledge [5, p. 486].
As Zins explains, “non-inferential propositional knowledge refers to direct intuitive understanding
of phenomena (e.g., ‘This is a true love’)” while “Inferential knowledge is a product of inferences, such as
induction and deduction,” much like the math equation mentioned earlier [5, p. 486]. Because a single
instance of propositional knowledge is merely a declarative sentence known by a subject, propositional
knowledge does not fall under the category of “knowledge” in all: the DIKW hierarchy, Zins’ conception of
information science, and this paper’s approach to a cohesive definition of information and information](https://image.slidesharecdn.com/4c50210b-939f-4c7a-aa9c-2c2e10faf755-160510070431/75/KNISH-EDWARD-Spring2016-9-2048.jpg)
![10
Figure 2 – The DIKW Pyramid [5]](https://image.slidesharecdn.com/4c50210b-939f-4c7a-aa9c-2c2e10faf755-160510070431/75/KNISH-EDWARD-Spring2016-10-2048.jpg)
![11
systems. Instead, I assert that only instances of inferential, propositional knowledge can collectively
belong to the bottom rung of the DIKW framework as data. Accordingly, information in the context of this
paper is defined as the enhanced explanation of real-world phenomena created by the synthesis and
meaningful analysis of a collection of instances of inferential propositional knowledge.
This working definition of information importantly departs from classical epistemology in another
way: the nature of propositions. Classical epistemology holds that “a proposition may be true or false; that
is, it need not actually express a fact” and this conception of a proposition arises from epistemology’s
acceptance of any proposition, regardless of its origin [7]. However, Zins describes two domains from
which data (i.e. propositional knowledge) and information may arise: the subjective domain and the
objective domain [5, p. 486]. Generally, in the information systems field, “data are characterized as
phenomena in the universal domain” [5, p. 488] and I accept this as a necessary part of this paper’s
definition of a proposition, and hence, data. In other words, this discussion of the value of information
systems assumes that the data and its resulting information entered into the system are objectively true.
Example 1A, Financial Analysis: When trying to determine the value of a company’s equity,
financial practitioners oftentimes turn first to the target company’s financial statements. Looking at
hypothetical example Company A’s income statement, a student of finance, John, first sees the line item
“revenue.” So is he looking at a piece of data or information? The answer lies in the composition of this
item. In order for Company A to accurately determine the amount of revenue they collected, individual
pieces of sales data had to be captured. These revenue data points would individually be written as “sold
one Unit X for $Y.” This $Y sale is an instance of true, objective, inferential knowledge with a transaction
processing system likely being the entity that ‘knows’ this fact. On the financial statement being read by
John, the amount corresponding to revenue is the sum total of these data. Consequently, in the
framework of this paper, the line item “revenue” is considered a piece of information because many
pieces of sales data were meaningfully organized in order to create a higher understanding of Company
A’s sales over the period of time covered by the income statement.](https://image.slidesharecdn.com/4c50210b-939f-4c7a-aa9c-2c2e10faf755-160510070431/75/KNISH-EDWARD-Spring2016-11-2048.jpg)
![12
Although it may seem appropriate to expound on the definitions and implications of knowledge
and wisdom in information science following the above discussion on the meaning of data and
information within the DIKW framework, this paper will not address these issues. Indeed, a full analysis of
these items largely lies outside of the scope of this paper but I explore them here briefly. As mentioned
above, knowledge is, at its most basic level, a meaningfully organized grouping of information. However, in
information science it differs significantly from data and information in that “knowledge is characterized as
phenomena in the subjective domain,” rather than in the objective domain [5, p. 488]. Similarly, I define
wisdom as a meaningfully organized grouping of knowledge, although this assertion significantly lacks the
depth required to understand the nature of wisdom.
These intangibles, wisdom and knowledge, do not differ in their construction but rather in the
manner in which the levels preceding them are processed. Some experts view knowledge as “belief
structuring” [3, p. 173] and in her review of the relevant literature, Jennifer Rowley notes that the general
consensus surrounding knowledge is that it is “a mix of information, understanding, capability, experience,
skills and values” [3, p. 174]. As for wisdom, the degree of abstraction and variability in its definitions
brought Robert Sternberg to acknowledge humorously that “the recognition that total understanding [of
wisdom] will always elude us is itself a sign of wisdom” [8, p. 1]. Rowley echoes this difficulty in confirming
that IS literature has paid “limited attention to discussions of the nature of wisdom and how it can be
cultivated in the wider information systems, knowledge management and management literatures” [3, p.
12]. Knowledge and wisdom can be conceptualized as potential, measurable system benefits, but their
exact definitions will not be explicitly defined within this paper. The reason for not defining these terms
lies in the fact that knowledge management systems are not considered in this paper and the IS field has
barely attempted to define wisdom as it applies to information systems.
Information System
With this stipulated definition of information, the idea of an information system becomes more
accessible. In its simplest form, “an information system is a set of interrelated computer components that
collects, processes, stores . . . and provides as output the information needed to complete business tasks”](https://image.slidesharecdn.com/4c50210b-939f-4c7a-aa9c-2c2e10faf755-160510070431/75/KNISH-EDWARD-Spring2016-12-2048.jpg)
![13
and “may include . . . the related manual processes” [9, p. 4]. The uncertain inclusion of “related manual
processes” introduced by “may include” in Satzinger’s definition of an information system underscores the
general debate surrounding the exact nature of information systems and the difficulty of reaching a single
definition. This topic divides researchers into two main schools of thought: one group argues that only the
“IT artifact” and its immediate related processes constitute an information system, whereas the other
group views an information system as a broader system that not only includes the “IT artifact” and its
direct counterparts but also the work systems and end users that it supports [10, p. 186]. In short, the
main source of divergence in the definition of an information system resides in its scope rather than its
function.
Benbasat and Zmud’s narrow definition of an information system serves as a good starting point
to discuss the meaning of information systems in this paper. They argue that the breadth of IS systems
research ought to remain “discipline-specific” and “conceptualize the IT artifact… as the application of IT
to enable or support some task(s) embedded within a structure(s) that itself is embedded within a
context(s)” [10, pp. 184-186]. In their definition, only the managerial practices and capabilities involved in
the creation and use of the IT artifact, the human behaviors “reflected within, and induced” by the
creation and use of these artifacts, and the impact of this usage on the immediate users and organizations
involved with the IT artifact comprise the information system [10, p. 186]. They further emphasize that
“the constructs involved are intimately related to the IT artifact” and state firmly throughout the essay
that anything not directly related to the IT artifact ought not to be researched as an IS discipline [10, p.
186]. This narrow view of an information system is presented in Figure 3 but some experts, such as Steven
Alter [11], argue that this representation is inappropriately restrictive.](https://image.slidesharecdn.com/4c50210b-939f-4c7a-aa9c-2c2e10faf755-160510070431/75/KNISH-EDWARD-Spring2016-13-2048.jpg)
![14
Figure 3 [10, p. 187]](https://image.slidesharecdn.com/4c50210b-939f-4c7a-aa9c-2c2e10faf755-160510070431/75/KNISH-EDWARD-Spring2016-14-2048.jpg)
![15
As opposed to examining an information system as an IT artifact and its direct users and
consequences, Steven Alter contends that an information system is merely a specific type of work system
[11, p. 95]. His “work system method” defines a standard work system as “a system in which human
participants and/or machines perform business processes using information, technologies, and other
resources to produce products and/or services for internal or external customers” [11, p. 92]. In this view,
the information system and its larger work system are inextricable from one another, meaning that an
information system’s success cannot be determined without first analyzing the broader work system [11,
p. 97]. Alter shows that a work system (Figure 4) encompasses the participants, information, technologies,
business processes, products & services, infrastructure, environment, and strategies that drive and affect
the work being done [11, p. 93]. These two approaches to information systems, the IT artifact centered
view and the work system view, differ in their scope and are the main source of contention among IS
researchers.
In this paper, I approach an information system in an even narrower context than either Benbasat
and Zmud, or Alter. This paper concurs with MIT’s Wil Van Der Alast and Chritian Stahl in their distillation
of both of these views. They define an information system as “a software system to capture, transmit,
store, retrieve, manipulate, or display information, thereby supporting people, organizations, or other
software systems” [12, p. 4]. This definition combines the idea of an IT artifact (software), applies it to
Alter’s six information system business process activities [11, p. 96] and limits the scope of an information
system to precisely that and nothing more. However, a slight problem exists with Alast and Stahl’s
information systems definition in that they do “not require the existence of a business process” within
which an information system operates [12, p. 4] whereas this paper requires at least one. Note that in this
perspective, “a business process consists of a set of activities that is performed in an organizational and
technical environment” and that “these activities are coordinated to jointly realize a business goal” [12, p.
4].](https://image.slidesharecdn.com/4c50210b-939f-4c7a-aa9c-2c2e10faf755-160510070431/75/KNISH-EDWARD-Spring2016-15-2048.jpg)
![16
Figure 4 [11, p. 93]](https://image.slidesharecdn.com/4c50210b-939f-4c7a-aa9c-2c2e10faf755-160510070431/75/KNISH-EDWARD-Spring2016-16-2048.jpg)
![17
In not requiring an information system either to support an existing business process or create a
new one in which to exist, Alast and Stahl allow for something as simple as a “text editor” to fall under this
definition [12, p. 4]. Interestingly, this simplicity forces their definition to be unnecessarily broad and
include systems that do not add distinguishable, intrinsic monetary value to an entity when viewed in
isolation.
To better explain why business processes cannot be excluded from an information system, I must
emphasize that this paper combines the disciplines of both finance and information science. From a
financial perspective, it is impossible to perform meaningful analysis of a system that does not affect an
entity’s monetary position or indicators in an observable manner. Significantly, finance relies on concrete
information such as net income or total assets and attempts to make informed decisions based on the
manipulation and study of these and other metrics. If a new system does not have the ability to affect
these types of input in a meaningful way, then a financial analysis of the system is a fruitless endeavor.
Thus I depart slightly from Alast and Stahl and require that in order to be considered an information
system, the software system must perform activities within one or more business processes. Finally, it is
important to note that this paper deals exclusively with systems that aid businesses, nothing else. Within
this framework, I stipulate my definition:
Information System: a software system that captures, transmits, stores, retrieves, manipulates, or
displays meaningfully organized instances of inferential propositional knowledge in order to support one or
more business processes within an organization.
So defined, this paper's scope enlarges to cover some of the original, historical methods used to
ascribe value to information systems.](https://image.slidesharecdn.com/4c50210b-939f-4c7a-aa9c-2c2e10faf755-160510070431/75/KNISH-EDWARD-Spring2016-17-2048.jpg)
![18
IV. Historical Valuation Methods
Introduction
Unlike other long-standing academic disciplines with centuries of study and discussion,
information technology and IT business value research can only trace their origins back to around the
early 1960’s [13, p. 194]. Owing to the nascent nature of these fields, when this paper expounds on
“historical valuation methods,” it refers to the valuation methods described by information systems
researchers before the late 1990’s. The cutoff point coincides with the beginning of Hirschheim and Klein’s
“fourth era” [13, p. 196] of the information systems field. The reason this paper separates IT business
value research into “historical” methods from before the late 1990’s and “current” (post-late-1990’s)
methods arises from the differences in the technologies, information depth, and intellectual approaches
used during these two periods. This section briefly focuses on these differences and their significance to
this research.
The information systems eras described by Hirschheim and Klein differ according to each era’s
information technology in use, depth of information describing the field, and the intellectual approaches
to the field as a whole. The relative newness of modern information technology created the information
depth disparities among these time periods. Over the last five decades, as the field grew in relevance, so
too did its body of information and research. The technology in use also differs dramatically among eras.
Indeed, “mainframes were the dominant computers used in organizations” [13, p. 197] during the first era
(mid 1960’s to mid 1970’s) but continuous technological evolution caused by rapid innovation culminated
in the present day, fourth era, where “laptop computers, netbooks, mobile phones, tablets” [13, p. 214]
permeate corporate structures and information systems. This combination of ever-increasing information
depth and evolving technology produced different approaches to information systems and their proper
evaluation in each era [13, p. 195]. This paper condenses the first three eras into one “historic era” and
collectively analyzes their respective methods of valuation in order to provide the proper foundations and
context for the discussion of current IT business valuation methods.](https://image.slidesharecdn.com/4c50210b-939f-4c7a-aa9c-2c2e10faf755-160510070431/75/KNISH-EDWARD-Spring2016-18-2048.jpg)
![19
This paper’s separation of IS financial analyses into “historical” and “current” methods does not
indicate that the eras described by Hirschheim and Klein have clear definition. Instead, Hirschheim and
Klein emphasize that these eras “do not have well defined boundaries” and they view “these eras as
development periods of the field . . . complexity-reducing structure[s] or simplifying vehicle[s] that
attempt to organize what would otherwise be a stream of consciousness exercise” [13, p. 194].
Accordingly, this research places little emphasis on the exact timing of the historical methods under
review. Rather, it describes them within the context of where they fall in the evolution of thought about
and the availability of information to the IS field. Examining this timeline of the information systems field
reveals a few prominent trends in the manner in which researchers analyze and define information
systems and their values. These trends include the shift from theoretical to practical approaches, the
increasing emphasis on quantitative rather than just qualitative analysis, and the growth in consensus that
information systems create value for firms. This last trend has led researchers to study how valuable a
system is rather than whether or not it is valuable in the first place.
This section further breaks out these historical methods into three distinct, yet sometimes
overlapping, categories according to the bases they use to measure the value of information systems. The
three broad categories of historical information system valuation include qualitative valuation methods,
economic valuation methods, and financial valuation methods. These categories all crucially contribute to
precise information systems value measures: one category cannot exhaustively capture the extent of the
costs and benefits associated with an individual IS. This distinction is important because although the
overarching goal of this paper is to provide financial practitioners with a means of determining the
intrinsic value of an IS, qualitative traits, not normally considered valid inputs for finance-based value
computation, are inextricable from the valuation of an IS. The introduction to the qualitative valuation
section later will cover in-depth the reasons for the necessary inclusion of qualitative traits in these
methods.](https://image.slidesharecdn.com/4c50210b-939f-4c7a-aa9c-2c2e10faf755-160510070431/75/KNISH-EDWARD-Spring2016-19-2048.jpg)
![20
Further, two stipulations are warranted at this point. First, the valuation methods described often
do not define “value” in the exact same way as their counterparts. To address this issue, this paper will
explain the different meanings of value as the models are discussed. Second, this review of historical
valuation methods is not in any way exhaustive. Rather, since its purpose lies in introducing the larger
foundations for current valuation methods, this review covers the broader theoretical approaches to
valuation and provides distinct examples of some of the methods inspired by these theoretical
approaches. Now, knowing that each category of IS valuation studied here will remain important to
proper intrinsic valuation and that their individual conceptions of value often differ, the focus shifts to the
historical models themselves, starting with qualitative methods.
Qualitative Valuation
The indivisibility of qualitative traits from a precise IS valuation approach stems from the nature
and role of information systems. Imagine a simple physical machine that accepts raw materials A and B
and transforms them into finished product C. An analyst can easily calculate this machine’s value as the
difference between the value, in dollars, it creates per period and the costs associated with the machine’s
creation and maintenance. In other words, it has direct, measurable costs that one can match with direct,
measurable benefits. In contrast, “IT creates impacts at several levels in the organization, and some only
indirectly contribute to profitability” [14]. Thus, the “intangible costs and especially benefits of
information systems are difficult to recognize and to convert to their monetary equivalent,” [15] a
complexity that drives the need for and applicability of non-financial value measures. The following
qualitative methods approach the idea of IS value in two general ways: IS’s as creators of organizational
value and IS value as a function of user and managerial utility.
Organizational Value
One of the largest contributors to the study of organizational value is Michael E. Porter, whom
many may recognize as the creator of Porter’s five forces. In his book, Competitive Advantage: Creating
and Sustaining Superior Performance, Porter explores how, under certain conditions, the proper use of
technology and information may provide individual companies with competitive advantage [16, pp. 164-](https://image.slidesharecdn.com/4c50210b-939f-4c7a-aa9c-2c2e10faf755-160510070431/75/KNISH-EDWARD-Spring2016-20-2048.jpg)
![21
200]. He explains that “technology is embodied in every value activity in a firm, and technological change
can affect competition through its impact on virtually any activity” [16, p. 166]. While it is possible to
measure the broad idea of competitive advantage in certain situations, oftentimes, managers and
companies cannot adequately define the monetary benefits or even say with certainty that a collection of
strategies will produce competitive advantage. Extending the organizational value of IT beyond just
competitive advantage, in their July 1985 Article, “How Information Gives You Competitive Advantage,”
Porter and Millar add that IT also provides organizational value in that it “changes industry structure and,
in so doing, alters the rules of competition” and “spawns whole new businesses, often from within a
company’s existing operations” [17]. These ideas form the foundation of the organizational value of IT.
While writers such as Porter and Millar provide a solid foundation for examining the firm effects
of an IS, the benefits they describe remain broad, highly theoretical, and difficult to measure. Eric K.
Clemons takes these ideas a step further while outlining his seven lessons for valuing an information
system. His article, “Evaluation of Strategic Investments in Information Technology” provides a few ways to
explain and qualify IT-driven, competitive advantage gains and risks. The first method of qualitative
evaluation mentioned by Clemons involves judging the value of an IS based on the analysis of probable,
descriptive outcomes of selling the information system at hand [18, pp. 26-28]. As a mode of evaluation,
Clemons proposes developing a probabilistic decision tree in which each outcome is measured in terms of
how relatively affected the broad financial categories of the company will be if the outcome is realized [18,
pp. 26, 28].
He notes that in the case of Merrill Lynch’s decision of whether to sell Bloomberg software,
“determining the NPV [for each possible outcome] require[d] at least fourteen estimates: four
probabilities, four estimates of $soft, and three estimates of $margin, and $comp” and that “it is virtually
impossible to get an accurate prediction for any of these numbers” [18, p. 27]. So instead of using
quantitative methods to produce educated, yet unreliable, dollar figures for the impacts that the sale of
Bloomberg may have had on the value of “Merrill’s partial ownership of Bloomberg” ($soft), Merrill’s
profit margin ($margin), and Merrill’s “potential loss in trading income” ($comp), Clemons merely set the](https://image.slidesharecdn.com/4c50210b-939f-4c7a-aa9c-2c2e10faf755-160510070431/75/KNISH-EDWARD-Spring2016-21-2048.jpg)
![22
level and direction of these figures under each possible outcome [18, p. 27]. This method produces useful,
qualitative values for traditionally quantitative measures and allows an analyst to determine an IS’s value
when faced with uncertain financial or economic outcomes.
Clemons recommends an additional way to approach the value of an information system by first
describing what he calls “the trap of the vanishing status quo” [18, p. 27]. This trap occurs when
“executives spend too little time considering the alternative to undertaking a strategic venture” [18, p. 27].
In Clemons’ context, managers oftentimes fail to realize that the initiatives of their competitors can and do
change the competitive environment as a whole [18, p. 35]. He shows that when an industry’s
environment is changing at a pace that upsets the core of the industry, “rapid and flexible organizational
response becomes essential” and that while “the value of an architectural investment to obtain this
flexibility is difficult to express quantitatively, it can be explained as buying an option that may be
necessary to ensure the firm's survival” [18, p. 32]. Under these relatively common circumstances, an
information system becomes a “strategic necessity” [18, p. 32] whose most accurate and important value
requires little derivation: must buy. Clemons’ synthesis of Porter and Millar’s broad IS organizational value
measures into a means to derive finance-specific and strategic qualitative values lends a lot of power to
valuing an IS in terms of its value as a potential organizational weapon.
User and Managerial Value
While information systems certainly possess a large degree of potential organizational value,
examining the organization as a whole without recognizing it as the sum of many human parts can lead
managers to incomplete and possibly erroneous analyses. As Pearson and Bailey note, “it has been argued
that user satisfaction is correlated to information system utilization and systems success” by many
information systems researchers [19, p. 530]. While some of the studies cited by Bailey and Pearson may
not have effectively controlled for external variables in reaching this assertion, this paper accepts that user
and management attitudes serve as acceptable proxy measurements of system usefulness. Adding to this,
a system’s value logically cannot be uncorrelated from its usefulness to the organization it serves.
Ultimately, the way users and management interact with the system can indirectly indicate the system’s](https://image.slidesharecdn.com/4c50210b-939f-4c7a-aa9c-2c2e10faf755-160510070431/75/KNISH-EDWARD-Spring2016-22-2048.jpg)
![23
overall value. This section explores two different methods of measuring system value through its utility to
the people that interact with it: Ahituv’s problem-specific efficiency frontier and Pearson and Bailey’s user
satisfaction measures.
The main difference between Ahituv’s efficient frontier method of measuring system usefulness
and Pearson and Bailey’s method emerges from the timing and content of their respective questionnaires.
The efficient frontier method starts by having management decide on attributes that the ideal system
must have and then acquiring price proposals for suitable systems [20, p. 71]. Next, each decision maker
reviews all of the relevant system proposals and provides a non-exclusive, qualitative rank for each of the
aforementioned attributes for each individual system. In the example provided by Ahituv, for all the
proposed systems, each analyst provided a score of “Superior (S),” “Average (A),” or “Inferior (I)” for six
predetermined attributes [20, p. 71]. To make these scores meaningful, “The ‘linearity’ approach was then
used to rank order the various proposals, by associating three points for ‘S,’ two points for ‘A,’ and one
point for ‘I’” [20, p. 71]. Each system then received an overall qualitative score by multiplying the number
of occurrences of each S, A, or I score they received by the number of points assigned to the respective S,
A, and I scores. Finally, as seen in Figure 5, these individual system scores were plotted on a graph with
“Price,” on the x-axis and “Quality” on the y-axis. A line drawn through each system that corresponds to
the optimal quality/price mixtures represents an “efficient frontier” and “each proposed system which
does not belong to the efficient frontier can be eliminated” [20, p. 71]. Analysts can apply this simple
qualitative method to any number of proposed systems in order to arrive at a system value measured by
appropriate fit.
In contrast to Ahituv’s approach of measuring system utility by the level of attribute quality and
price, Pearson and Bailey focus purely on user attitudes toward a specific information system. Their paper,
“Development of a Tool for Measuring and Analyzing Computer User Satisfaction,” defines satisfaction as
“the sum of the user's weighted reactions to a set of factors” given by the equation “ 𝑆𝑖 = ∑ 𝑅𝑖𝑗 𝑊𝑖𝑗
𝑛
𝑗=1
where Rij = The reaction to factor j by individual i [and] Wij = The importance of factor j to individual i”
[19, p. 531]. In order to define j, or a complete list of important IS factors, the authors compiled](https://image.slidesharecdn.com/4c50210b-939f-4c7a-aa9c-2c2e10faf755-160510070431/75/KNISH-EDWARD-Spring2016-23-2048.jpg)
![24
Figure 5 [20, p. 72]](https://image.slidesharecdn.com/4c50210b-939f-4c7a-aa9c-2c2e10faf755-160510070431/75/KNISH-EDWARD-Spring2016-24-2048.jpg)
![25
suggestions by reviewing 22 different IS satisfaction studies [19, p. 531]. After interviewing data
technicians and performing rigorous statistical analysis, Pearson and Bailey managed to produce a list of
39 statistically important IS user satisfaction attributes shown in Table 2 [19, pp. 531-533].
Because their model depends on user input, Pearson and Bailey decided to use questionnaires as
a means of measuring users’ reactions to each factor (Rij). Wanting to ensure that the measurement scale
used on the questionnaires accurately captured Rij, the researchers used the “semantic differential
technique” in formatting acceptable responses to each factor [19, p. 533]. In short, “the Semantic
Differential (SD) measures people's reactions to stimulus words and concepts in terms of ratings on
bipolar scales defined with contrasting adjectives at each end” [21]. An everyday example of the SD
technique would be a survey asking someone to rate their experience at a restaurant. One of the line
items on the survey might read “customer service” and allow the respondent to mark either bad, below
average, fair, good, or exceptional as a response. This range of values corresponding to the levels of the
bipolar adjectives bad and exceptional represents a semantic differential. On the questionnaire, Pearson
and Bailey provided six different SD scales for each attribute; four of these fully measured user perception
of the attribute and the other two served as satisfaction and relative importance measures [19, pp. 533-
534].
Each SD scale in this questionnaire had seven intervals ranging from very negative, to neutral, to
very positive. Starting from the very negative end of the scale and in order of increasing positivity, Pearson
and Bailey assigned the values -3, -2, -1, 0, 1, 2 and 3 to each interval as a means of quantifying Rij [19, p.
534]. The only scale that did not use these values was the importance scale whose beginning value was
0.10 and increased in increments of 0.15 up to 1 for the seventh interval [19, p. 534]. Having quantified all
relevant factors, users completed their questionnaires and the overall satisfaction for the user was defined
by the equation: 𝑆𝑖 = ∑
𝑊𝑖𝑗
4
∗ ∑ 𝐼𝑖,𝑗,𝑘
4
𝑘=1
39
𝑗=1 where the additional factor, “Ii,j,k = the numeric
response of user i to adjective pair k of factor j” [19, p. 534]. In their paper, Pearson and Bailey provide a
method of ‘normalizing’ these scores so that they fall on a scale between -1 and 1 [19, p. 534]. This ending](https://image.slidesharecdn.com/4c50210b-939f-4c7a-aa9c-2c2e10faf755-160510070431/75/KNISH-EDWARD-Spring2016-25-2048.jpg)
![26
Table 2 - Pearson and Bailey’s 39 Factors [19, p. 532]
Flexibility Communication with the EDP Staff
Accuracy Relationship with the EDP staff
Timeliness Understanding of Systems
Reliability Degree of Training
Completeness Job Effects
Confidence in Systems Top Management Involvement
Relevancy Feeling of Control
Precision Schedule of Products and Services
Technical Competence of EDP Staff Format of Output
Currency Mode of Interface
Priorities Determination Security of Data
Error Recovery Expectations
Response / Turnaround Time Organizational Position of the EDP Function
Convenience of Access Volume of Output
Attitude of the EDP staff Language
Time Required for New Development Charge-Back Method of Payment for
Services
Perceived Utility Organizational Competition with the EDP
Unit
Documentation Vendor Support
Feeling of Participation Integration of the System
Processing of Change Requests](https://image.slidesharecdn.com/4c50210b-939f-4c7a-aa9c-2c2e10faf755-160510070431/75/KNISH-EDWARD-Spring2016-26-2048.jpg)
![27
score represents another qualitative value measure for an IS. However, rather than measuring the
appropriate fit of the system as Ahituv’s method allows, this score enables analysts to determine the value
of an IS in terms of whether the system is a burden or an asset. According to Pearson and Bailey, negative
scores represent levels of dissatisfaction, zero represents indifference, and positive scores represent levels
of satisfaction [19, p. 535]. This paper interprets these numbers so that a system whose score is negative
can be valued as a burden and a system whose score is positive can be valued as an asset.
Qualitative Valuation: Summary Observations
Although historical qualitative IS valuation techniques may not produce values that contain the
evaluative rigor generally demanded by financial analysts, any IS valuation procedure that ignores or fails
to capture the intangible effects of an IS similarly lacks thoroughness. Many times, qualitative approaches
provide the only way to reliably measure these intangible effects and hence ought to be included in any
comprehensive approach to the evaluation of an information system. These approaches can be roughly
split between measuring IS organizational value and measuring IS human value.
This paper has examined some of the values that can be discerned from this type of approach by
setting the value of an IS as competitively advantageous/disadvantageous, strategically necessary,
valuable considering all alternatives, appropriately fit, and/or useful. Some of the measurement units
discussed include qualitative levels of financial indicators [18, p. 27], descriptive market characteristics
[18, p. 32], position on efficiency frontiers [20, p. 71], and normalized satisfaction scores [19, p. 534].
DeLone and McLean provide an exhaustive review of many historical qualitative measures in their study
“Information Systems Success: The Quest for the Dependent Variable” and further separate these
methods into six dimensions of success: “System Quality, Information Quality, Use, User Satisfaction,
Individual Impact, and Organizational Impact” [22, p. 60]. These categories all have extensive literature
and a wealth of different models but an immersive, comprehensive review of each model falls well outside
the scope of this paper. Having reviewed the extent, purpose, importance, and range of historical
qualitative valuation methods, this paper pivots to the examination of historical economic IS valuation
methods.](https://image.slidesharecdn.com/4c50210b-939f-4c7a-aa9c-2c2e10faf755-160510070431/75/KNISH-EDWARD-Spring2016-27-2048.jpg)
![28
Economic Valuation
In contrast to qualitative information system values such as strategic necessity and usefulness
that provide actionable insight to business managers, the economic values of an IS tend to pinpoint the
sources of IS value rather than supply prescriptive or quantifiable measurements. In essence, “the
underlying discipline for the concept of ‘business value’ is economics [because] business value subsumes
goal attainment, relative scarcity (or effort) and economic worth” [23, p. 2]. In other words, the benefits
and costs of an IS described by categorically different (non-economic) measures are simply concrete
measurements of the same underlying economic value created by an information system. This assertion
does not imply that analysts cannot or should not use economic value measures in final system evaluation
or decision-making because, depending on the type and depth of information available, economic
valuation may indeed produce powerful and precise measurements. Rather, the conception of economic
value as the common source of all other value measures illustrates the possibility of overstating total
system value when using a combination of economic and other classes of value. For instance, imagine an
analyst who performs both an economic calculation that shows increasing productivity and then performs
a financial calculation that shows decreasing labor-intensity. If he or she decided to label these calculated
gains as separate indicators of value, both the analyst and management would be misled because
decreasing labor intensity is likely just a different measurement of economic productivity gains. The
valuation would lose its precision since the same value would be counted twice by different measures.
While economic IS valuation may, in certain cases, prove to be the most prudent technique for
overall system valuation, this paper prefers to treat these historical methods as theoretical, yet
empirically-analyzed explanations of how an information system creates value. The following section
begins by addressing some of the unique economic features of information systems. The discussion then
turns to a few theories regarding the way in which information systems may create economic value for
individual firms based on items such as production economics and transaction cost theory. Finally, the
difficulties associated with developing concrete economic valuation models are explored and qualified. As](https://image.slidesharecdn.com/4c50210b-939f-4c7a-aa9c-2c2e10faf755-160510070431/75/KNISH-EDWARD-Spring2016-28-2048.jpg)
![29
this analysis will show, economic examination of information system value often creates more problems
than it solves.
Distinct Economic Features of Information Systems
As an economic entity, an information system falls under the broad category of “capital
investments” [24, p. 386]. In their article, “Recent Applications of Economic Theory in Information
Technology Research” Bakos and Kermerer perform a massive review and categorization of all economics-
based IT research performed up through 1991 [24, p. 385]. They begin their analysis by first defining five
economic characteristics common to all IT investments [24, p. 388]. These characteristics provide IT with a
uniqueness that this paper accepts as one of the root difficulties associated with economic IT valuation.
The first characteristic of information systems is that they “typically require large capital investments and
they offer substantial economies of scale and scope” [24, p. 387]. This refers to the large initial costs of an
IS that drive relatively tiny post-implementation marginal investments to use and extend the system (an
economy of scale). The economies of scope mentioned by Bakos and Kermerer arise from the extensibility
of the technological and organizational assets provided by an IS [24, p. 387].
While economies of scale and economies of scope never lose their desirability from the
perspective of the firm who achieves them, the remaining four distinctive economic characteristics of IT
seem almost to overshadow these advantages. For instance, the second characteristic where “the benefits
realized by individual users of information technology increase as more users adopt compatible systems”
can benefit certain firms by conferring “first mover advantages [to] technology vendors” [24, p. 387].
However, the broader effect of this situation springs from the fact that IS’s in this sense generate “network
externalities” [24, p. 387] that add multiple layers of complexity to the effective economic measurement
and management of an IS. The third characteristic of IT, that “potential adopters of information technology
face substantial uncertainty regarding the actual benefits of this technology,” often causes delays in IT
adoption, which translates to lost economic value if the system itself is valuable despite the uncertainties
[24, p. 387]. The last two unique economic characteristics of IS’s, that they “can impose significant
switching costs on their participants” [24, p. 387] and “reduce customers’ costs of obtaining information”](https://image.slidesharecdn.com/4c50210b-939f-4c7a-aa9c-2c2e10faf755-160510070431/75/KNISH-EDWARD-Spring2016-29-2048.jpg)
![30
do not bode well for the firm implementing the IS. High switching costs can cause economic inefficiencies
and a lower cost of information to consumers erodes firm pricing power. Given this seemingly negative set
of traits that distinguishes information systems from most other capital investments, this research now
explores the question of how an IS can possibly create economic value.
Sources of Economic Value
IT economic value research found its humble beginnings at the intersection of the rapid increase
in information systems expenditures in 1970-1980 and the theory of production economics. As the field of
information systems became more accepted and refined, researchers began trying to determine the actual
level of returns promised by the IT revolution [13, p. 209]. Traditional thinking prompted many researchers
to approach IT value through the theory of production which “posits that firms possess a method for
transforming various inputs into output, represented by a production function” [25, p. 123]. By producing
a general model of the specific production function, “it is possible to econometrically estimate the
contribution of each input to total output in terms of the gross marginal product” [25, p. 123]. Kauffman
and Kriebel provide an excellent illustration (Figure 6) of how to carry out economic production analysis by
measuring efficiency [23, p. 5].
According to Kauffman and Kirebel, Figure 6 “is an abstract and oversimplified characterization of
a production process; it depicts physical output (production) in terms of two required inputs to the
process” [23, p. 4]. This analysis holds output constant where points A, B, and C all denote the same level
of output and the curve (X-X’) “represents possible tradeoffs between the two inputs to produce the same
level of output with the known production technology” [23, p. 4]. Lastly, the line (a-b) represents the
production costs associated with the various mixes of input levels [23, p. 5]. Point B represents the most
efficient mix of inputs as this is the point where both cost and inputs required are minimized [23, p. 5].
Point C, on the other hand, denotes a very inefficient use of resources given the output level [23, p. 5].
Information systems researchers began analyzing IT in this manner as an input into production processes
because theory held that this was the best way to empirically see the benefits associated with IS usage.](https://image.slidesharecdn.com/4c50210b-939f-4c7a-aa9c-2c2e10faf755-160510070431/75/KNISH-EDWARD-Spring2016-30-2048.jpg)
![31
Figure 6 - [23, p. 5]](https://image.slidesharecdn.com/4c50210b-939f-4c7a-aa9c-2c2e10faf755-160510070431/75/KNISH-EDWARD-Spring2016-31-2048.jpg)
![32
To the surprise of many, “the majority of studies in this area report[ed] little or no impact of IT on
firm performance” [26, p. 137]. This situation, that “business organizations demonstrate ever higher levels
of investment in IT in the absence of measured productivity gains,” has become a highly contested issue in
the IS field widely known as the “productivity paradox” [27, p. 18]. While the vast majority of studies
conducted in the 1980’s found little or negative IT-driven productivity impacts, after adjusting their
models, some researchers in the late 1980’s and early 1990’s began observing positive IT productivity
gains [28, p. 4]. The debate over the productivity paradox remains unresolved to this day. Owing to the
continued inconclusiveness of empirical evidence regarding IT’s impact on economic productivity, this
research accepts that IT may possibly contribute to economic productivity but defers judgment to future
research.
While productivity measures have certainly taken center stage in the debate over the economic
value of an IS, this paper explains two other possible sources of IT economic value: organizational
flexibility and cooperation incentives. Simply put, organizational flexibility refers to “the ability [of an
organization] to adapt to change and respond quickly to market forces and uncertainty in its environment
[29, p. 2]. Lucas and Olson explain that IT, by “changing boundaries on where tasks are accomplished . . .
removing constraints on when tasks are performed . . . speed[ing] up the processing of information . . .
[and] enable[ing] the firm to respond quickly to changing market conditions” profoundly alters the
flexibility of an organization [29, pp. 3-4]. Donald Sull, who uses the term “operational agility” instead of
organizational flexibility, explains that the economic benefit of increasing flexibility lies in the
organization’s increased ability to act on market opportunities and establish market share early [30]. This
theoretically increases potential demand for the organization and represents another area of economic
value that a non-economic IS valuation method may unintentionally capture.
In addition to its potential effect on productivity and flexibility, information technology also
encourages inter-business cooperation. The basis of this theory lies in transaction cost economics which,
as a discipline, “investigates how interactions among economic activities are organized, explicitly
recognizing the costs of managing the interaction” [31, p. 10]. In order to explain how IT can encourage](https://image.slidesharecdn.com/4c50210b-939f-4c7a-aa9c-2c2e10faf755-160510070431/75/KNISH-EDWARD-Spring2016-32-2048.jpg)
![33
cooperation, Clemons and Row define transaction costs as the product of coordination costs, or “the
direct costs of integrating decisions between economic activities,” and transaction risk, “the cost
associated with the exposure to being exploited in [an economic] relationship” [31, p. 11]. They point out
that while IT certainly reduces coordination costs [31, p. 18], “a reduction in unit coordination costs will
not lead to an increase in explicit coordination if transaction risk is increased proportionately” [31, p. 11].
IT separates itself from other economic assets because in addition to reducing the explicit costs
of coordination, it also “reduce[s] the level of transaction-specificity in investments in explicit
coordination. . . reduce[s] the costs of performance monitoring, and provide[s] information needed to
structure more incentive-compatible reward mechanisms” [31, p. 26]. These effects, in turn, lower the
overall risk associated with inter-organizational cooperation and when combined with lower explicit
transaction costs, ultimately erode barriers to cooperation. This IT-driven increase in cooperation creates
economic value by improving resource utilization and exposing the company to previously unserved
markets. The three possible sources of IT economic value mentioned in this section: productivity
increases, gains in organizational flexibility, and cooperation incentives provide a strong introduction to
how IT may serve the economic interests of a firm. However, they fall short of representing a
comprehensive review of IT economic research and in the absence of consensus among researchers
regarding exactly how IT creates economic value, this paper moves on to how IT, as an economic entity,
often escapes explicit valuation.
Quantitative Economic Value Measures
As is the common theme for IT business value research, the rich theoretical background that
supports the idea that IT creates economic value fails to produce any direct quantitative methods of
measuring this value. In his paper, “The Productivity Paradox of Information Technology: Review and
Assessment,” Brynjolfsson posits that four factors have prevented researchers from developing reliable
and powerful quantitative economic models. The first of these factors “mismeasurement of outputs and
inputs,” refers to the non-standardized way in which institutions capture and define IT economic indicators
and the difficulty associated with measuring the appreciation in the value of information itself [32, p. 74].](https://image.slidesharecdn.com/4c50210b-939f-4c7a-aa9c-2c2e10faf755-160510070431/75/KNISH-EDWARD-Spring2016-33-2048.jpg)
![34
Second, Brynjolfsson explains that “the benefits from IT can take several years to show results” and these
lags have the potential to understate the economic benefits of IT and obfuscate value indicators [32, p.
75]. Additionally, information technology investments may have little effect on aggregate economic gauges
owing to the possibility that value gains to an individual firm from IT may be redistributions of economic
value rather than new value creations [32, p. 75]. Finally, Brynjolfsson argues that the value of IT may
depend so heavily on its management that many of the expected economic benefits of IT are locked in
behind inefficient managers [32, p. 75].
Economic Valuation: Summary Observations
Despite these limitations, many researchers have attempted to develop robust quantitative
economic valuation methods for information technology. Kauffman and Kriebel expended tremendous
effort in applying Data Envelopment Analysis to IT [23] and Barua, Kriebel and Mukhopadhyay went to
great lengths to value a simple hypothetical duopooly in the search for the economic value of information
systems [33]. While these efforts deserve praise and recognition from the IS research community, the lack
of consensus and empirical evidence surrounding the economic value of IT pushes the examination of
specific valuation models beyond the scope of this paper. In summary, historical, economic IT valuation
methods prove useful in identifying the sources of IT value but do not satisfactorily capture the levels of
value created. Offering a reminder that using economic methods in combination with other value
measures may result in the overstatement of true IT value, this paper turns its focus to the last category of
historical valuation techniques: financial valuation methods.
Financial Valuation
Before the fourth era of the information systems discipline, researchers thought little about
financial, or as commonly referred to in IT literature, traditional, approaches to system valuation. The
researchers who did address them deemed traditional approaches “inappropriate” because “IT involves a
wide range of strategic benefits that are hard to quantify; and any circumstances surrounding IT
investment criteria are subject to increasingly rapid change” [34]. Owing to this view of traditional
methods as inappropriate, historical methods for financial IT business value exist almost completely in the](https://image.slidesharecdn.com/4c50210b-939f-4c7a-aa9c-2c2e10faf755-160510070431/75/KNISH-EDWARD-Spring2016-34-2048.jpg)
![36
(mainframes, minicomputers and supercomputers) as well as the value of all PCs currently owned by the
firm,” and IS Labor, “which is the labor portion of the central IS budget” [25]. This brief review of financial
calculations concludes this paper’s discussion of historical financial methods because traditional
approaches were not taken seriously until well into the fourth era of the IS research field.
Historical Valuation: Summary Observations
This historical valuation section has examined three broad categories of information system
valuation common among researchers from the mid 1960’s all the way through the mid 1990’s. Whether
trying to determine the qualitative, economic, or financial characteristics of an information system, one
idea is clear: a system evaluation that fails to address any one of these areas importantly lacks in precision
and due diligence. This section has expressed another truth about systems evaluation in that unlike typical
business assets, IT assets often do not provide concrete, direct benefits. This problem of measurement has
confounded researchers since IT’s rise in popularity nearly 60 years ago and continues into this day. IT
business value arises from IT’s ability to alter productivity, market characteristics, competitor behavior and
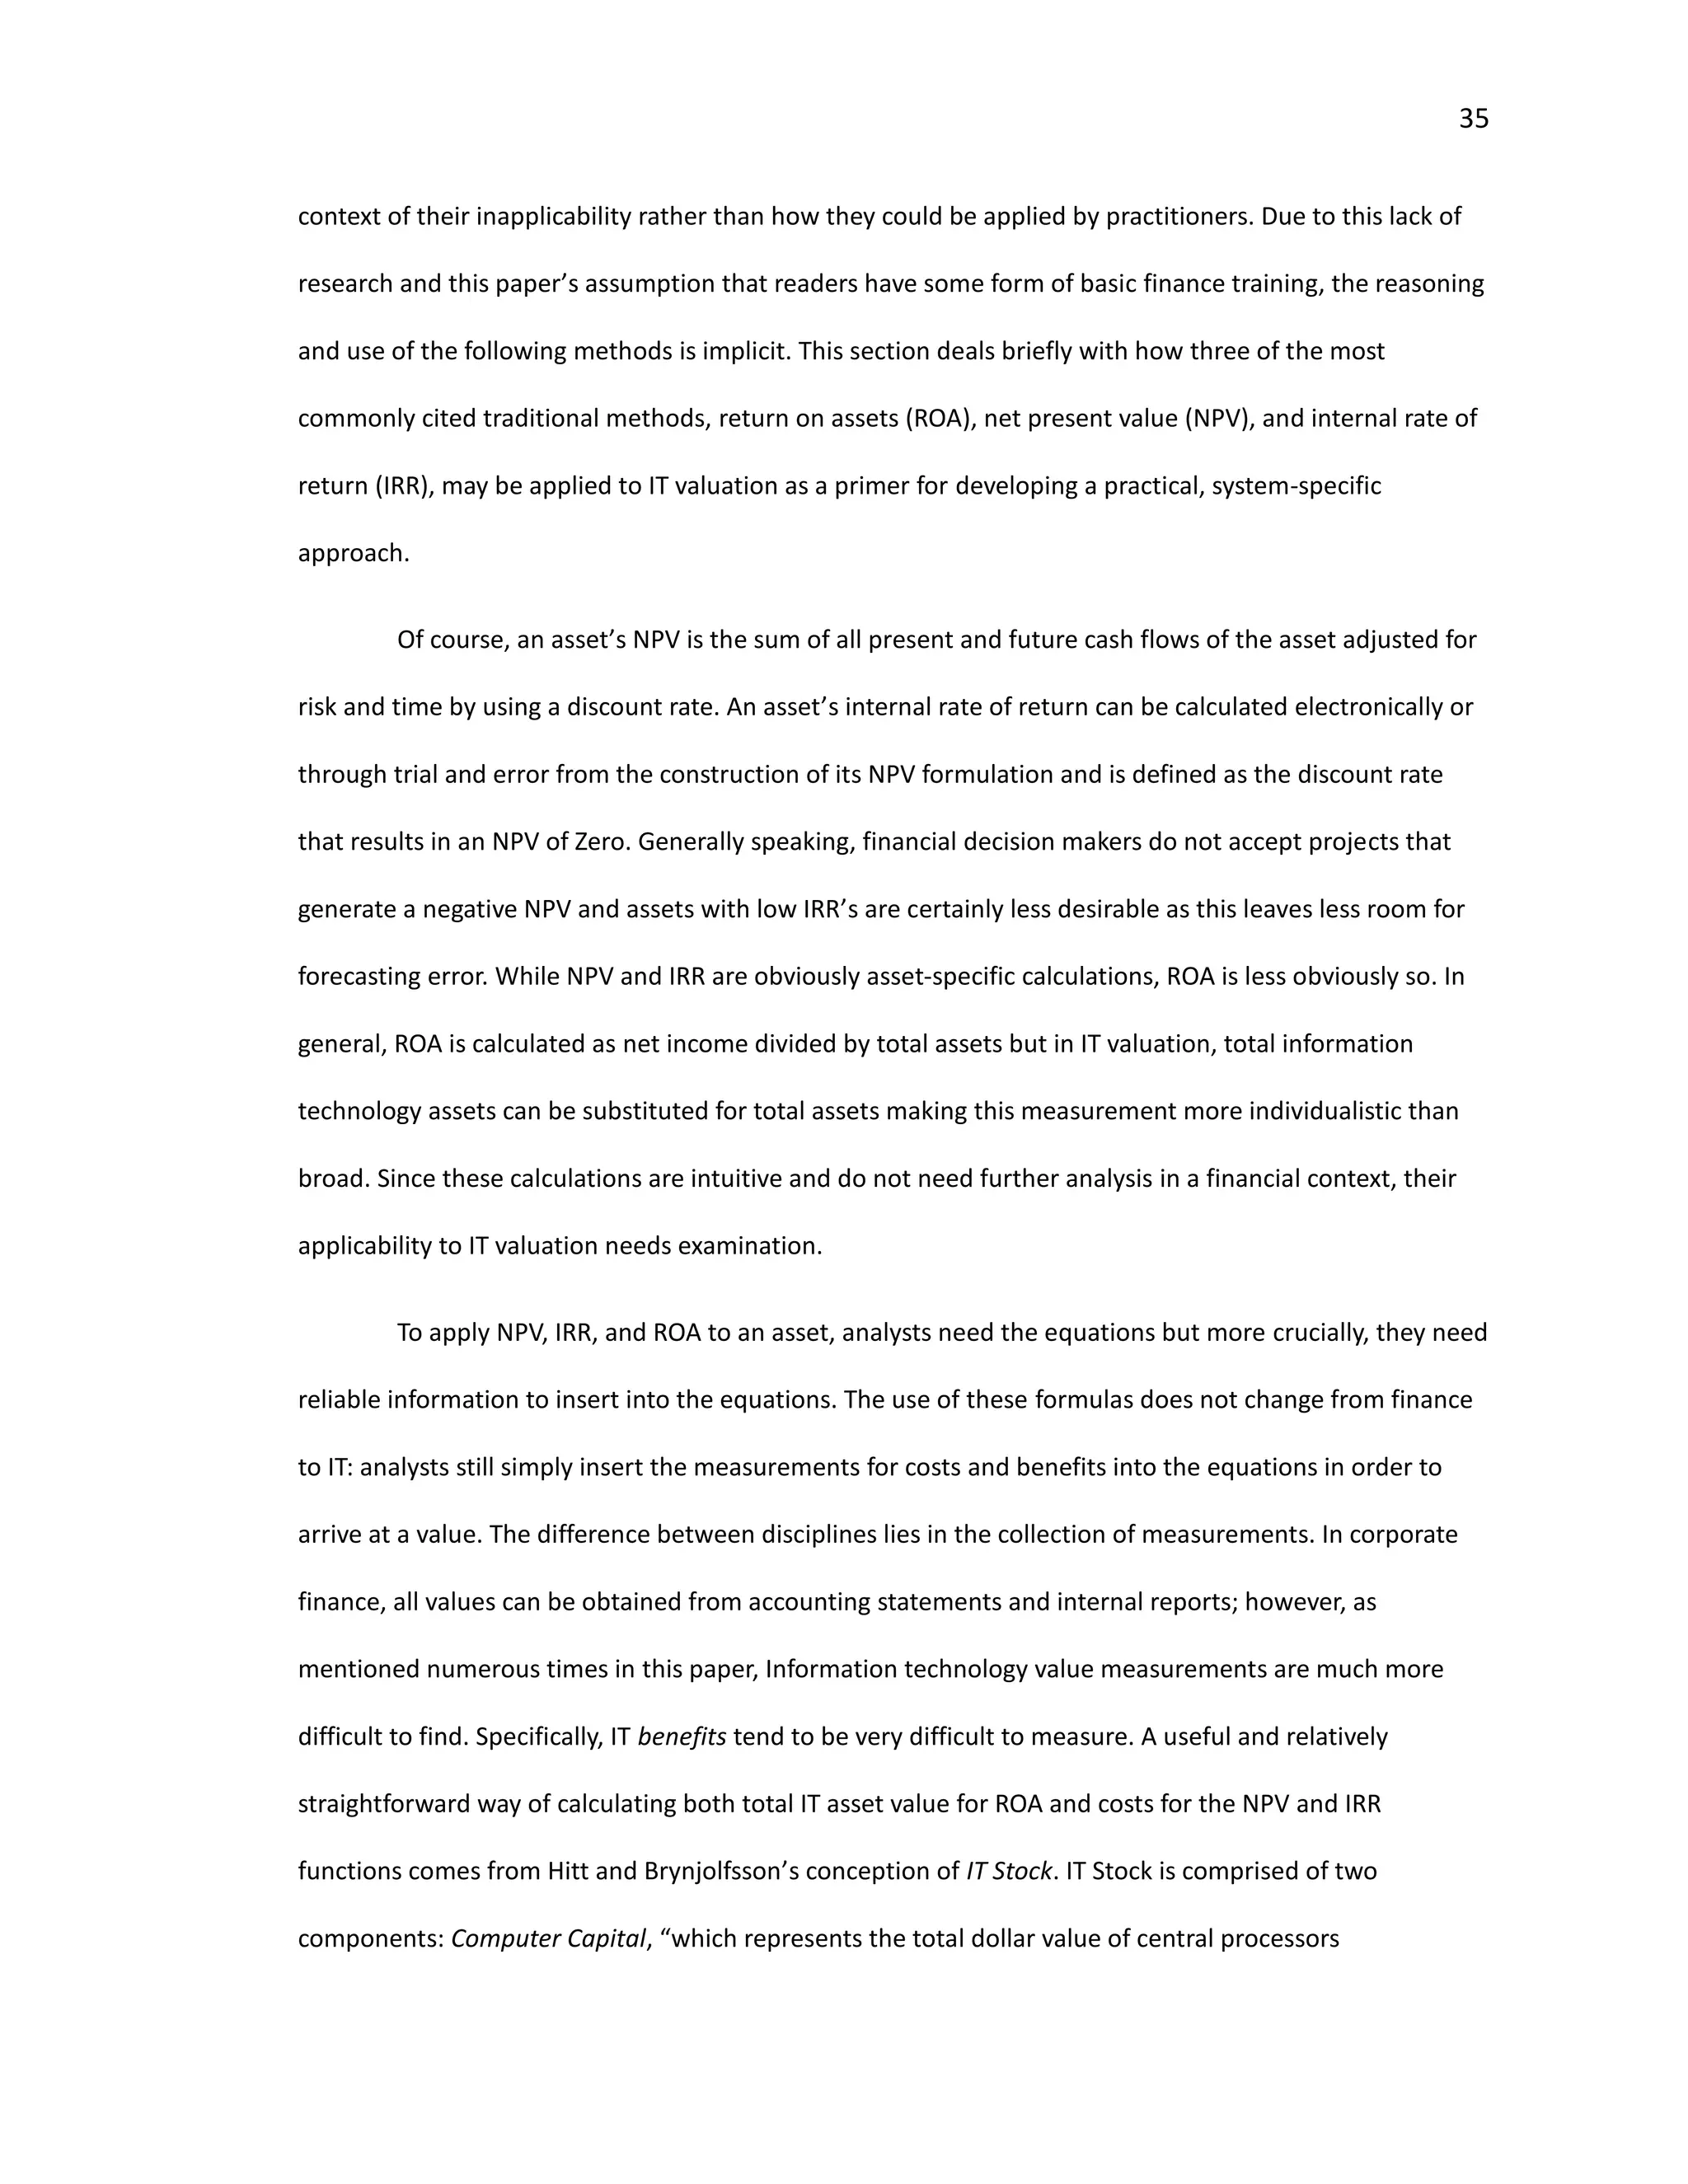
a host of other economic indicators but no single method can fully capture this value (Figure 7) because of
the diverse effects IT has on a corporation. Having demonstrated that the effects of these changes can be
captured by economic, qualitative and financial indicators, the focus shifts to current methods and
extensions of these theories to provide practitioners with guidance on the most recent ways that the field
has begun determining IT business value.](https://image.slidesharecdn.com/4c50210b-939f-4c7a-aa9c-2c2e10faf755-160510070431/75/KNISH-EDWARD-Spring2016-36-2048.jpg)
![38
V. Current Methods
Having reviewed the historical foundations for IT business value, one might think that this wide
body of research has coalesced into a few concise methods for determining the value of an information
system; however, this has not yet occurred. While many researchers have found promising empirical
evidence that certain alterations to the aforementioned methods produce more precise measures of IT
value [25, 34], consensus remains far out of reach for the field. As this paper intends to provide guidance
for current practitioners, comparing the strengths and weaknesses of all current methods is not
appropriate in this context. Instead I present three recent approaches to determining IS value that stand
out as particularly applicable and powerful in aiding individuals evaluating current systems. These
approaches include valuing an information system using option-pricing, using Tobin’s Q as a proxy for IS
intangible value, and Intel’s comprehensive method of determining IS value.
IT Option Pricing
Following from the theory that the value of an information system partially derives from the
opportunities IT creates for a firm later in time, Michael Benroach and Robert Kauffman argue that valuing
an IS as a stock option appropriately captures IT value. Citing recent research, Benroach and Kauffman
argue that an IT project “embeds a real option when it offers management the opportunity to take some
future action” [35, p. 2]. They further note precedence for the non-equity specific implementation of
option pricing in the financial field where “these models and their extensions have also been used in a
variety of evaluative settings involving capital budgeting investments embedding real options” [35, p. 2].
The attractiveness of this option pricing approach, they argue, lies in the fact that it “take[s] into account
the fact that changes in revenue expectations will occur as time passes” which traditional measures such
as NPV and IRR fail to do [35, p. 5].
The authors further demonstrate that the risk assumptions and acceptance of skewed outcome
distributions inherent in the Black-Scholes option pricing model line up well with IS valuation [35, p. 4].
The authors explain the Black-Scholes model in the following manner:](https://image.slidesharecdn.com/4c50210b-939f-4c7a-aa9c-2c2e10faf755-160510070431/75/KNISH-EDWARD-Spring2016-38-2048.jpg)
![39
The value of a call option is its discounted expected terminal value, E[CT]. The
current value of a call option is given by 𝐶 = 𝑒−𝑟 𝑓 𝑇
𝐸[𝐶 𝑇], where 𝑒−𝑟 𝑓 𝑇
is
the present value factor for risk-neutral investors. A risk-neutral investor is
indifferent between an investment with a certain rate of return and an
investment with an uncertain rate of return whose expected value matches
that of the investment with the certain rate of return. Given that 𝐶 𝑇 =
𝑚𝑎𝑥[0, 𝐴 𝑇 − 𝑋] and assuming that 𝐴 𝑇 is log-normally distributed, it can be
shown that:
𝐶 = 𝐴𝑁(𝑑1) − 𝑒−𝑟 𝑓 𝑇
𝑋𝑁(𝑑2),
𝑑1 =
𝑙𝑛(
𝐴
𝑥
)𝑟𝑡 𝑓
𝜎√ 𝑇
+
1
2
𝜎√𝑇, 𝑑2 = 𝑑1 − 𝜎√𝑇
where N() is the cumulative normal distribution. Call option value, C,
calculated using the BlackScholes model, denoted 𝐶 𝐵𝑆
, can also be written as
the implicit function 𝐶 𝐵𝑆
= 𝐶 𝐵𝑆
𝐵𝑆 (𝐴, 𝜎, 𝑋, 𝑇, 𝑟𝑓) [35, p. 6].
The variables in these equations are defined as follows:
C — value of a call option;
A — value of option's underlying risky asset (stated in terms of the present
value of expected revenues from the operational project);
µ — rate of return expected on A (growth rate of A over time);
σ — volatility, the standard deviation of the expected rate of return on A;
X — option's exercise price (cost of converting the investment opportunity
into the option's underlying asset, i.e., the operational project);](https://image.slidesharecdn.com/4c50210b-939f-4c7a-aa9c-2c2e10faf755-160510070431/75/KNISH-EDWARD-Spring2016-39-2048.jpg)
![40
rf — the risk-free interest rate (usually implemented as the rate of return on
U.S. Treasury Bills);
r — 1+rf ;
T — option's time to maturity or expiration (i.e., the maximum length of the
deferral period).
Black Scholes, just like any other financial model, requires concrete financial values. Benroach
and Kauffman rely on the time-tested, albeit not entirely precise, method of asking decision-makers for
approximations to determine the financial outcomes needed to use this model [35, p. 9]. Benroach and
Kauffmman explain in detail how they applied this method to evaluate Yankee 24’s decision of if and when
to offer debit card services to member firms [35, p. 3]; however, a full review of how to use the Black-
Scholes model is not appropriate for this paper. Rather, this section addresses this approach since it
represents a new, and arguably more extensible method of determining IS value for current practitioners.
In summary, applying option pricing models to the evaluation of an IS addresses the timing and volatility
issues ignored by NPV and IRR calculations. One of the largest problems with evaluating IT, intangible
benefit measurement, is discussed next through the lens of Tobin’s Q.
Tobin’s Q
The second current IS valuation approach that practitioners ought to be made aware of given its
power and unique take on addressing the intangible value of IT assets lies in an older financial measure
known as Tobin’s Q Ratio. As explained by Bharadwaj, Bharadwaj, and Konsynski, Tobin’s Q is “defined as
the capital market value of the firm divided by the replacement value of its assets” [36, p. 1009]. While
these researchers certainly did not develop this method, they note that it has been used extensively in a
variety of value applications [36, p. 1010] and is useful to IT because it “incorporates a market measure of
firm value which is forward-looking, risk-adjusted, and less susceptible to changes in accounting practices”
[36, p. 1009]. As mentioned in this paper’s section on historical financial valuation measures, researchers](https://image.slidesharecdn.com/4c50210b-939f-4c7a-aa9c-2c2e10faf755-160510070431/75/KNISH-EDWARD-Spring2016-40-2048.jpg)
![41
have long derided traditional valuation approaches because accounting numbers fail to measure
intangible benefits. The authors further criticize these methods because “they typically only reflect past
information” and hence, lack applicability to new information systems projects and future managerial
performance.
In order to study whether or not investments in information technology correlated with Tobin’s Q
Ratio, the researchers studied 631 firms over a 5 year period (1989-1993) [36, p. 1013]. They specifically
chose Chung and Pruitt’s simplified Q formulation to carry out their analysis which defines Tobin’s Q as:
𝑇𝑜𝑏𝑖𝑛′
𝑠 𝑄 = (𝑀𝑉𝐸 + 𝑃𝑆 + 𝐷𝐸𝐵𝑇)/𝑇𝐴
“Where: MVE = (Closing price of share at the end of the financial year)*(Number of common shares
outstanding); PS = Liquidating value of the firm's outstanding preferred stock; DEBT = (Current liabilities -
Current assets) + (Book value of inventories) + (Long term debt), and TA = Book value of total assets.” [36,
p. 1014]. After running a statistical analysis of five different proposed influences of Tobin’s Q [36, p. 1016],
it was shown that “the inclusion of the IT expenditure variable in the model increased the variance
explained in q significantly” and that “IT had a statistically significant positive association with Tobin's q”
[36, p. 1017]. The authors note that while Tobin’s Q helps analysts capture the intangible benefits of IT, “q
is only an aggregate measure of the intangible value of a firm, and further research is needed to unbundle
the various sources of intangible value” [36, p. 1019]. This IT contribution to a firm’s Q may be quantified
and used as a proxy for IT intangible value once the method for uncoupling the various intangible benefits
is fleshed out but for this paper, it is important for IT and financial practitioners to be aware that this
promising method exists. As a final note on current valuation methods, this paper turns its attention to
David Sward’s method of system evaluation.
Sward’s Multi-Attribute Financial Valuation
The final method this paper reviews comes from David Sward’s comprehensive guide to valuing
information systems projects found in his book “Measuring the Business Value of Information
Technology.” Not only does Sward provide a quantitative-based approach to system valuation, he extends](https://image.slidesharecdn.com/4c50210b-939f-4c7a-aa9c-2c2e10faf755-160510070431/75/KNISH-EDWARD-Spring2016-41-2048.jpg)
![42
the calculation portion into a full method for any company or individual hoping to evaluate an information
system. For practitioners looking for step-by-step guidance in designing a systems analysis method that
also explains the technical aspects of financial valuation in detail, I highly recommend reading Sward’s 280
page guide to information systems evaluation. However, as this thesis is dedicated to a concise, practical
approach for practitioners hoping to evaluate an IS, Sward’s method is briefly explained in this section
before moving on to the final section: a practical approach to information system valuation.
Sward bases much of his method on his experience in developing an IT business value system for
Intel. He notes that at Intel, they develop “business value dials” which, are “standardized indicator[s] of
business value” and that “when deploying IT solutions, [Intel’s] intention is to influence these business
values dials” [1, p. 20]. Interestingly, these dials (Figure 8) ought to be developed by management and
stated in qualitative terms initially such as “faster time to market” or “improvements in employee
productivity” [1, pp. 19-21]. After this initial assessment is complete, Sward insists that “study designers
should prepare an inventory of all information and data available for the IT solution” and that, if data
cannot be collected for a certain dial, then “more data and more work will be required” [1, pp. 114-115].
Obviously, this approach depends fully on quantifiable impacts which this paper sees as a shortcoming of
the model but this does not mean Sward’s approach loses its adaptability.
Sward aids readers tremendously in identifying four broad categories of IT that affect a firm’s
bottom line including headcount management, expense avoidance, working capital, and revenue increases
[1, p. 22]. Sward then breaks each section out and lists in detail what types of concrete financial indicators
measure these categories, how they are calculated, and how they influence firm value [1, pp. 23-43].
Sward’s contribution to IT business value research comes from his approach to translating qualitative IT
impacts into quantitative measurements that can be determined by most financial practitioners. He offers
a concrete method for developing an individual approach to measuring the financial value of IT and his
work ought to be examined by IT and finance professionals looking for stepwise instructions regarding this
matter.](https://image.slidesharecdn.com/4c50210b-939f-4c7a-aa9c-2c2e10faf755-160510070431/75/KNISH-EDWARD-Spring2016-42-2048.jpg)
![43
Figure 8 [1, p. 20]](https://image.slidesharecdn.com/4c50210b-939f-4c7a-aa9c-2c2e10faf755-160510070431/75/KNISH-EDWARD-Spring2016-43-2048.jpg)
![44
Commodity Information Systems
While not an approach to IT valuation, an important conception of IT has gained traction in
recent years and needs to be addressed. This new idea asserts that “the growing ubiquity of IT means that
its strategic importance is diminishing and that IT is, in fact, becoming merely a commodity” [36].
Commodities, by nature, have definite values and definite attributes and certain classes of systems such as
CRM systems offered by companies like Salesforce have arguably reached a degree of standardization and
ubiquity where their intrinsic values and attributes are easy to measure and describe. This paper will not
explore this concept or these types of systems since they importantly lack any applicable valuation
approaches to IT as a commodity.
Current Methods: Summary Observations
The current methods discussed in this section represent reliable, and potentially powerful
extensions to the foundational approaches to IT business valuation. Benroach and Kauffman offer option
pricing as a viable IT valuation approach owing to IT’s alignment with the risk and distribution assumptions
inherent in the Black-Scholes and Binomial pricing models. Bharadwaj, Bharadwaj, and Konsynski
demonstrate the positive, statistical impact IT investments have on Tobin’s Q Ratio and explain how this
measurement may be able to serve as a proxy for the intangible value of IT. Lastly, Sward’s research and
experience culminated in arguably one of the most comprehensive approaches to concrete, quantitative IT
valuation. Having reviewed the current and historical foundations for IT business valuation, I now offer a
practical approach to those interested in trying to discover the value of an information system in their life.](https://image.slidesharecdn.com/4c50210b-939f-4c7a-aa9c-2c2e10faf755-160510070431/75/KNISH-EDWARD-Spring2016-44-2048.jpg)
![51
Works Cited
[1] D. S. Sward, Measuring the Business Value of Information Technology: Practical
Strategies for IT Business Managers, Hillsboro, Oregon: Intel Press, 2006.
[2] U.S. Bureau of Economic Analysis, "Table 2.7. Investment in Private Fixed Assets,
Equipment, Structures, and Intellectual Property Products by Type," [Online].
Available:
http://www.bea.gov/iTable/iTable.cfm?ReqID=10&step=1#reqid=10&step=3&isuri=1&
1003=51&1004=1960&1005=2014&1006=a&1011=0&1010=x. [Accessed 01 May
2016].
[3] T. McMahon, "Historical Consumer Price Index (CPI-U) Data," Intergalactic Web
Designers, 2016.
[4] J. Rowley, "The Wisdom Hierarchy: Representations of the DIKW Hierarchy," Journal of
Information Science, vol. 33, no. 2, pp. 163-180, April 2007.
[5] P. Balztan, Business Driven Technology, 6th ed., New York, New York: McGraw Hill,
2015.
[6] S. Wood, Artist, DIKW Pyramid. [Art]. Digital Image. Top Entity. Free World Media.
[7] C. Zins, "Conceptual Approaches for Defining Data, Information, and Knowledge,"
Journal of the Association for Information Science and Technology, vol. 58, no. 4, pp.
479-493, 2007.
[8] D. A. Truncellito, Epistemology.
[9] R. J. Sternberg, "Understanding Wisdom," in Wisdom: Its Nature, Origins, and
Development, Cambridge, Massachusetts: Cambridge University Press, 1990, pp. 1-7.
[10] J. W. J. R. B. B. S. D. Satzinger, Systems Analysis and Design in a Changing World, 6th
ed., Boston, Massachusetts: Course Technology, 2012, pp. 1-10.
[11] I. Benbasat and R. W. Zmud, "The Identity Crisis within the IS Discipline: Defining and
Communicating the Discipline's Core Properties," MIS Quarterly, vol. 27, no. 2, pp.
183-194, March 2003.
[12] S. Alter, "The Work System Method for Understanding Information Systems and
Information Sytems Research," Communications for the Association for Information
Systems, vol. 9, pp. 90-104, 2002.](https://image.slidesharecdn.com/4c50210b-939f-4c7a-aa9c-2c2e10faf755-160510070431/75/KNISH-EDWARD-Spring2016-51-2048.jpg)
![52
[13] W. v. d. Aalst and C. Stahl, "Information Systems: Introduction and Concepts," in
Modeling Business Processes: A Petri Net-Oriented Approach, Cambridge,
Massachusetts: The MIT Press, 2011, pp. 1-40.
[14] R. Hirschheim and H. K. Klein, "A Glorious and Not-So-Short History of the Information
Systems Field," Journal of the Association for Information Systems, vol. 13, no. 4, pp.
188-235, April 2012.
[15] R. J. Kauffman and P. Weill, "An Evaluative Framework for Research on the
Performance Effects of Information Technology Investment," Stern School of Business -
Working Paper Series - IS-89-83, December 1989.
[16] B. Ives, M. H. Olson and J. J. Baroudi, "The Measurement of User Information
Satisfaction," Stern School of Business - Working Paper Series - IS-82-27, vol. 26, no. 10,
October 1983.
[17] M. E. Porter, "Technology and Competitive Advantage," in Competitive Advantage:
Creating and Sustaining Superior Performance, 1st Free Press Edition ed., New York,
New York: The Free Press, 1985, pp. 164-200.
[18] M. E. Porter and V. E. Millar, "How Information Gives You Competitive Advantage,"
1985.
[19] E. K. Clemons, "Evaluation of Strategic Investments in Information Technology,"
Communications of the ACM, vol. 34, no. 1, pp. 22-36, January 1991.
[20] S. W. Pearson and J. E. Bailey, "Development of a Tool for Measuring and Analyzing
Computer User Satisfaction," Management Science, vol. 29, no. 5, pp. 530-544, May
1983.
[21] N. Ahituv, "A Systematic Approach toward Assessing the Value of an Information
System," MIS Quarterly, vol. 4, no. 4, pp. 61-75, December 1980.
[22] D. R. Heise, "The Semantic Differential and Attitude Research," in Attitude
Measurement, G. F. Summers, Ed., Chicago, Illinois: Rand McNally, 1970, pp. 235-253.
[23] W. H. DeLone and E. R. McLean, "Information Systems Success: The Quest for the
Dependent Variable," Information Systems Research, vol. 3, no. 1, pp. 60-95, March
1992.
[24] R. J. Kauffman and C. H. Kriebel, "Modeling and Measuring the Business Value of
Information Technology," Stern School of Business - Working Paper Series - IS-88-24,
March 1988.](https://image.slidesharecdn.com/4c50210b-939f-4c7a-aa9c-2c2e10faf755-160510070431/75/KNISH-EDWARD-Spring2016-52-2048.jpg)
![53
[25] J. Y. Bakos and C. F. Kemerer, "An Assessment of the Productivity Impact of Information
Technologies [Draft Version]," Decision Support Systems, pp. 365-386, December 1992.
[26] L. M. Hitt and E. Brynjolfsson, "Productivity, Business Profitability, and Consumer
Surplus: Three Measures of Information Technology Value," MIS Quarterly, vol. 20, no.
2, pp. 121-142, June 1996.
[27] T. Mukhopadhyay, S. Kekre and S. Kalathur, "Business Value of Information Technology:
A Study of Electronic Data Interchange," MIS Quarterly, vol. 19, no. 2, pp. 137-156,
June 1995.
[28] J. Mooney, V. Gurbaxani and K. Kraemer, "A Process Oriented Framework for Assessing
the Business Value of Information Technology," in International Conference on
Information Systems 1995 Proceedings, 1995.
[29] E. Brynjolfsson and l. Hitt, "Information Technology as a Factor of Production: The Role
of Differences Among Firms," MIT Center for Coordination Science Working Paper
Series, no. 201, pp. 1-25, August 1994.
[30] H. C. Lucas and M. Olson, "The Impact of Information Technology on Organizational
Flexibility," Stern School of Business - Working Paper Series - IS-93-49, November 1993.
[31] D. Sull, "Competing Through Organizational Agility," McKinsey Quarterly, December
2009.
[32] E. K. Clemons and M. C. Row, "Information Technology and Industrial Cooperation: The
Changing Economics of Coordination and Ownership," Journal of Management
Information Systems, vol. 9, no. 2, pp. 9-28, Fall 1992.
[33] E. Brynjolfsson, "The Productivity Paradox of Information," Communications of the
ACM, September 1992.
[34] A. Barua, C. H. Kriebel and T. Mukhopadhyay, "An Economic Analysis of Strategic
Information Technology Investments," MIS Quarterly, vol. 15, no. 3, pp. 313-331,
September 1991.
[35] A. Anandarajan and H. J. Wen, "Evaluation of Information Technology Investment,"
Management Decision, vol. 37, no. 4, 1999.
[36] M. Benroach and R. Kauffman, "A Case for Using Real Options Pricing Analysis to
Evaluate Information Technology Project Investments," Information Systems Research,
vol. 10, no. 1, 1999.](https://image.slidesharecdn.com/4c50210b-939f-4c7a-aa9c-2c2e10faf755-160510070431/75/KNISH-EDWARD-Spring2016-53-2048.jpg)
![54
[37] A. S. Bharadwaj, S. G. Bharadwaj and B. R. Konsynski, "Infornation Technology Effects
on Firm Performance as Measured by Tobin's q," Management Science, vol. 45, no. 7,
pp. 1008-1024, July 1999.
[38] S. Lee, J. Song, J. Baker, Y. Kim and J. C. Wetherbe, "The Commoditization of IT:
Evidence from a Longitudinal Text Mining Study," Communications of the Association
for Information Systems, vol. 29, no. 12, pp. 222-242, 2011.
[39] G. B. Davis, "Information Systems Conceptual Foundations: Looking Backward and
Forward," in Organizational and Social Perspectives on Information Technology, New
York, Springer Science + Business Media, 2000, pp. 61-82.
[40] R. D. Banker and R. J. Kauffman, "Quantifying the Business Value of Information
Technology: An Illustration of the 'Business Value Linkage' Framework," New York,
1991.
[41] K. H. Chung and S. W. Pruitt, "A Simple Approximation of Tobin's Q," Financial
Management, vol. 23, no. 3, pp. 70-74, Autumn 1994.](https://image.slidesharecdn.com/4c50210b-939f-4c7a-aa9c-2c2e10faf755-160510070431/75/KNISH-EDWARD-Spring2016-54-2048.jpg)
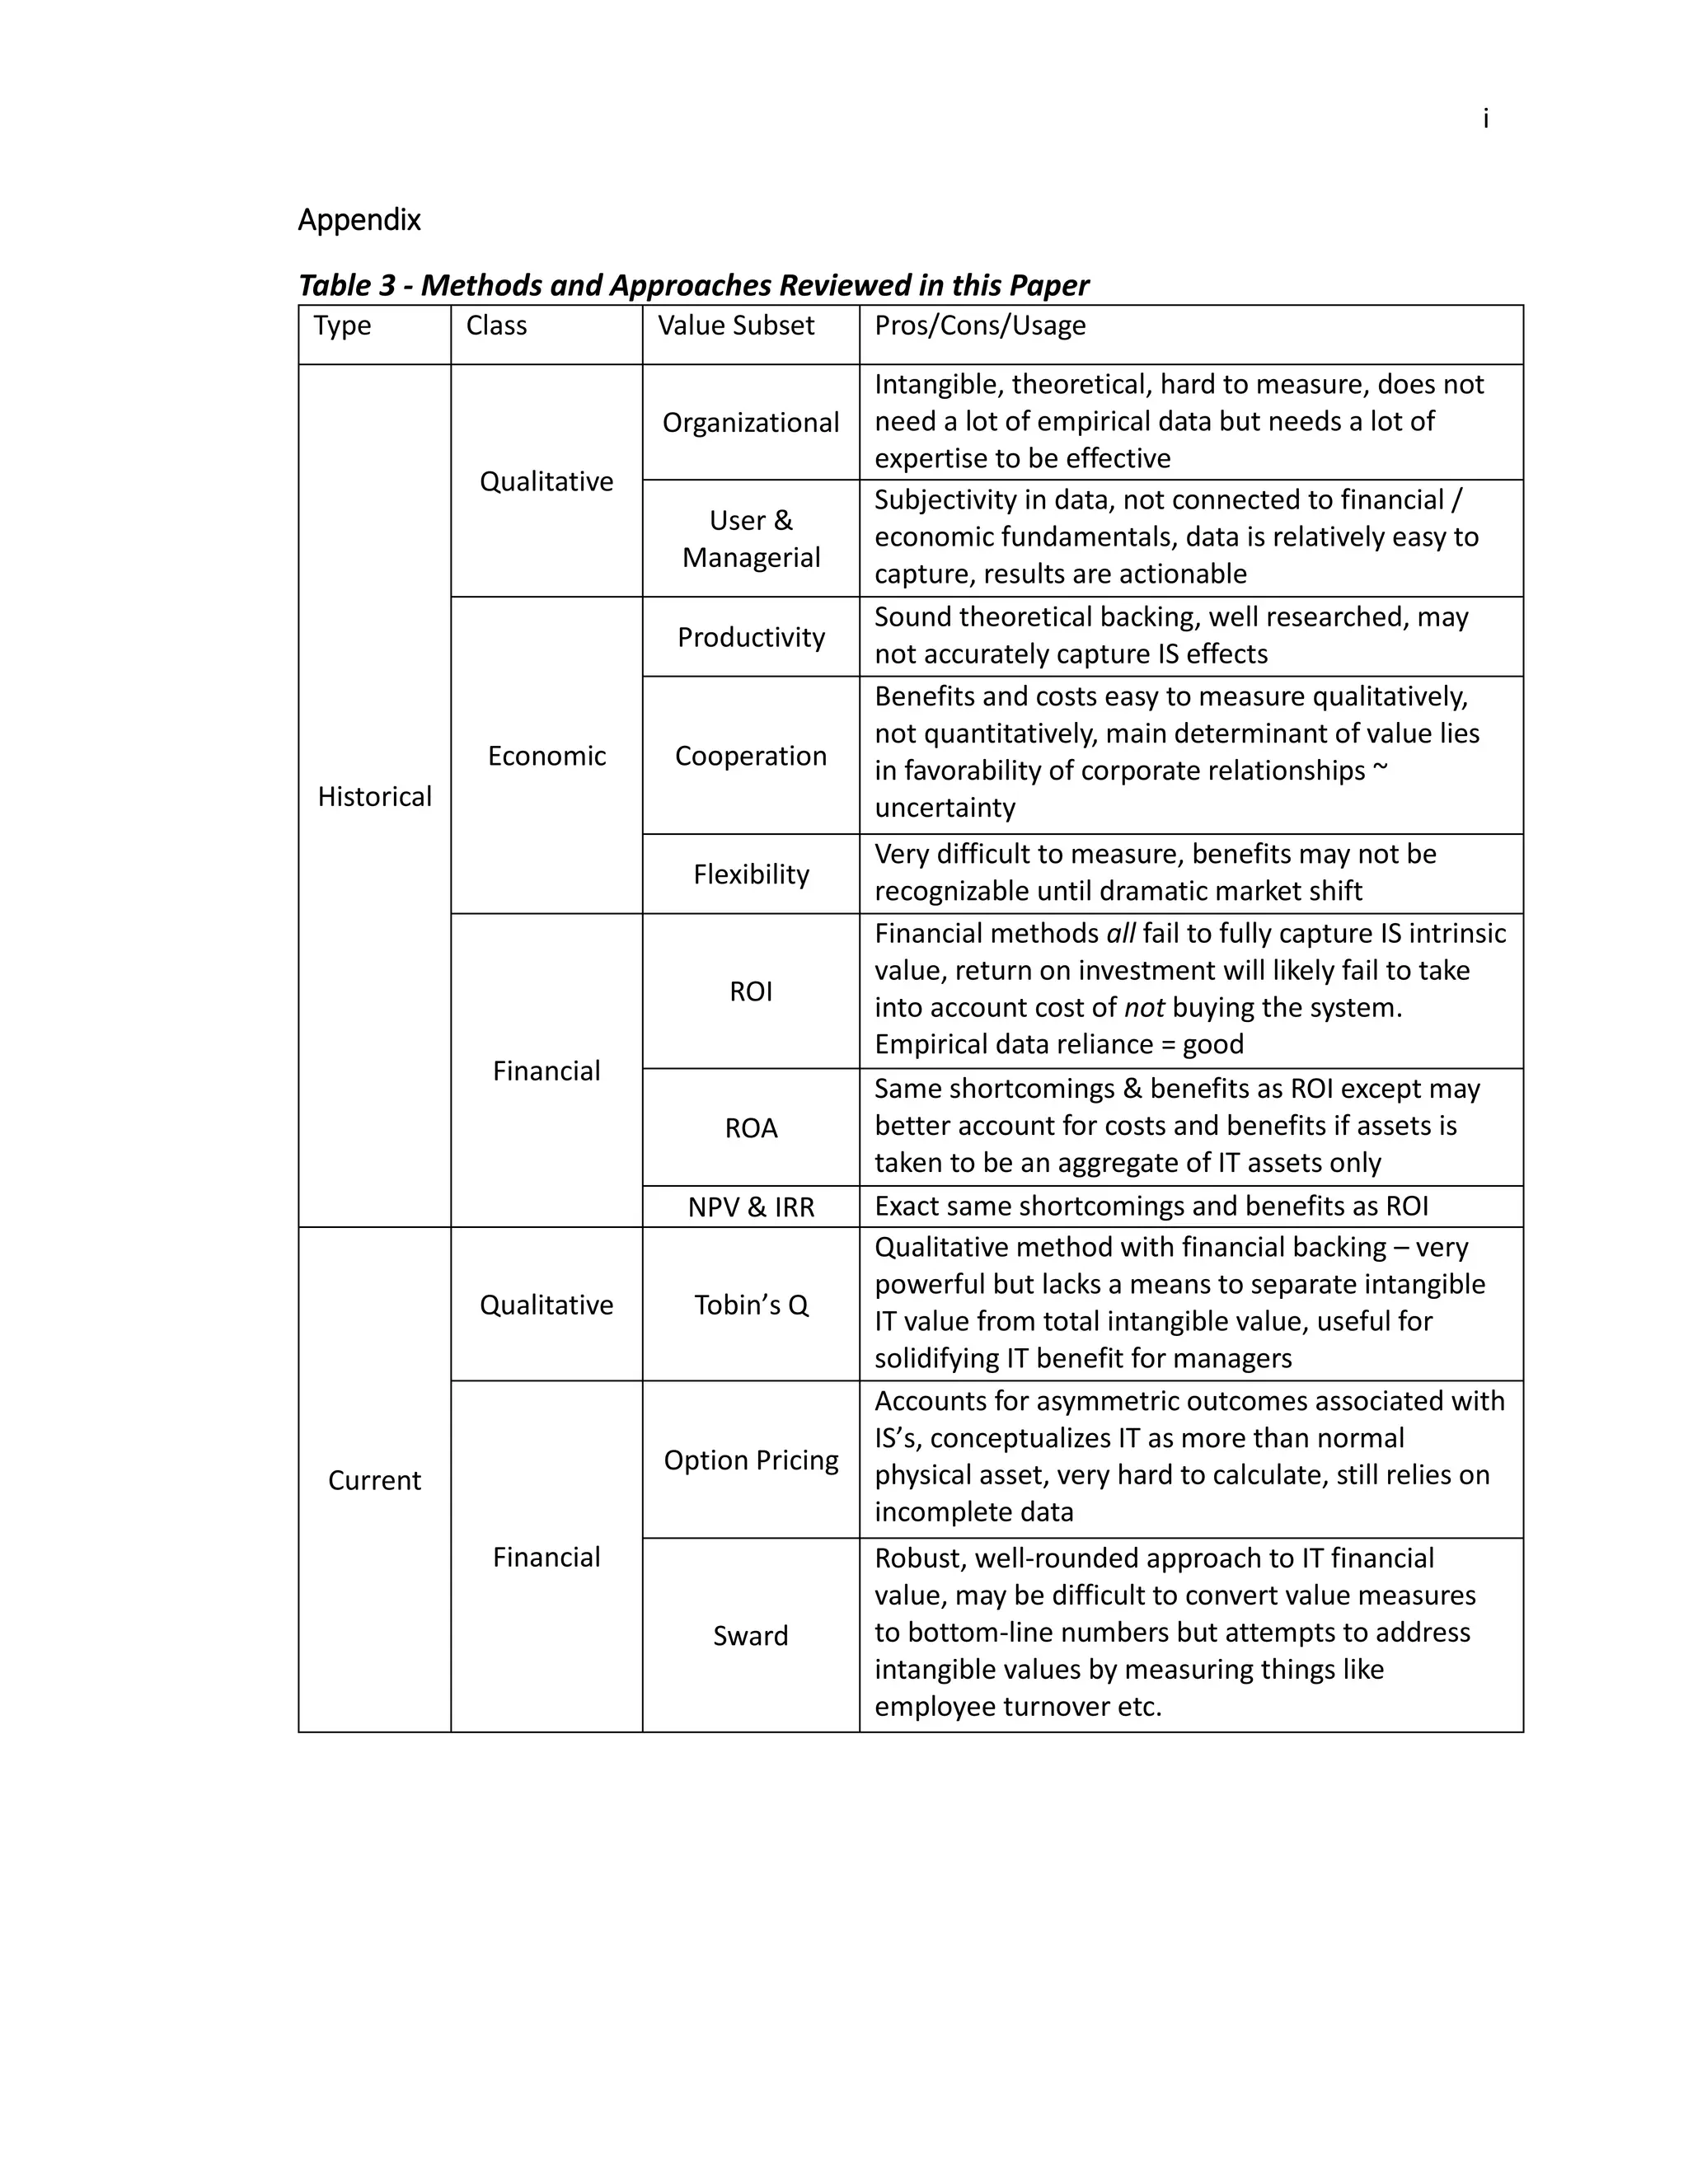


![[En] More Yo-yos pendulums ... Empirica STAR Report](https://cdn.slidesharecdn.com/ss_thumbnails/rapportstar2003-141119060039-conversion-gate01-thumbnail.jpg?width=640&height=640&fit=bounds)


![Presentación1[1]](https://cdn.slidesharecdn.com/ss_thumbnails/presentacin11-120223100217-phpapp02-thumbnail.jpg?width=640&height=640&fit=bounds)


