Download to read offline
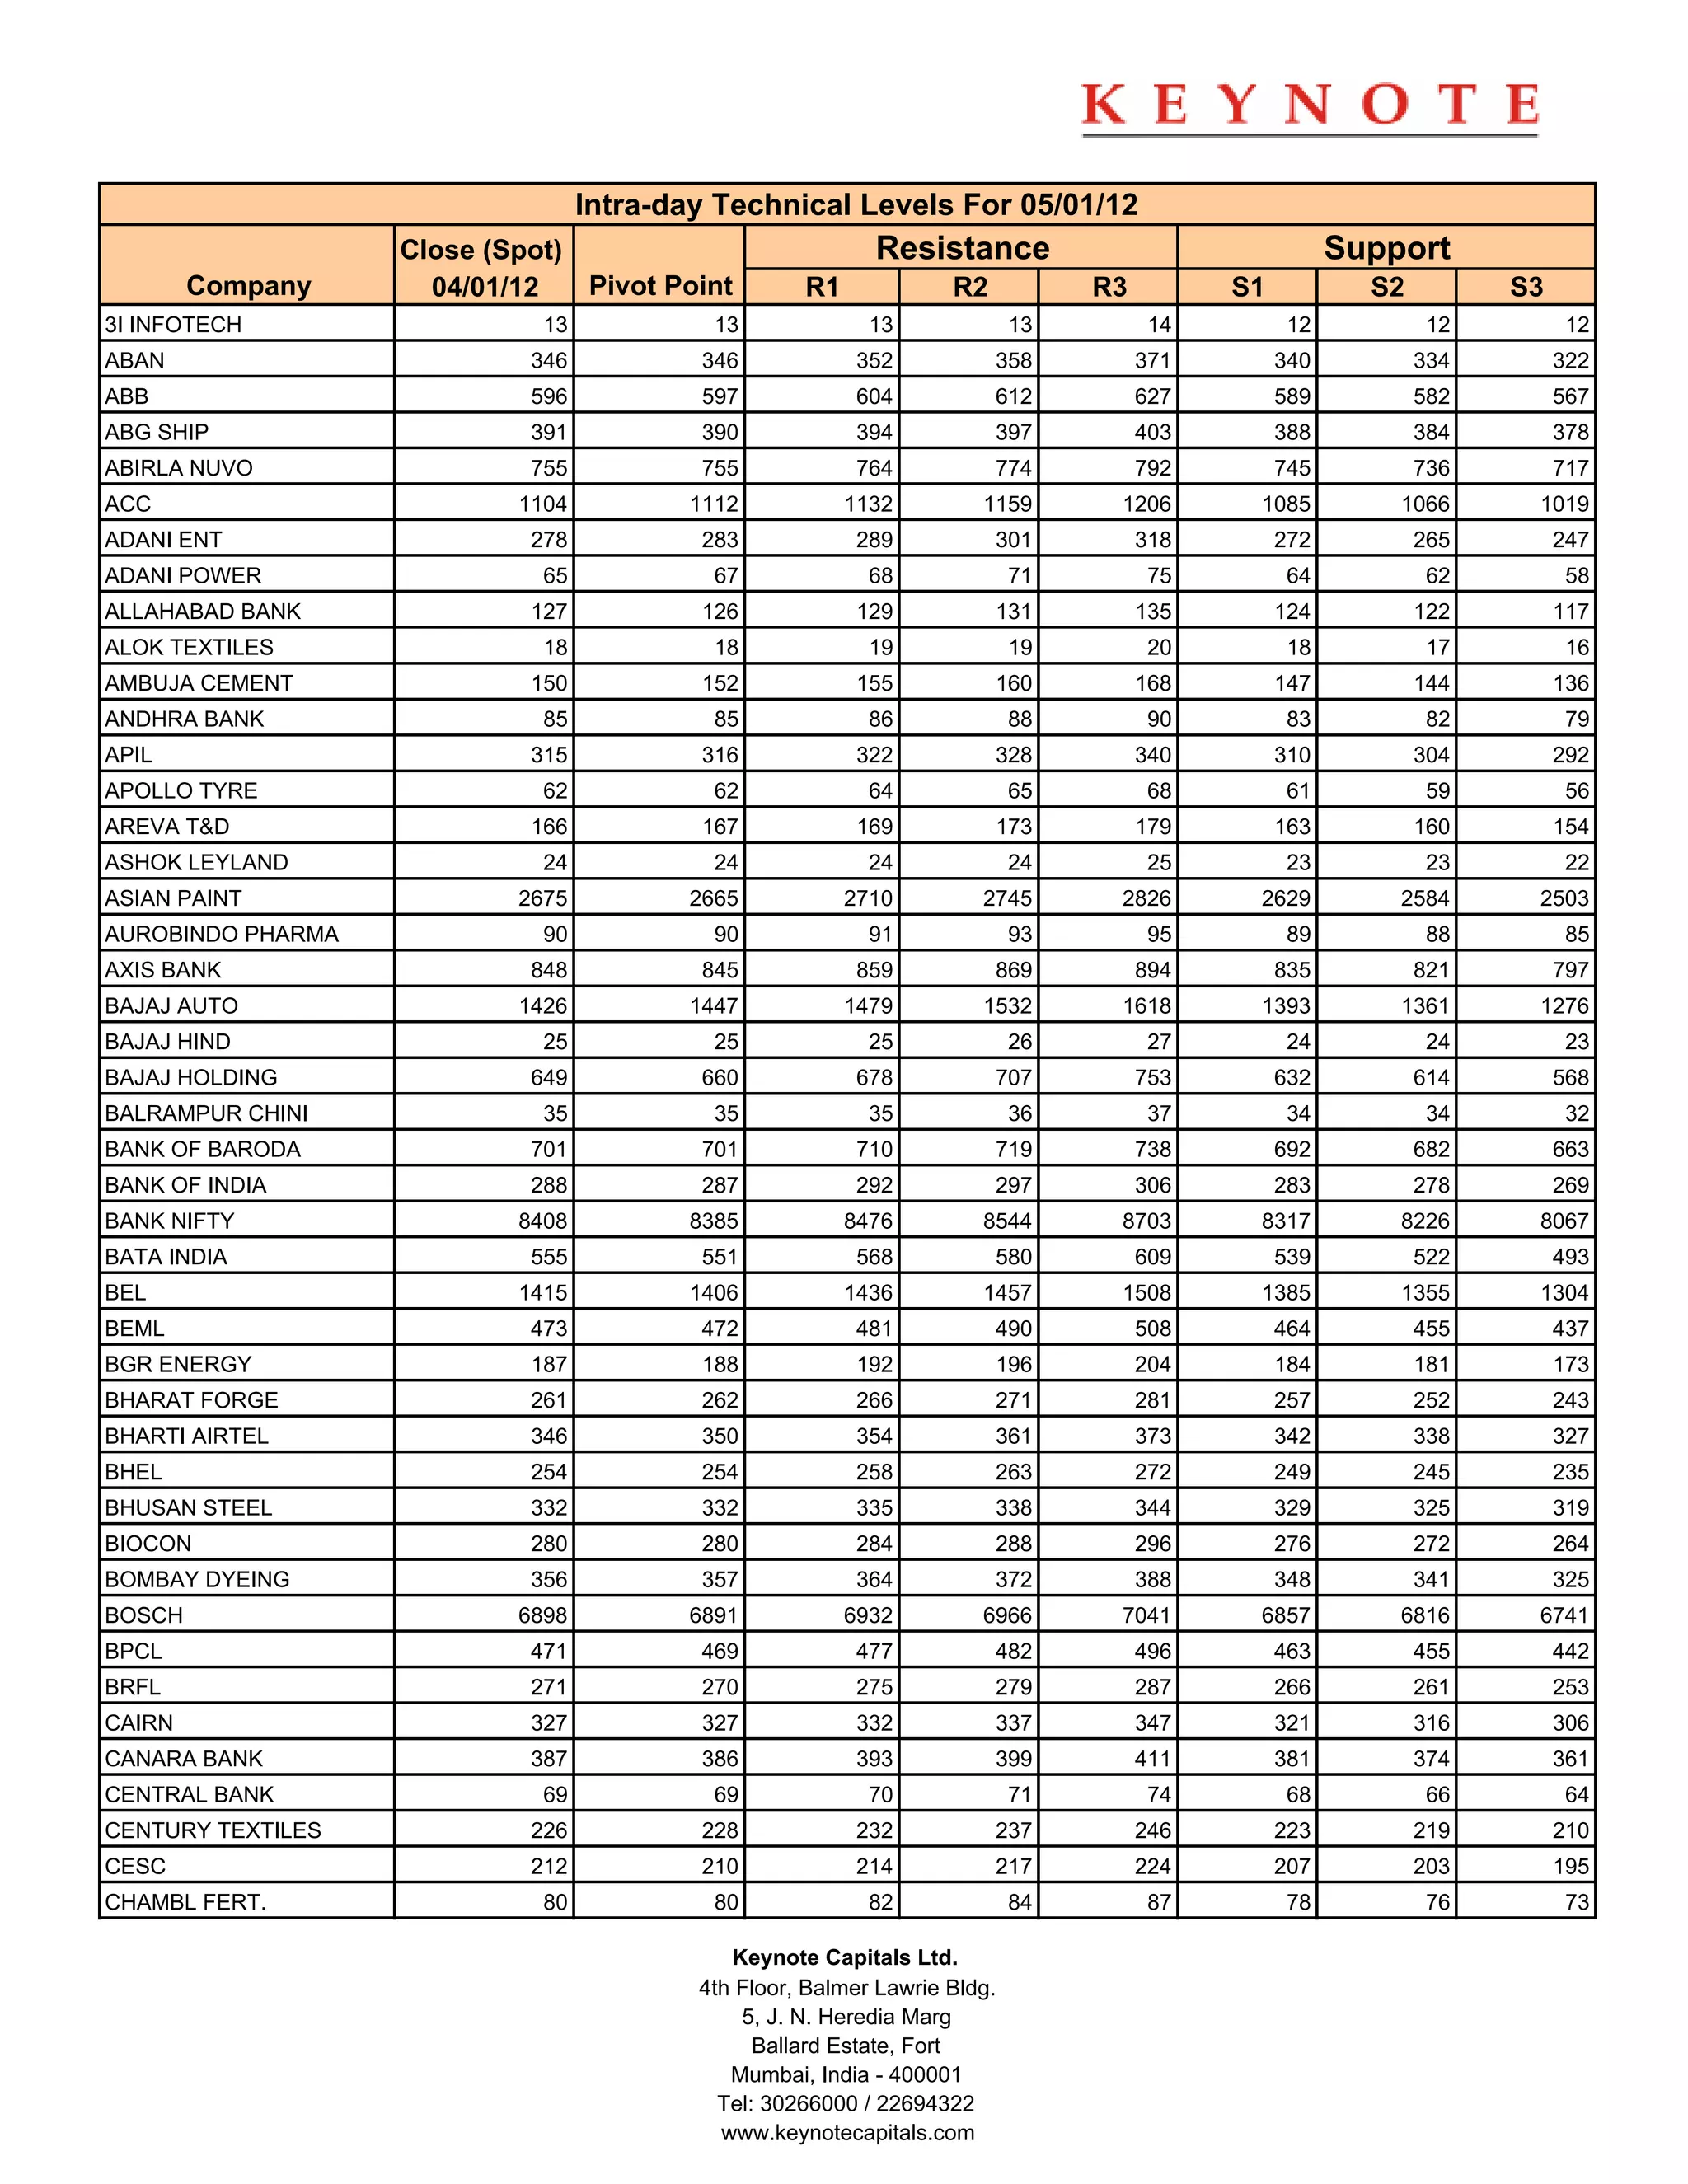
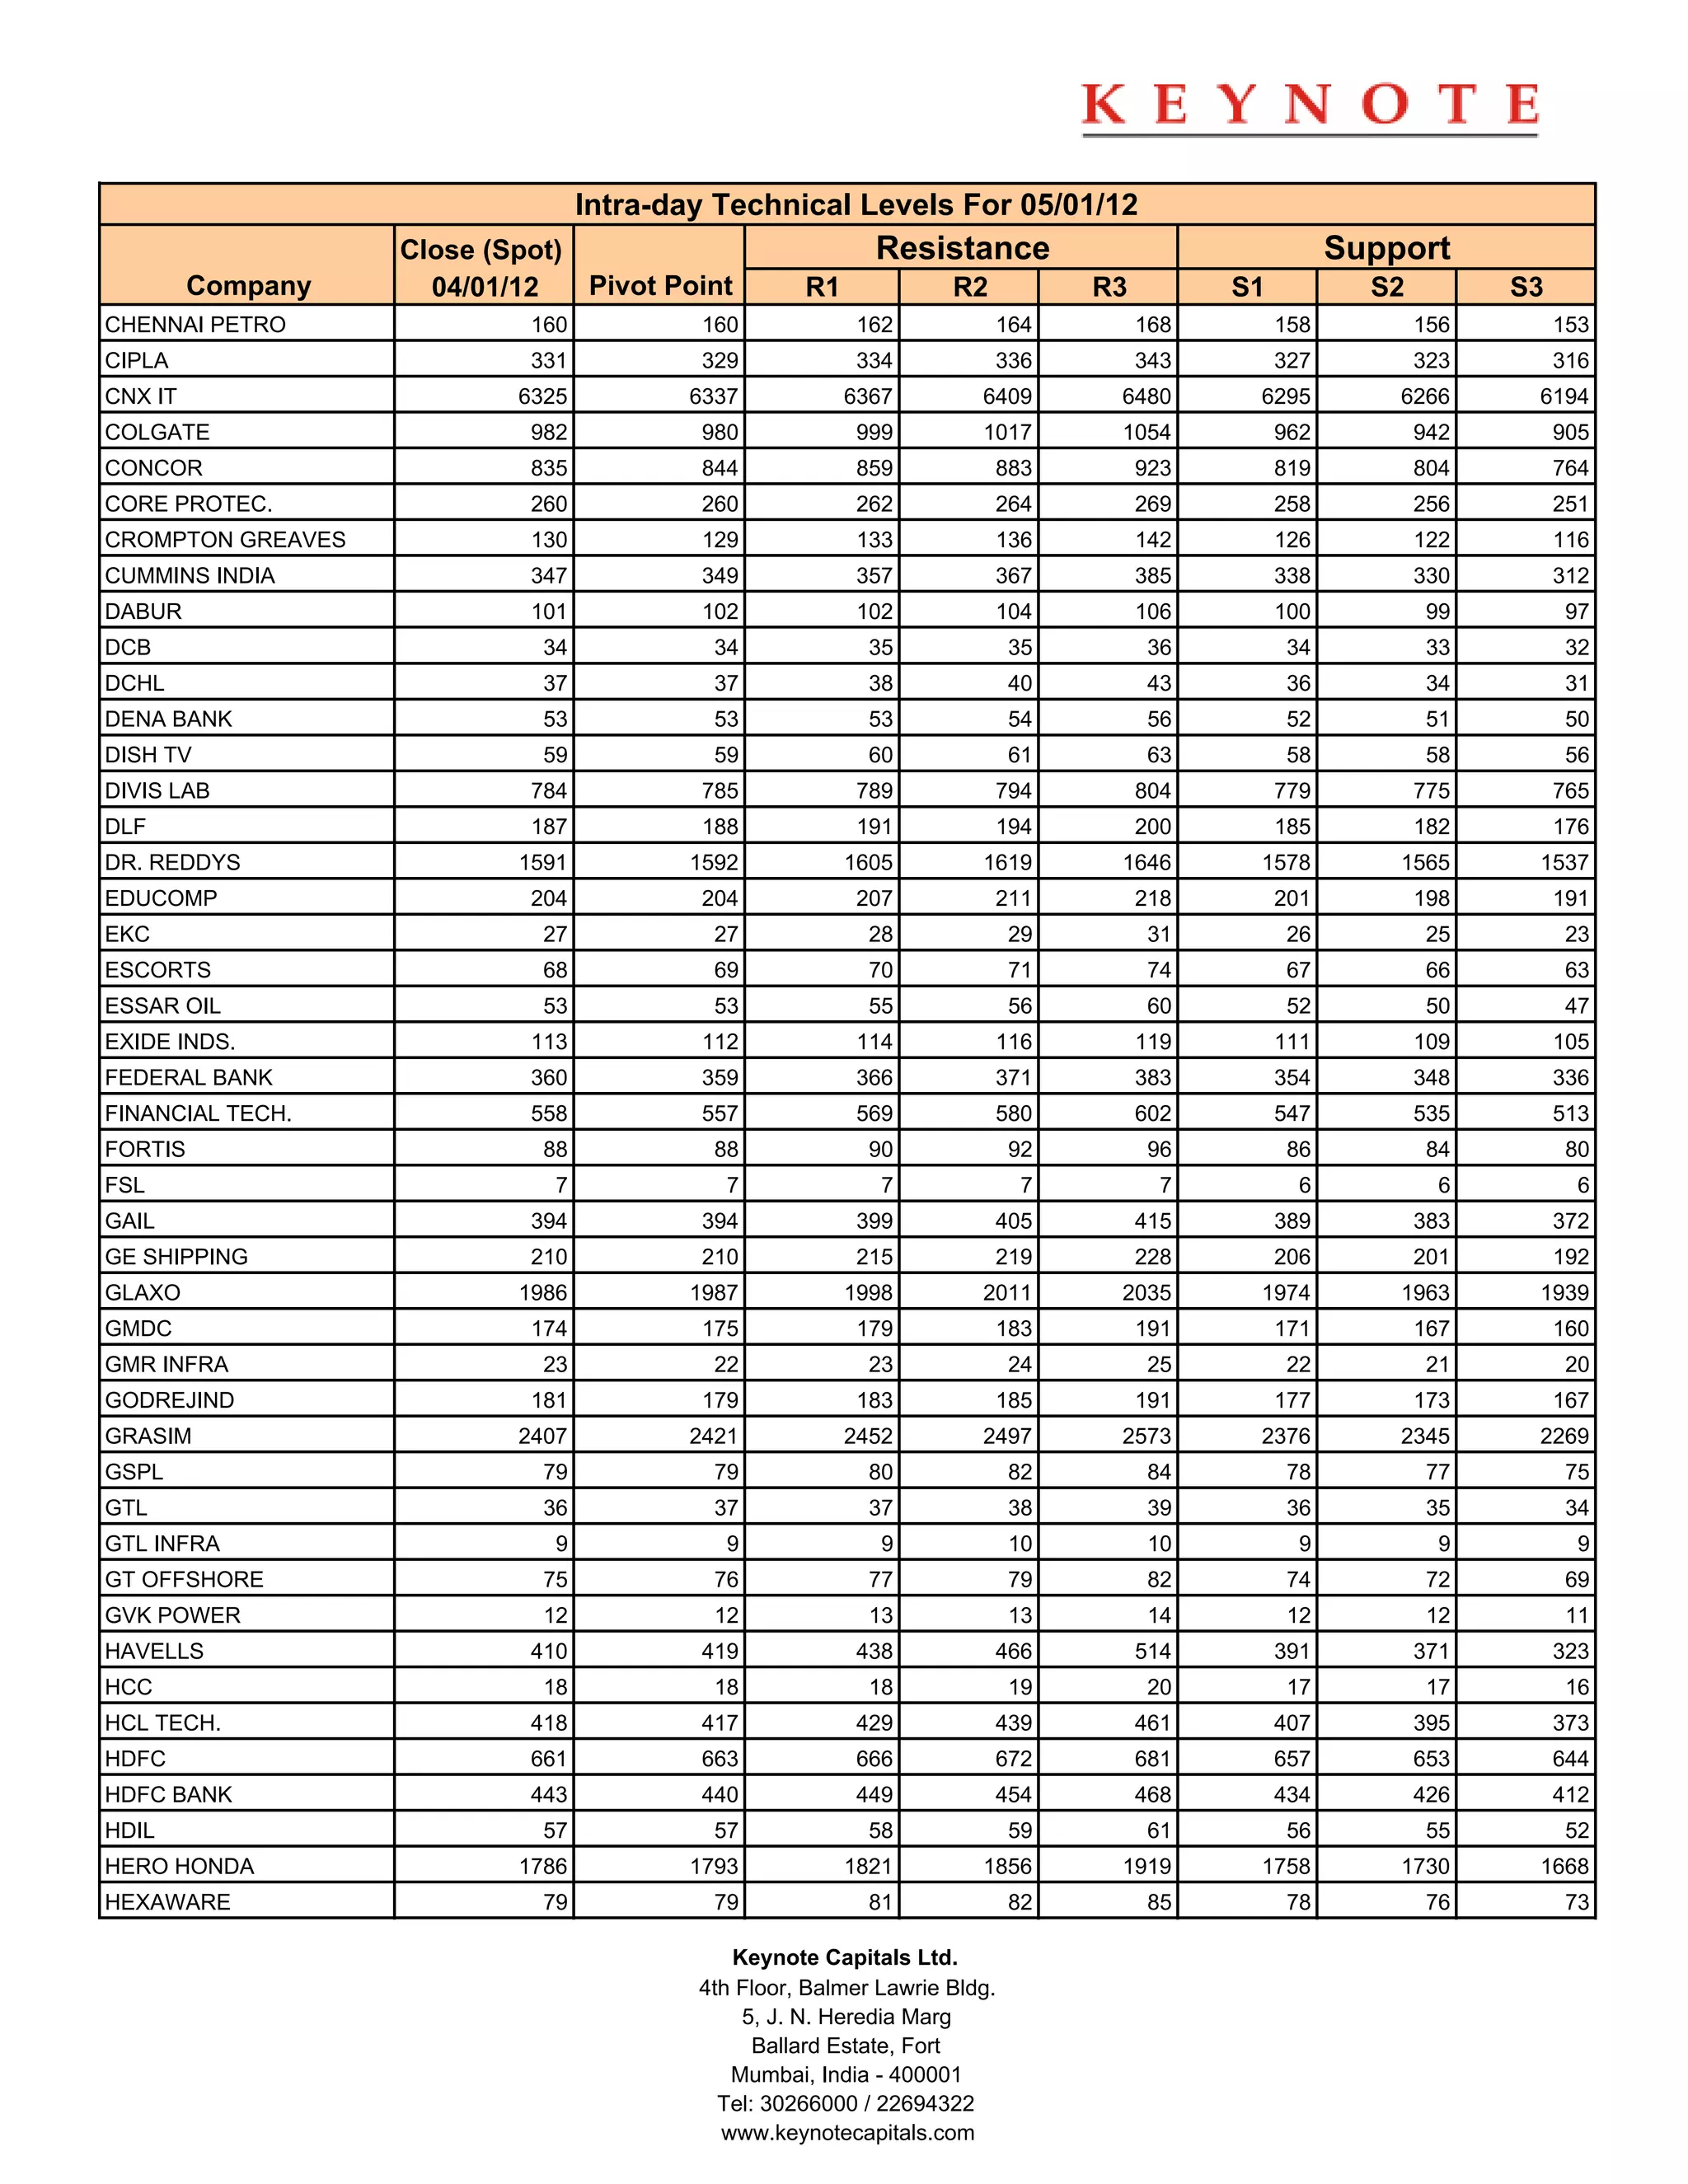
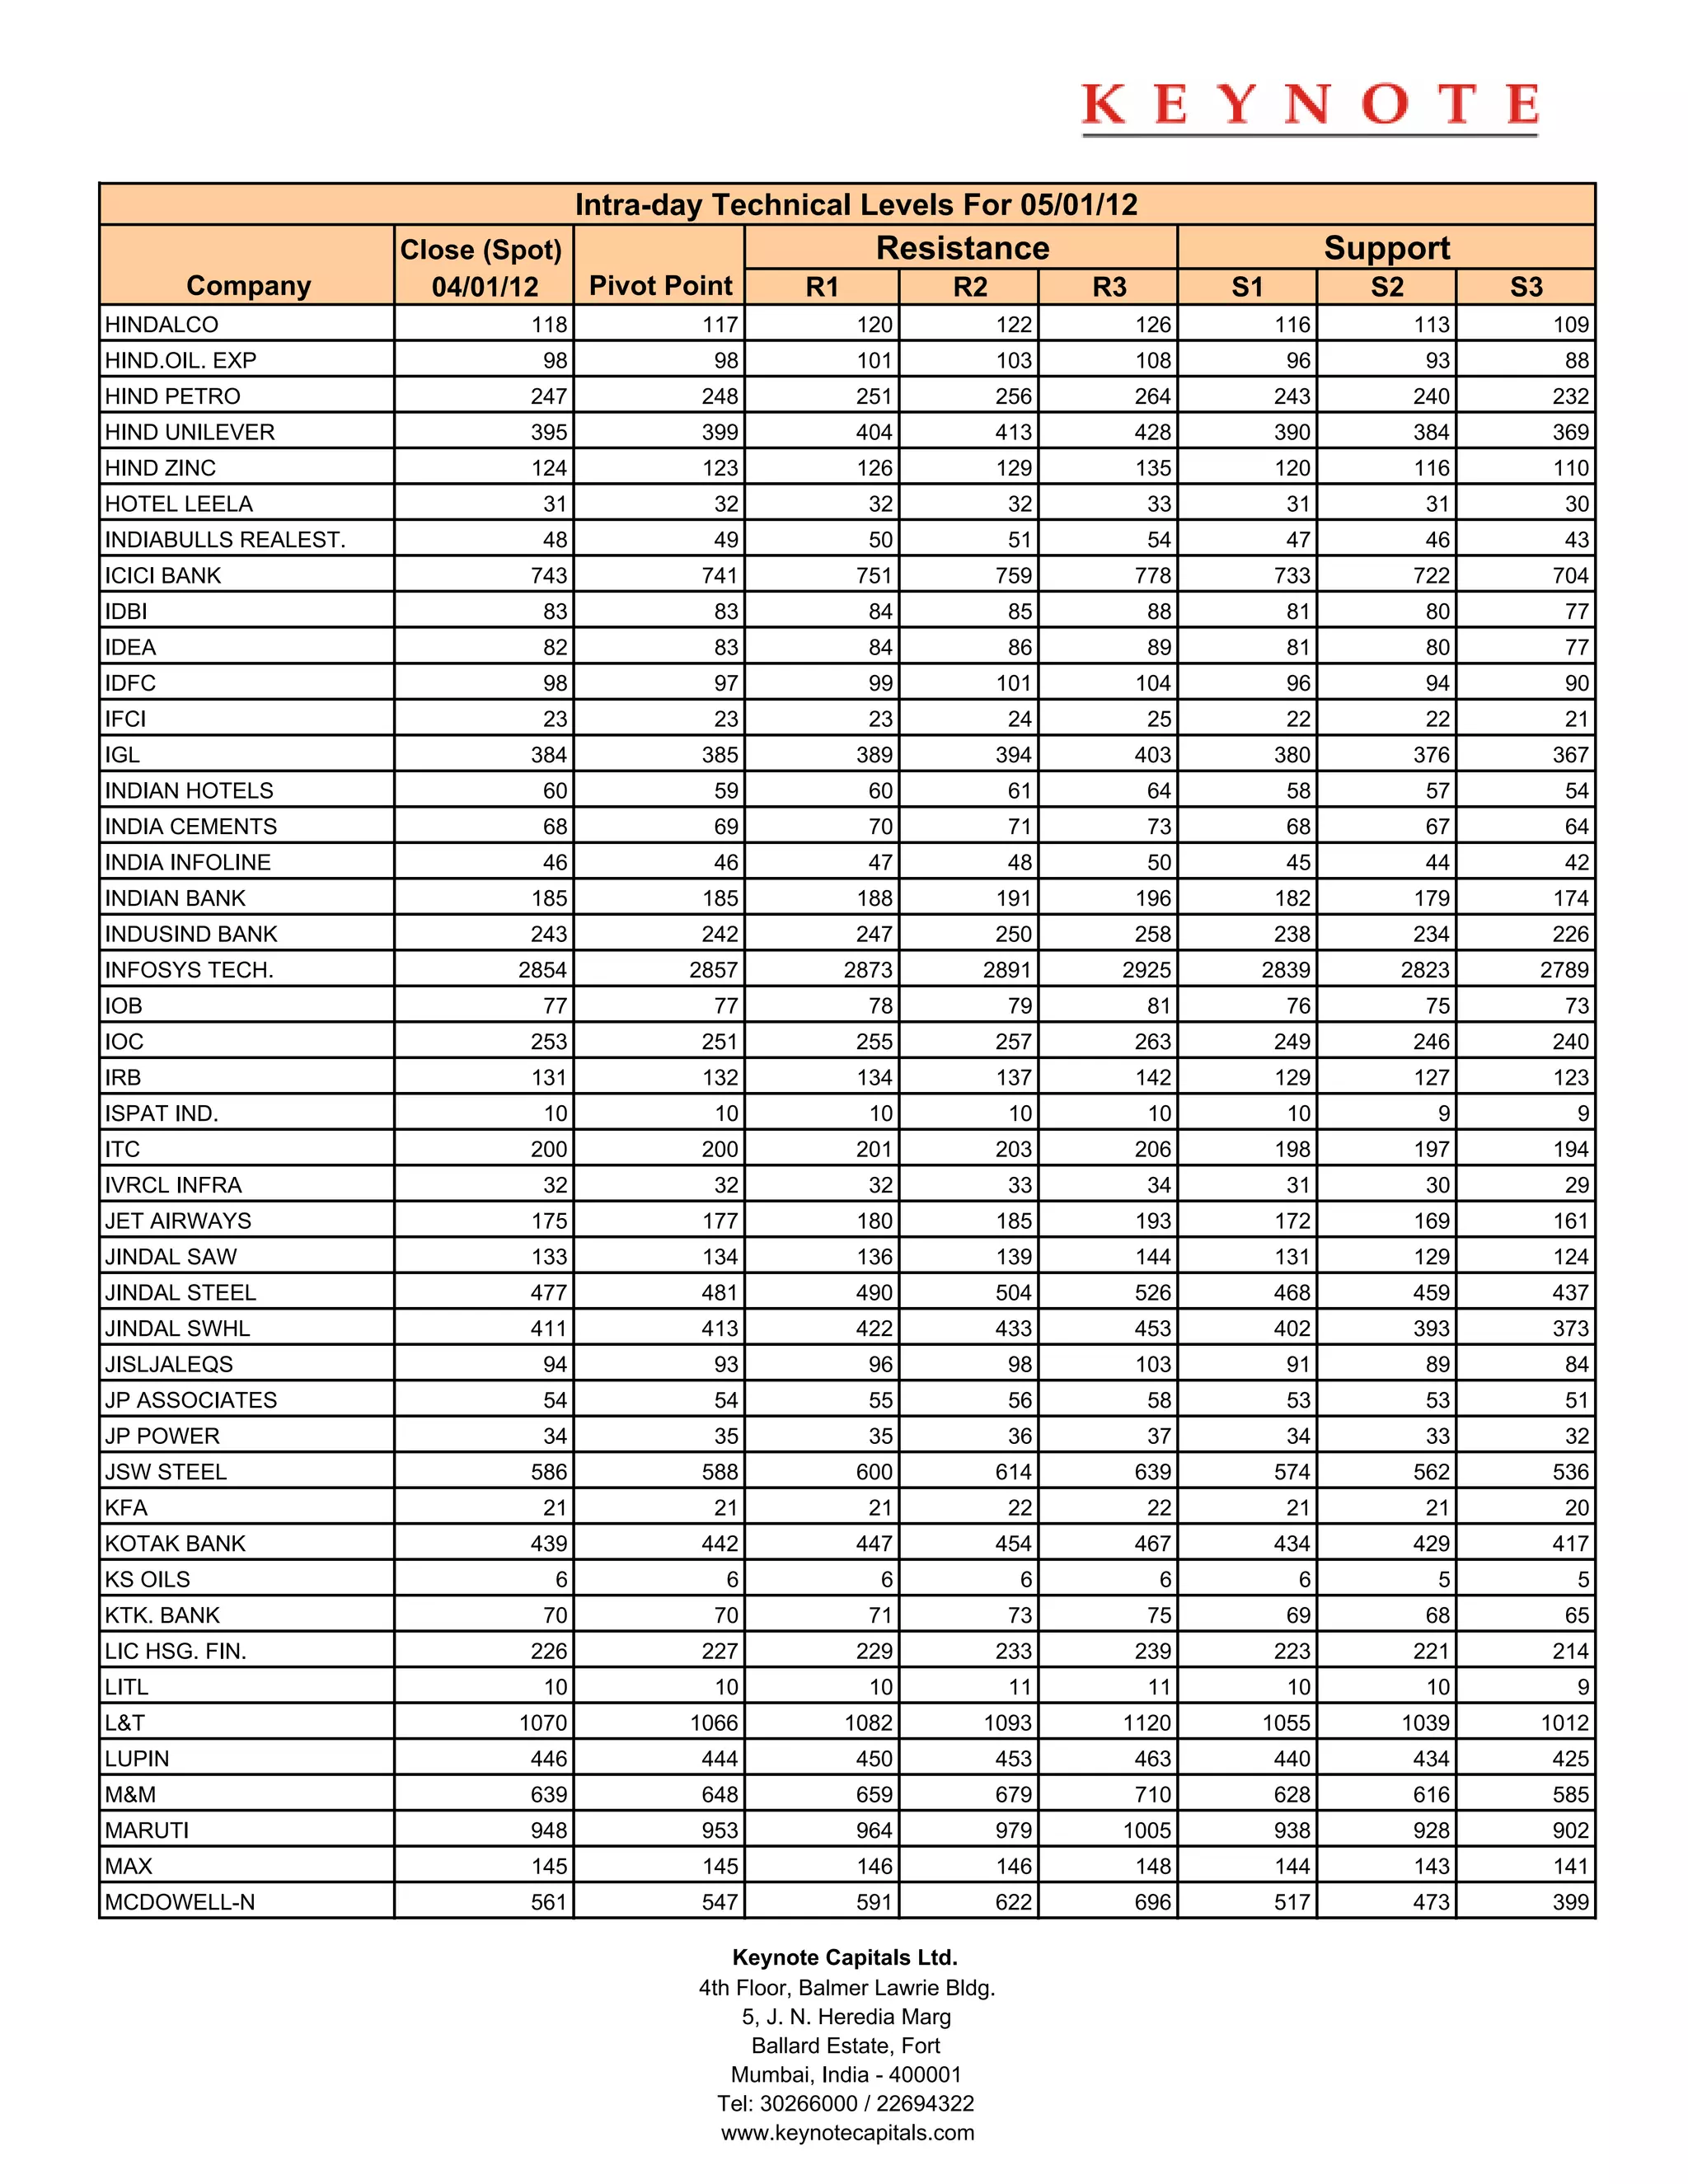
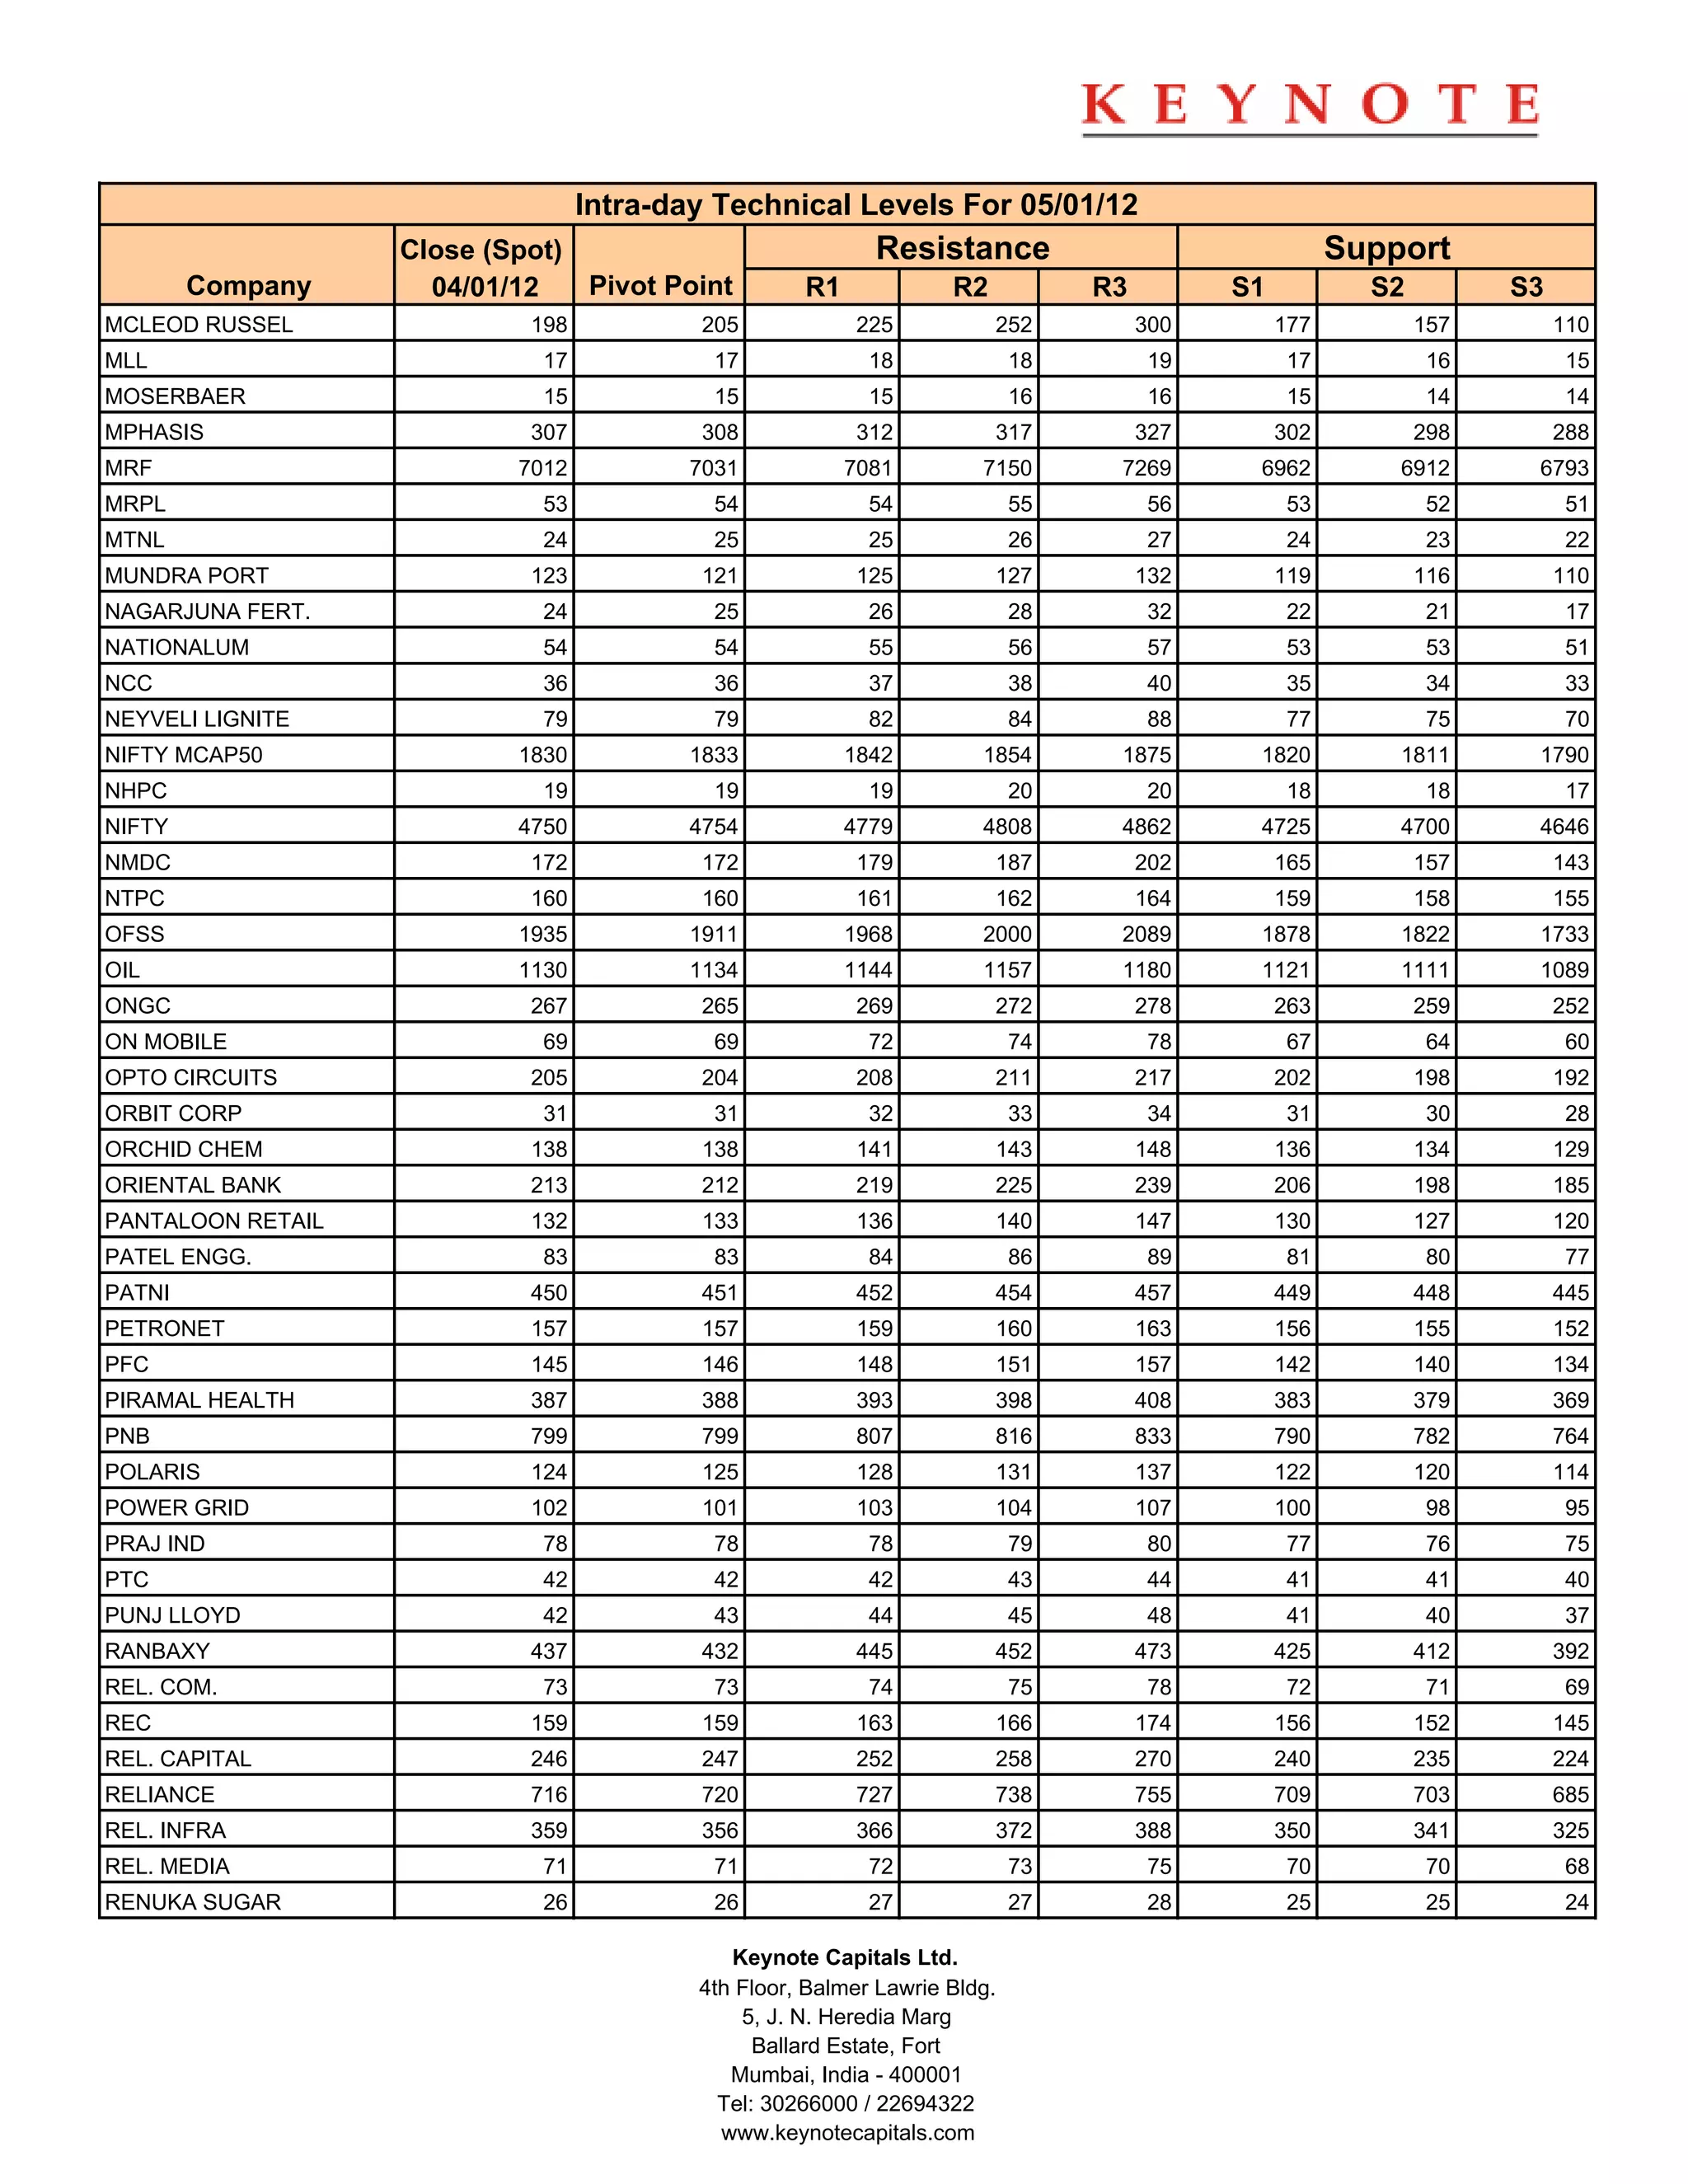
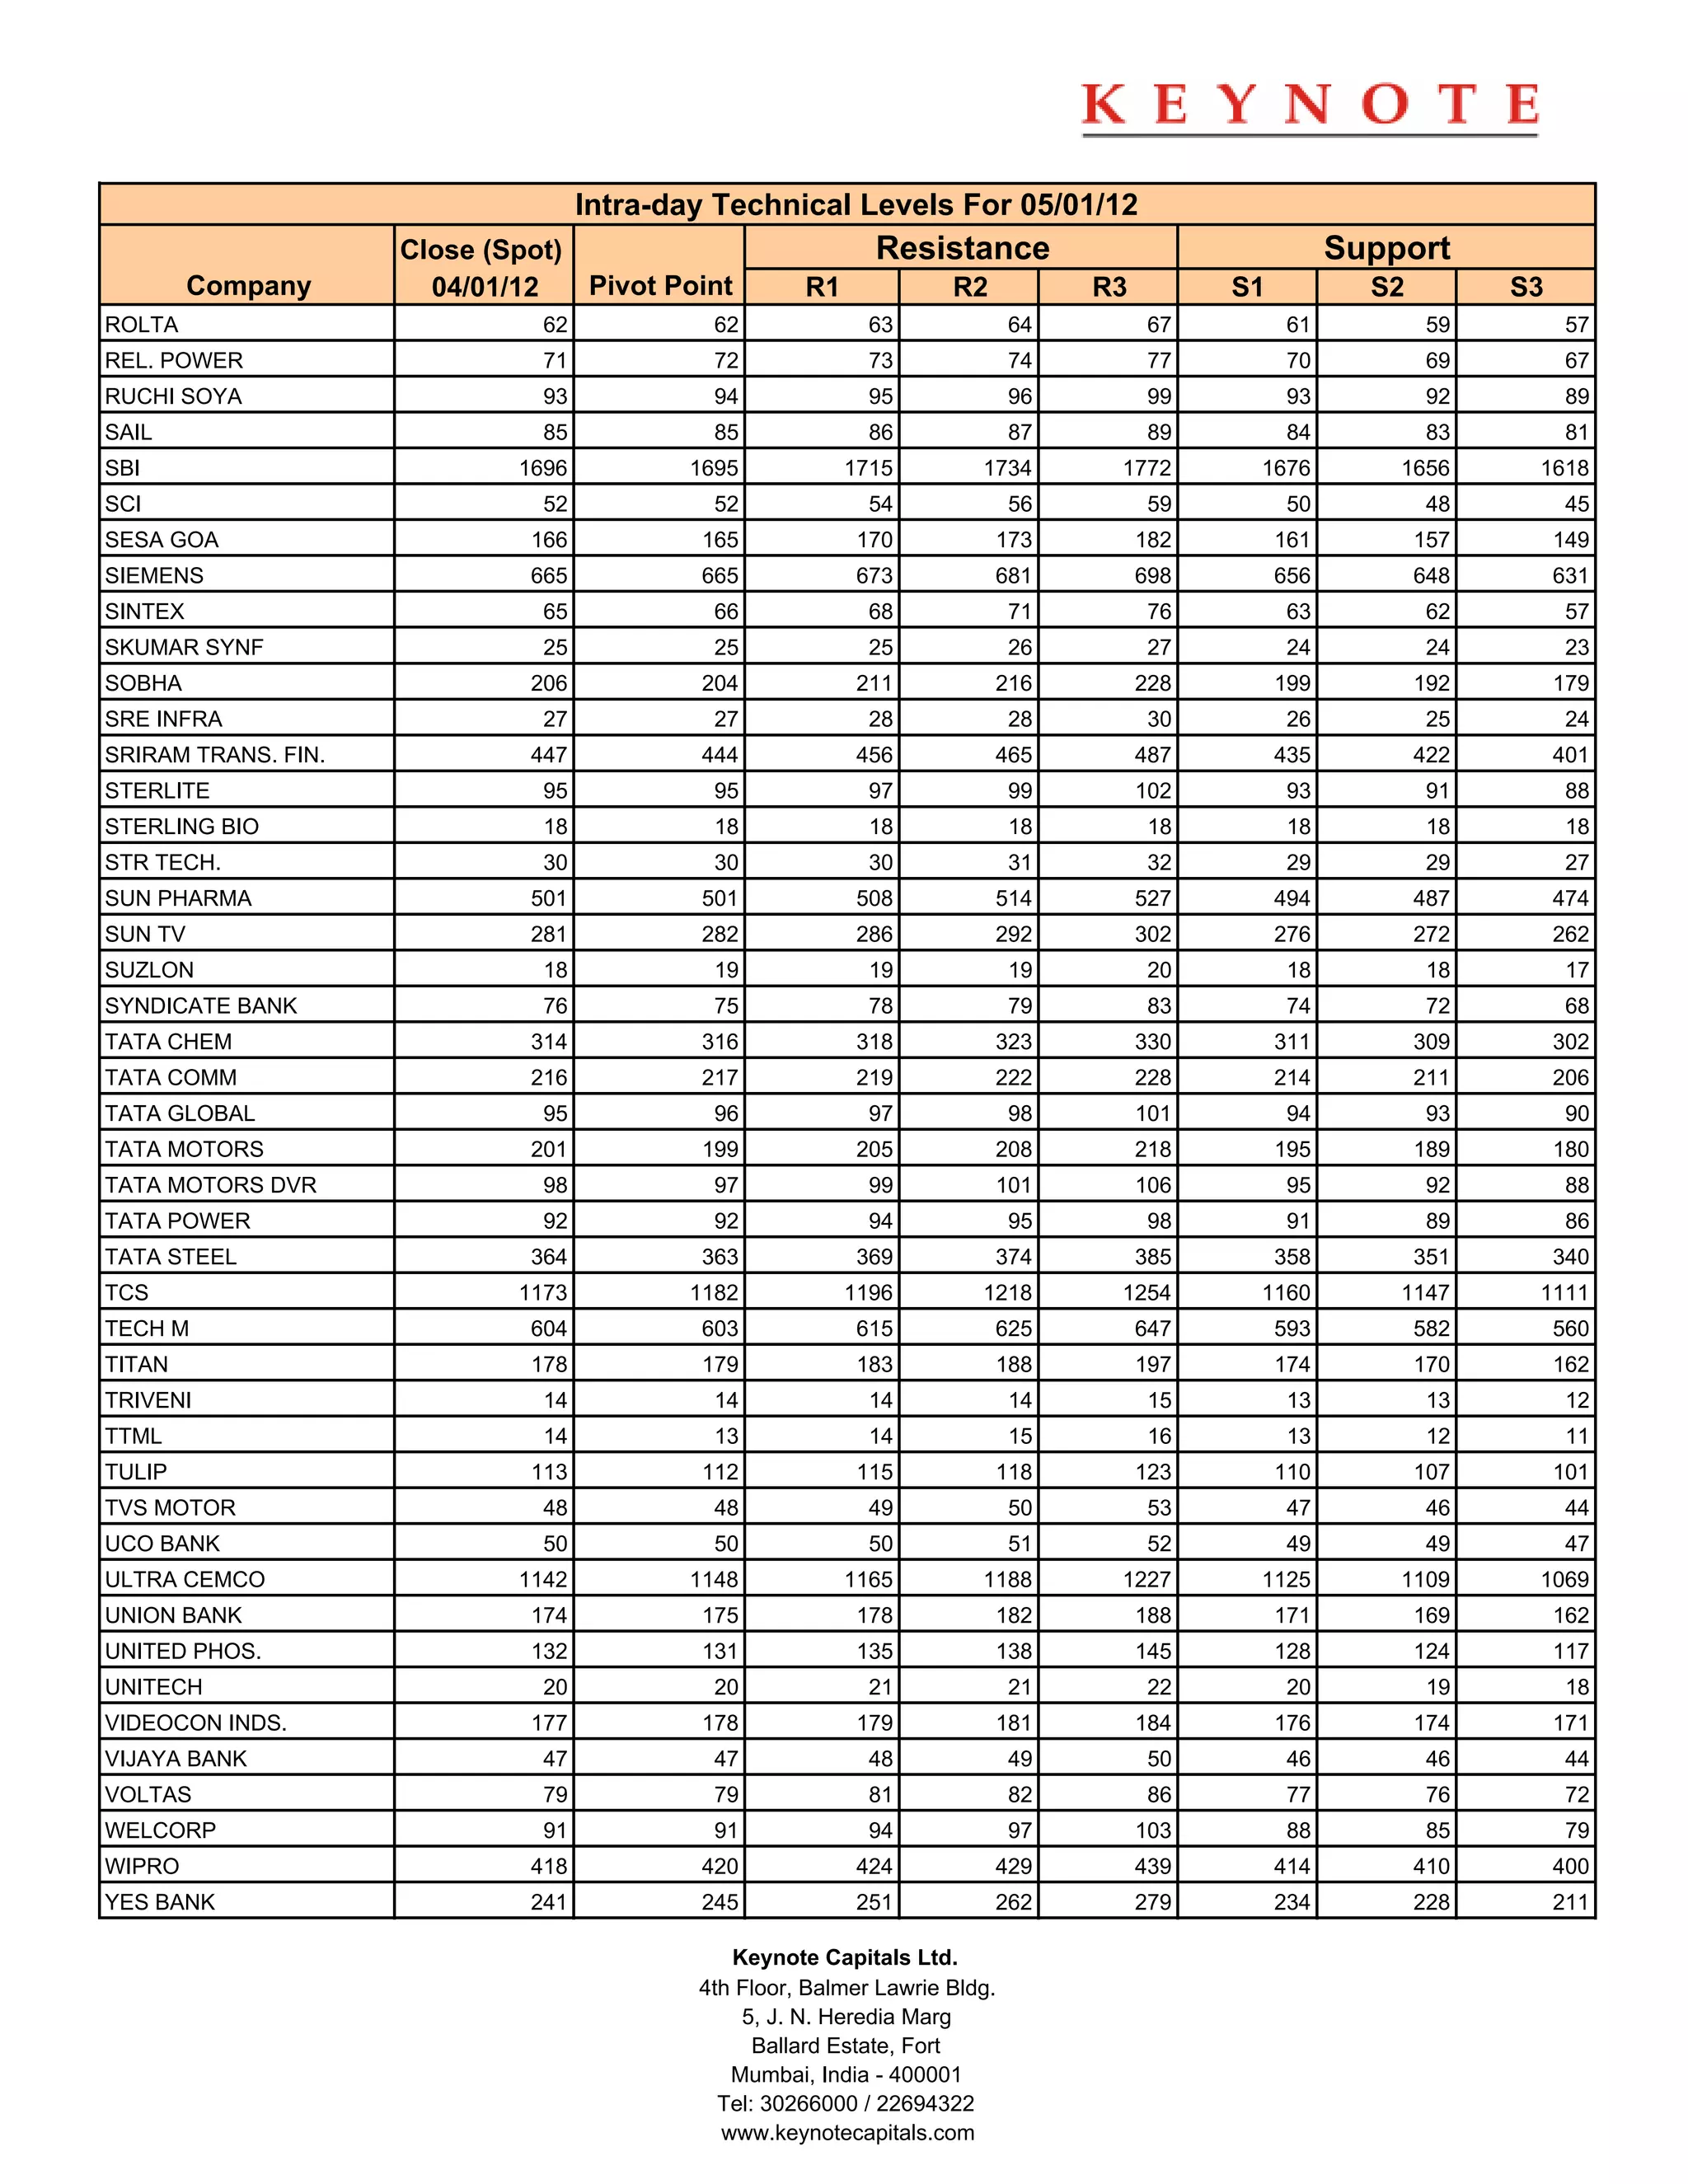

The document provides daily technical levels for various stocks traded on the Indian stock market, including pivot points and resistance and support levels. For each stock, it lists the previous day's closing price, the pivot point, and then resistance levels R1, R2, and R3 above the pivot point and support levels S1, S2, and S3 below the pivot point. This technical analysis is intended to identify price points where buying or selling pressure may increase for intra-day trading on May 1, 2012.


![[Webinar] How to Use Interactive Elements in Your Articles to Maximize Engage...](https://cdn.slidesharecdn.com/ss_thumbnails/webinar411-150826095518-lva1-app6891-thumbnail.jpg?width=640&height=640&fit=bounds)


