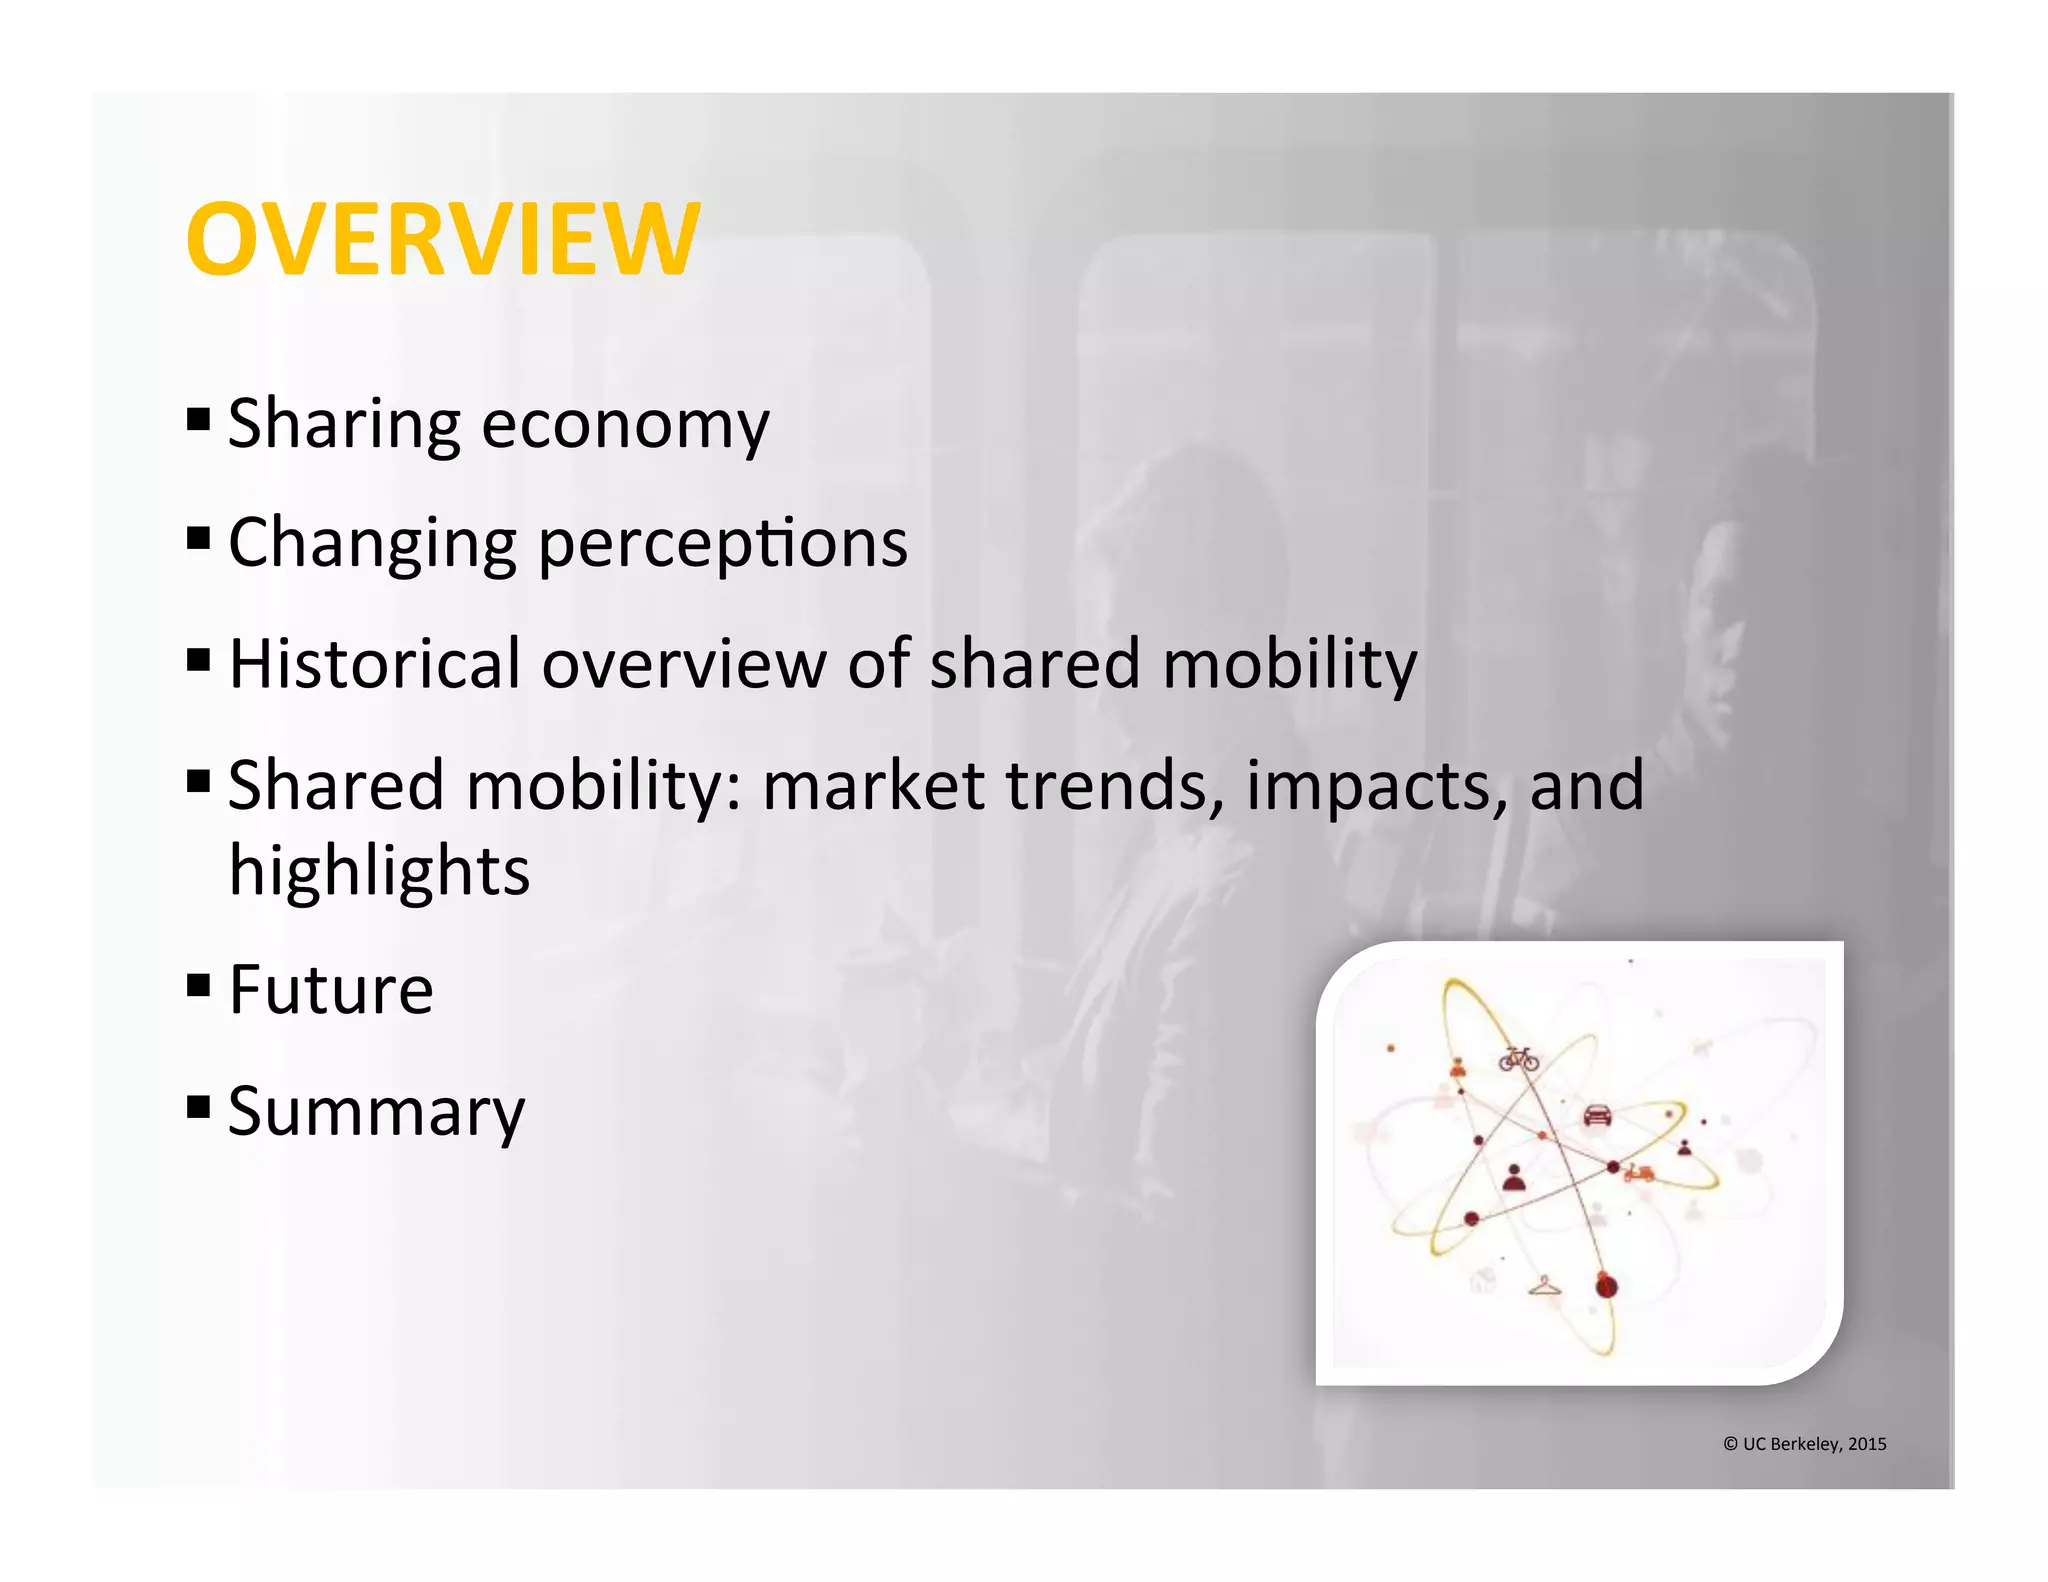
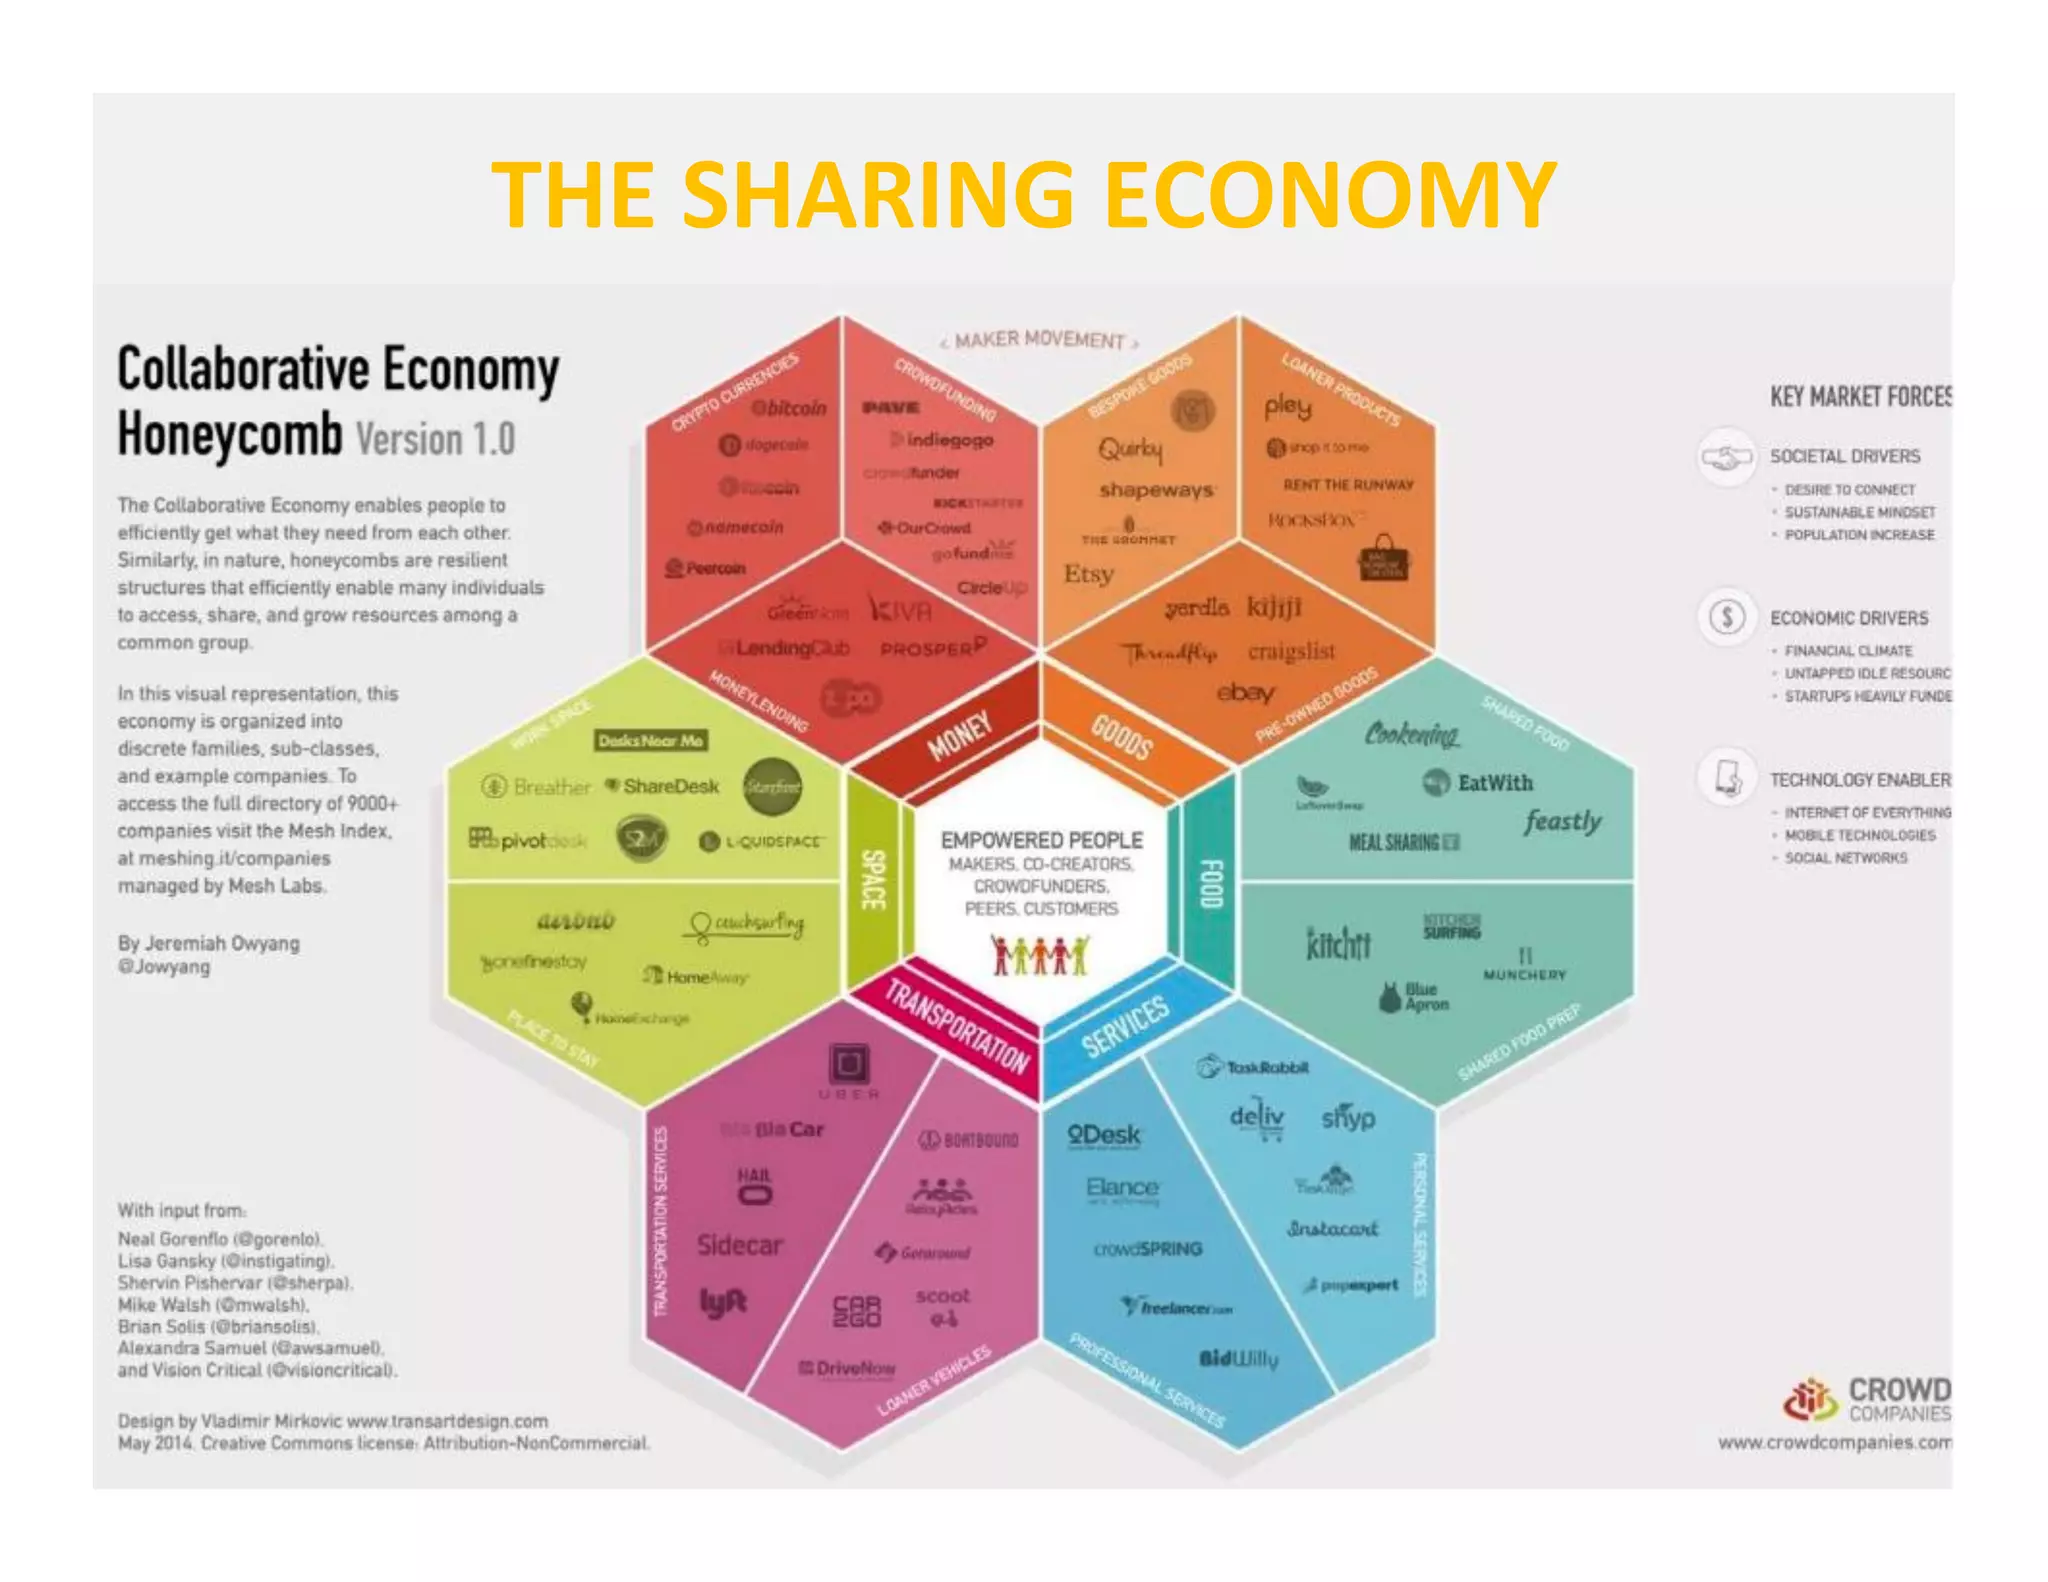
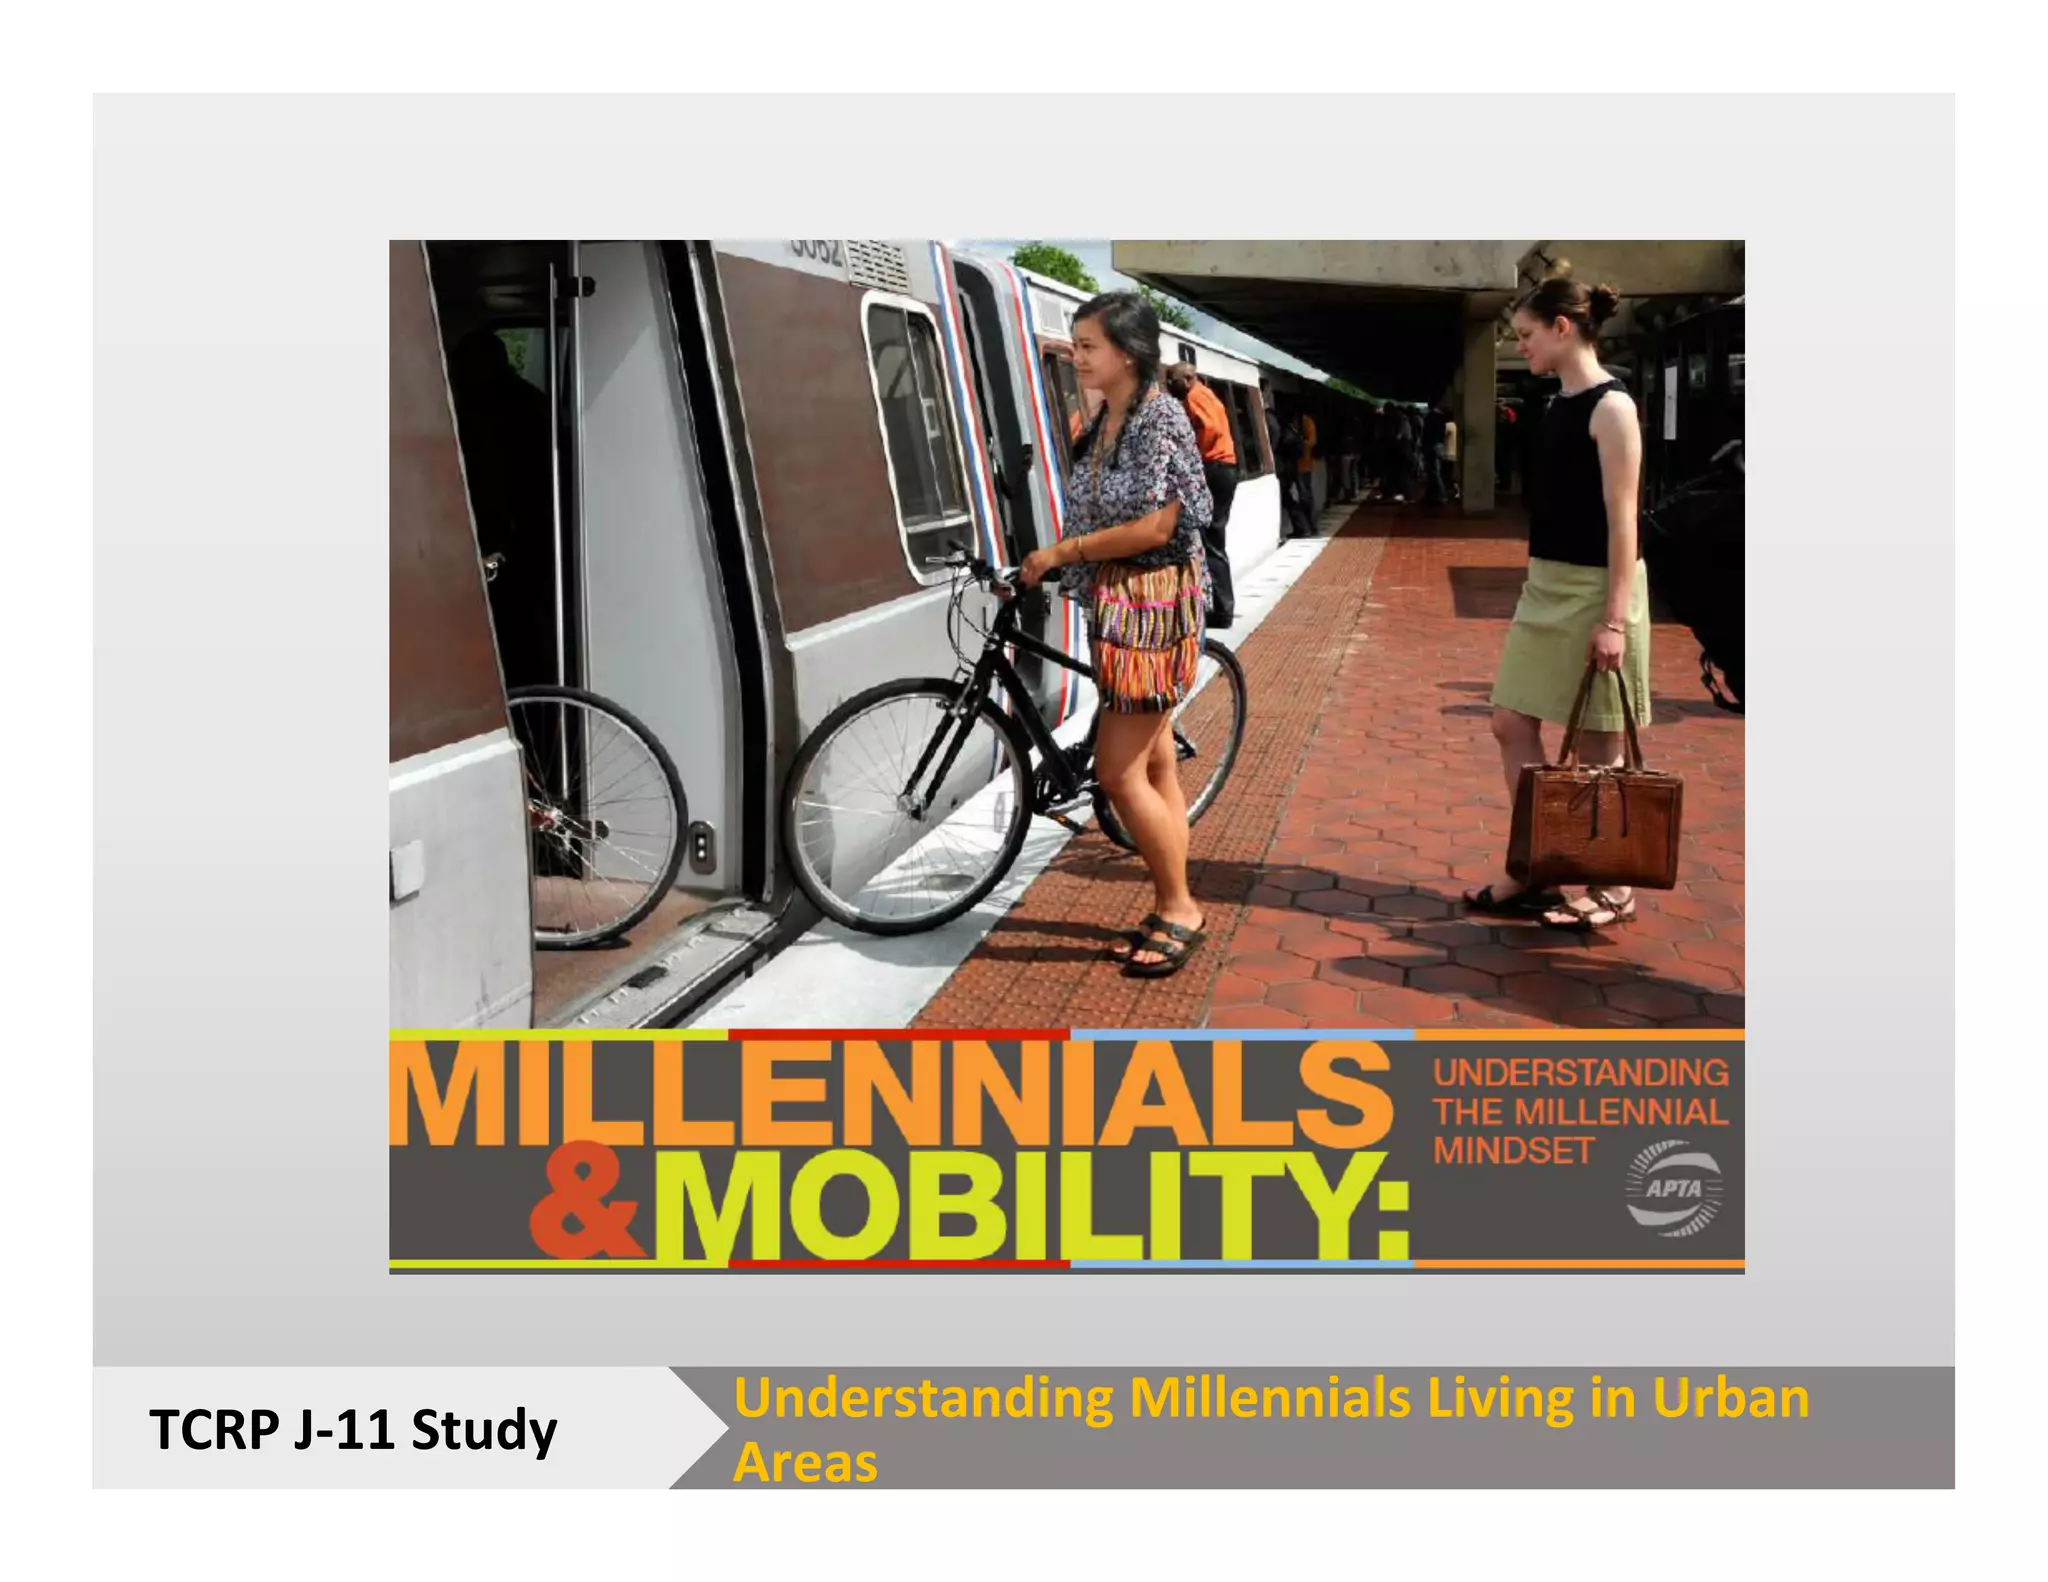
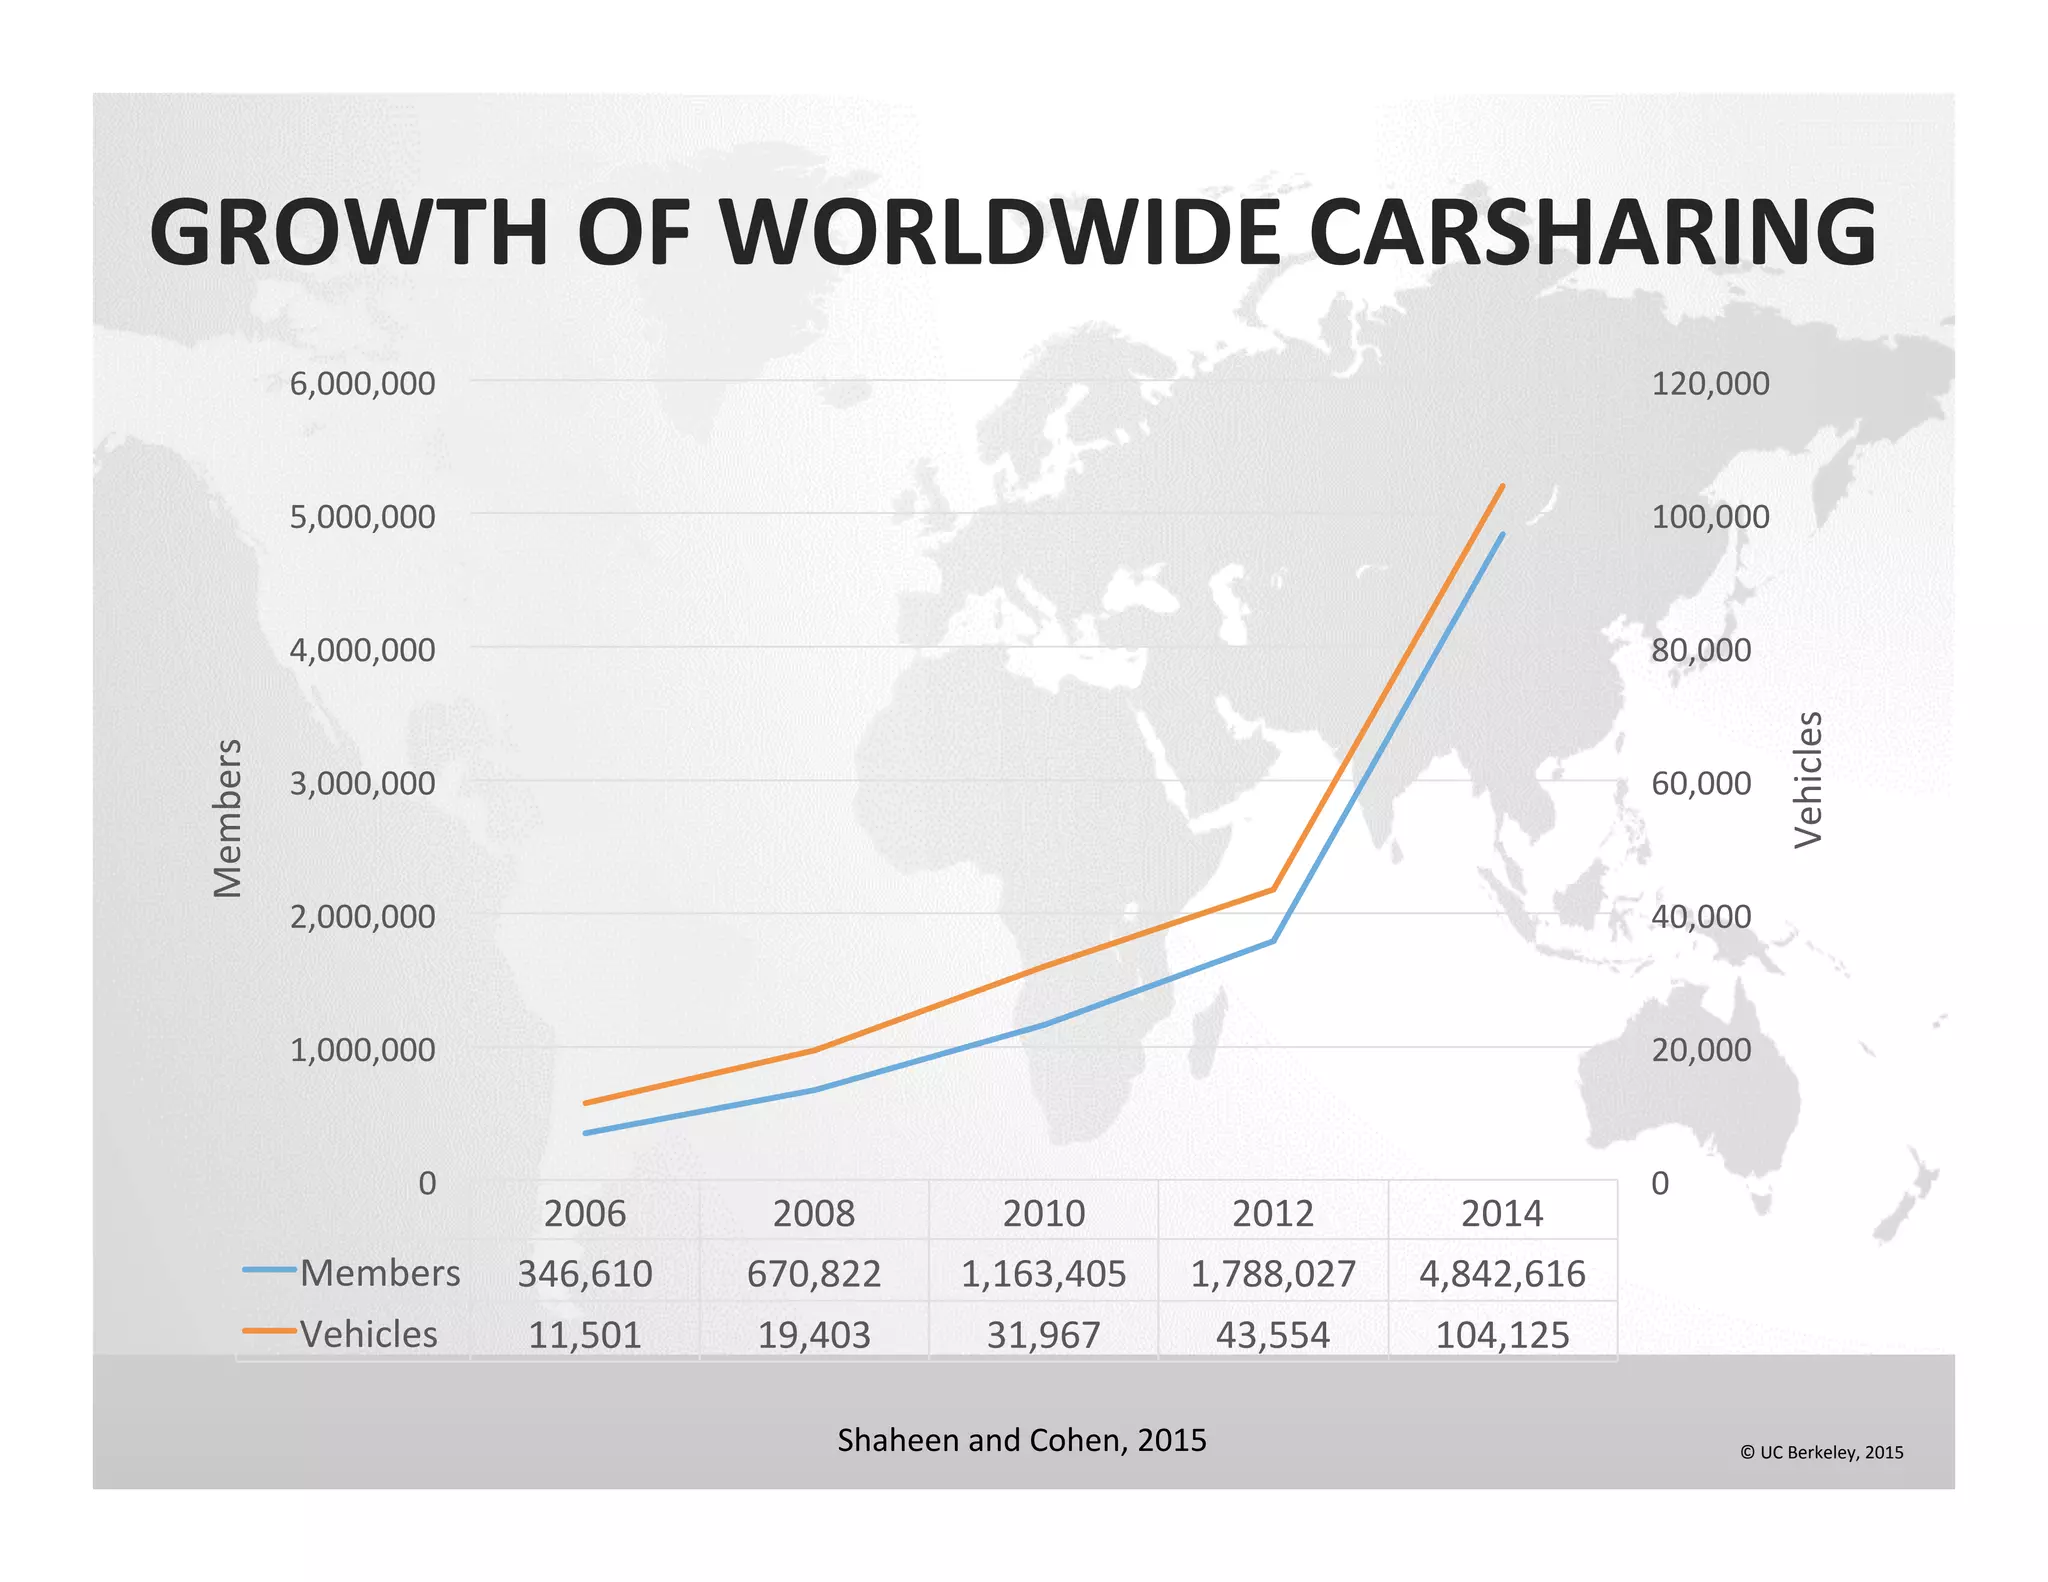
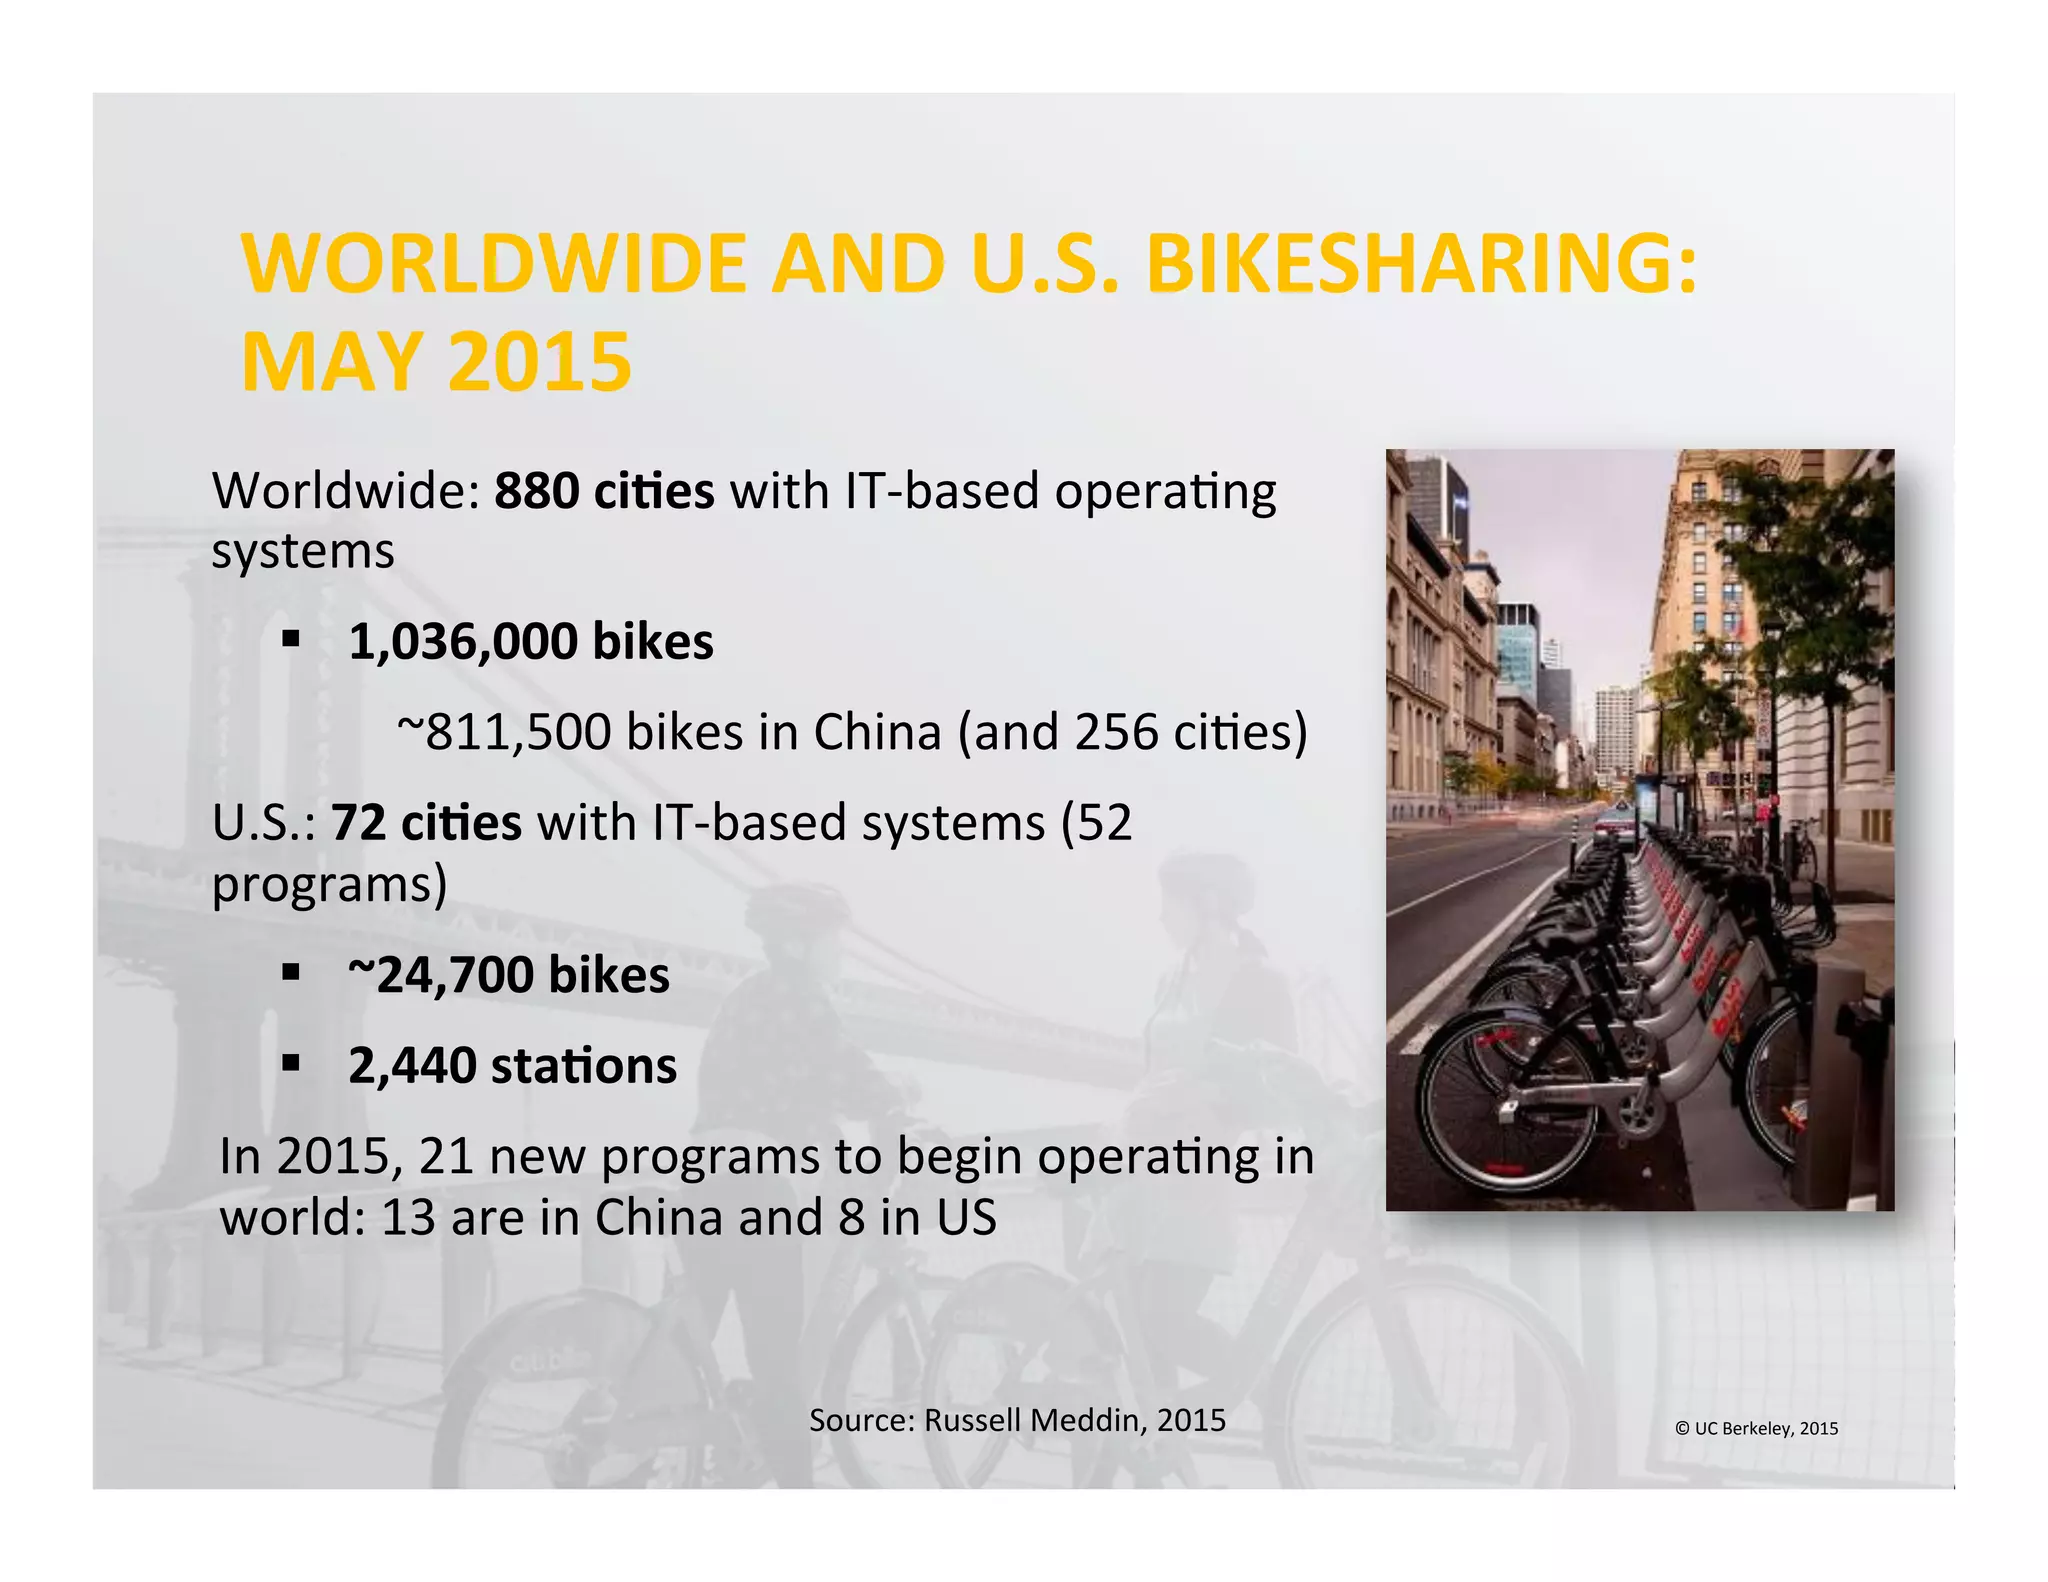
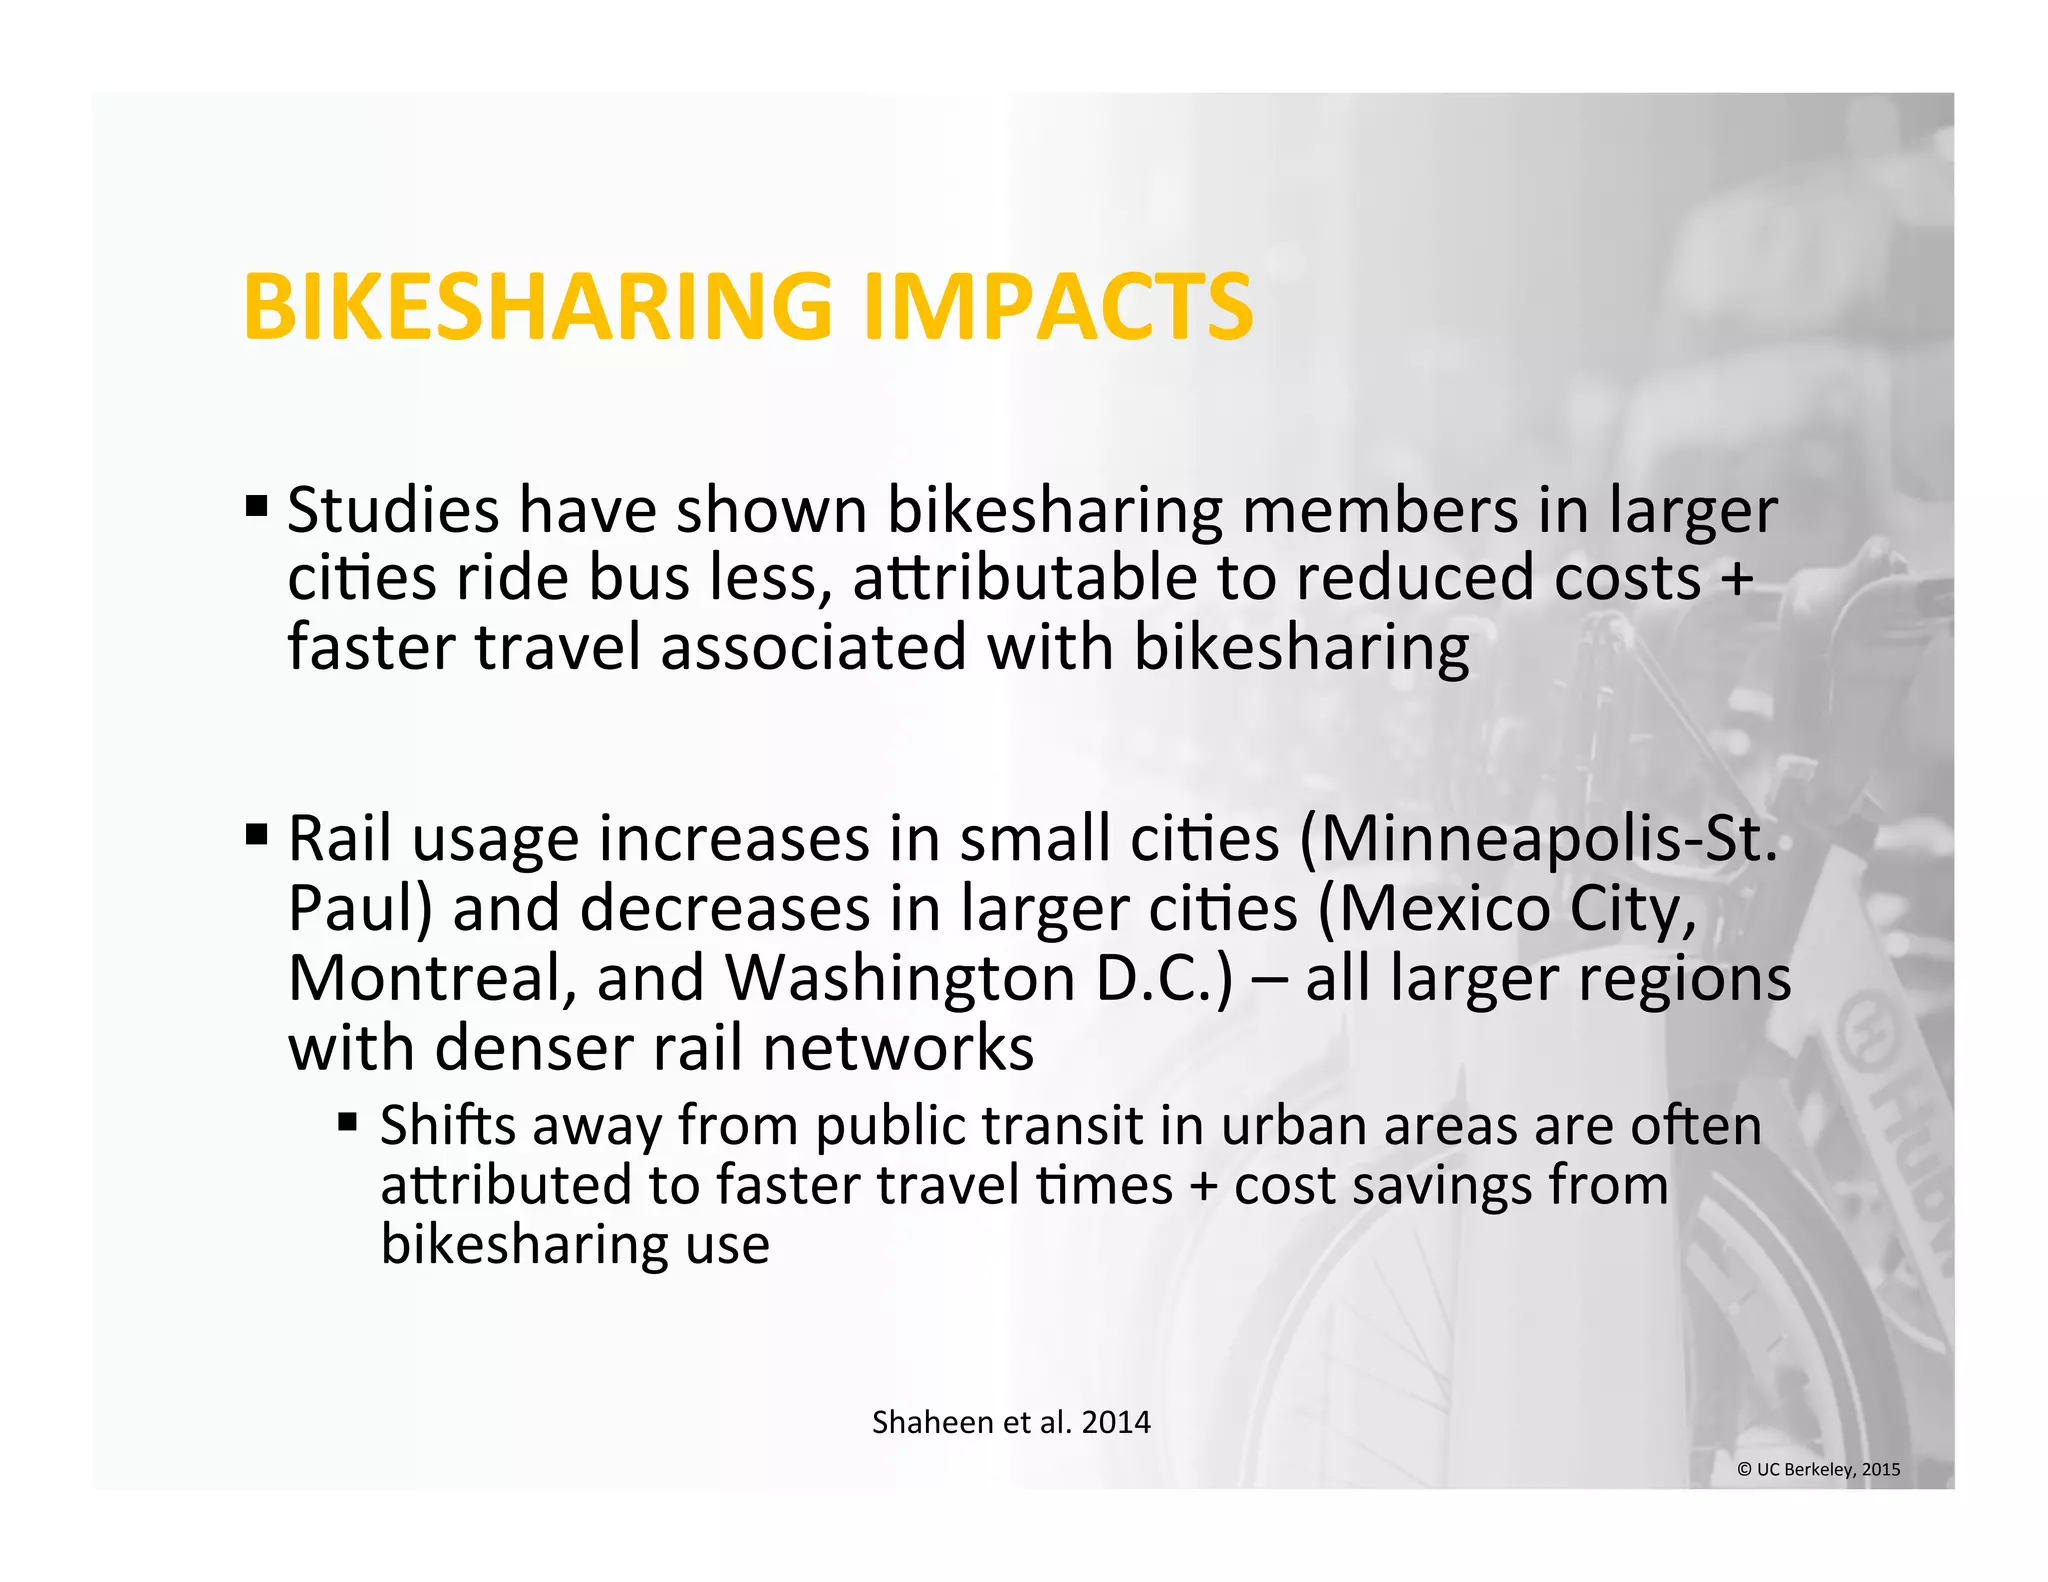
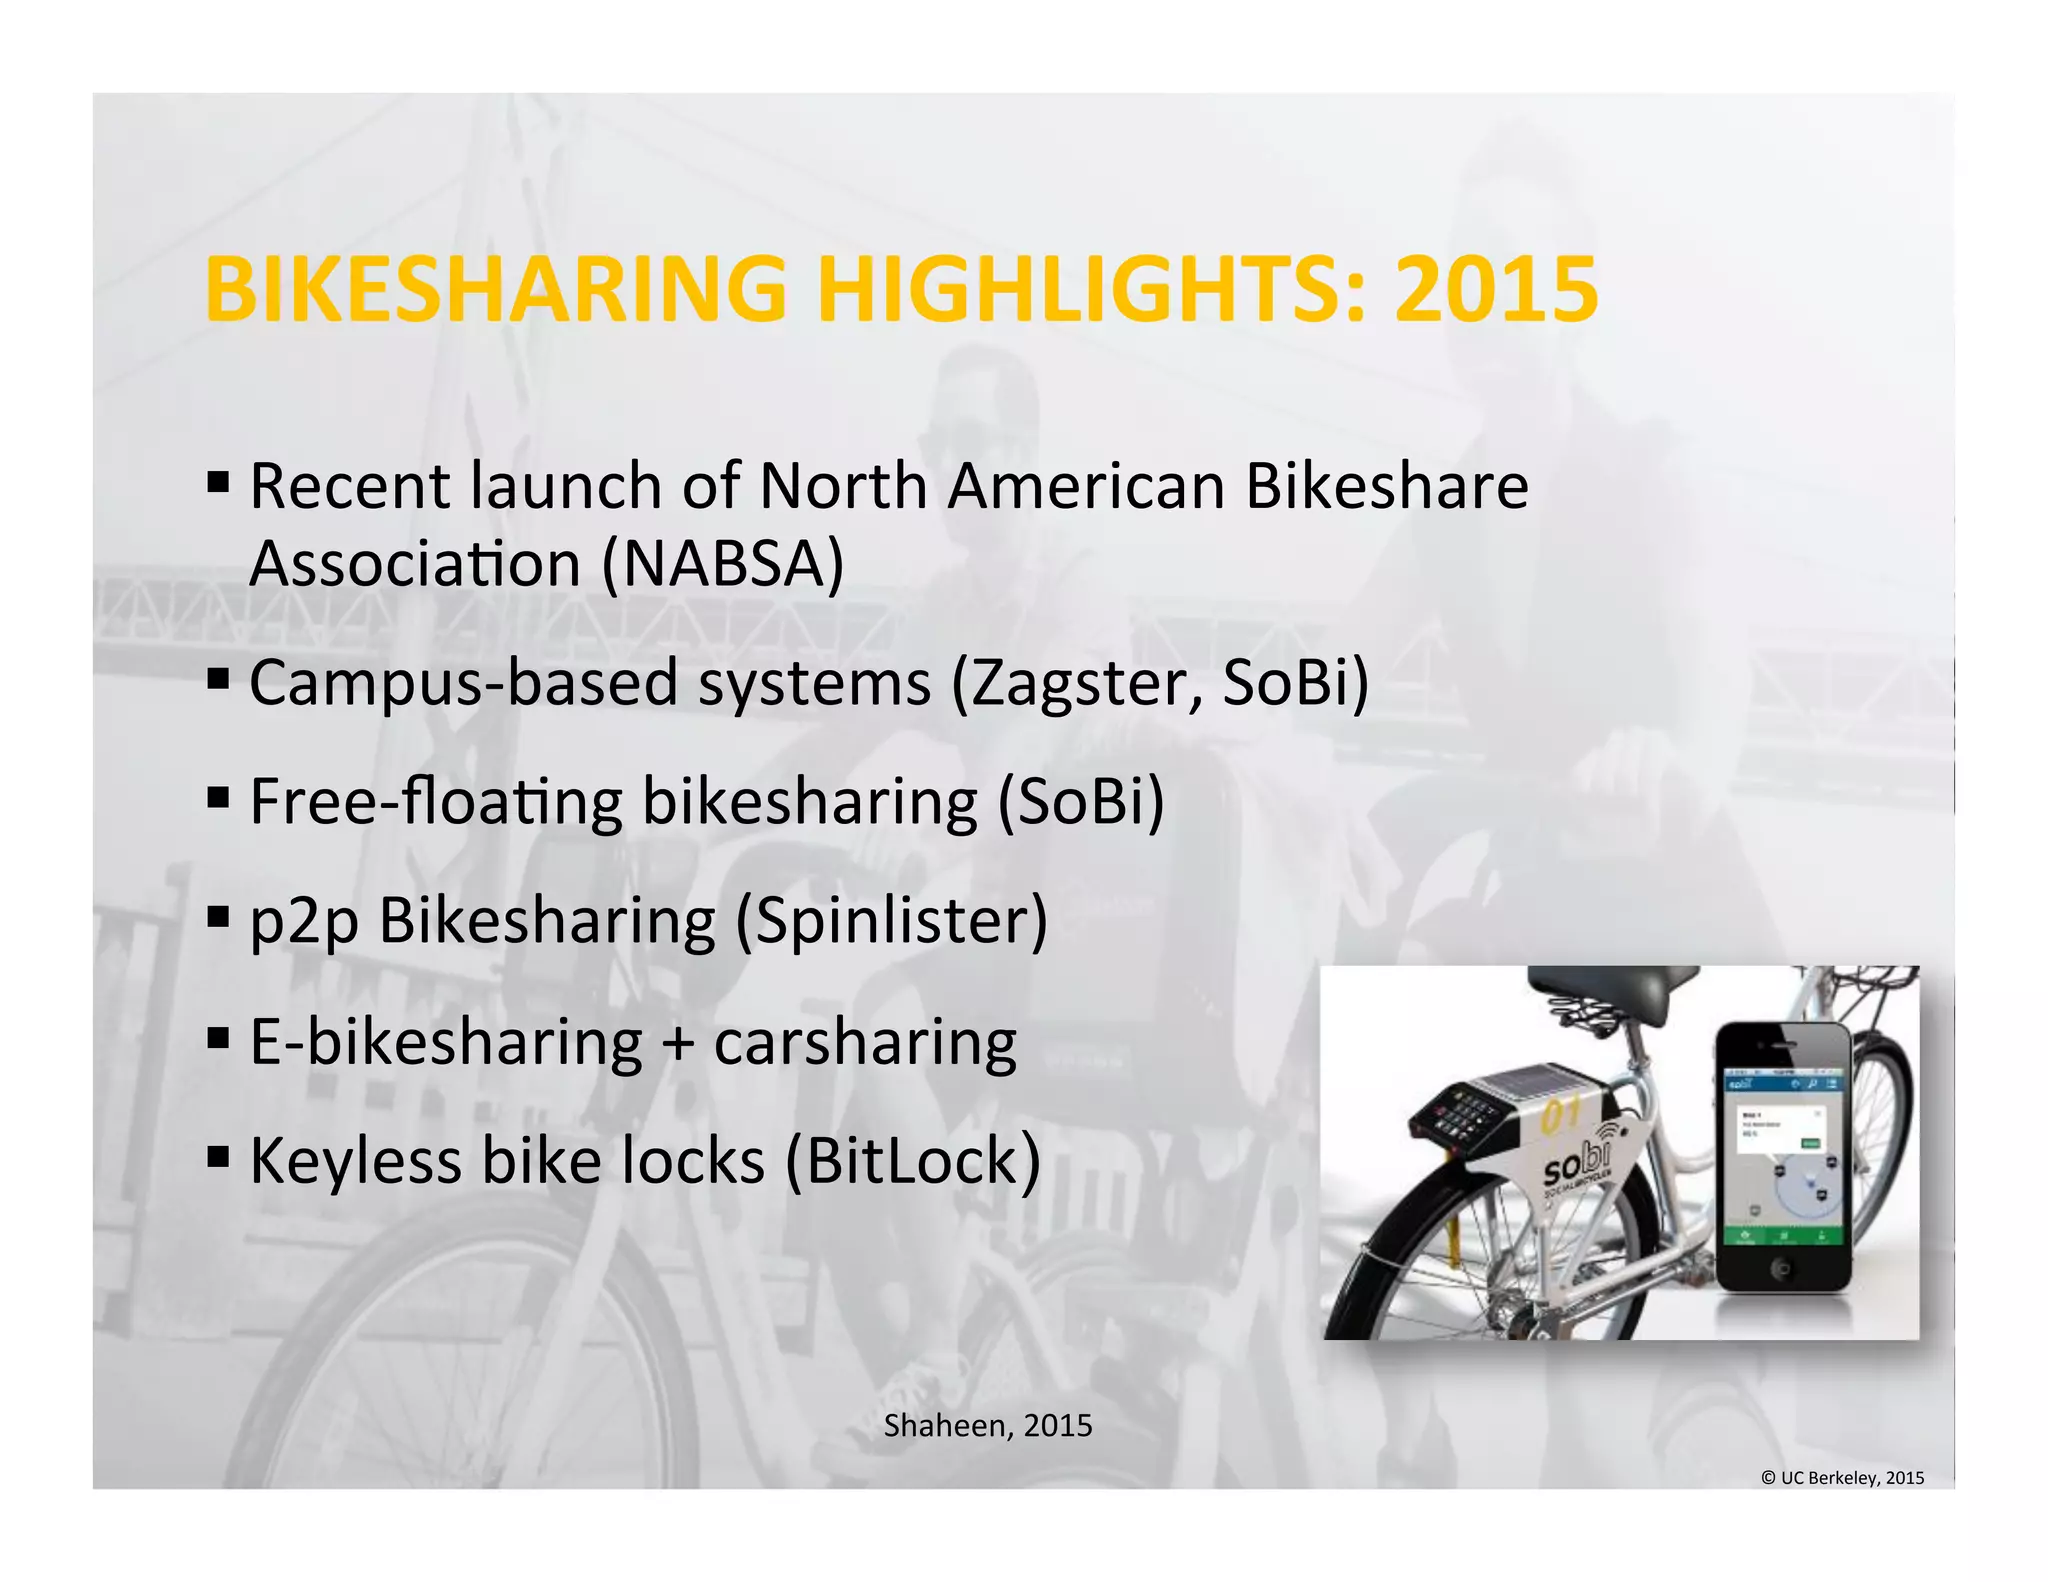
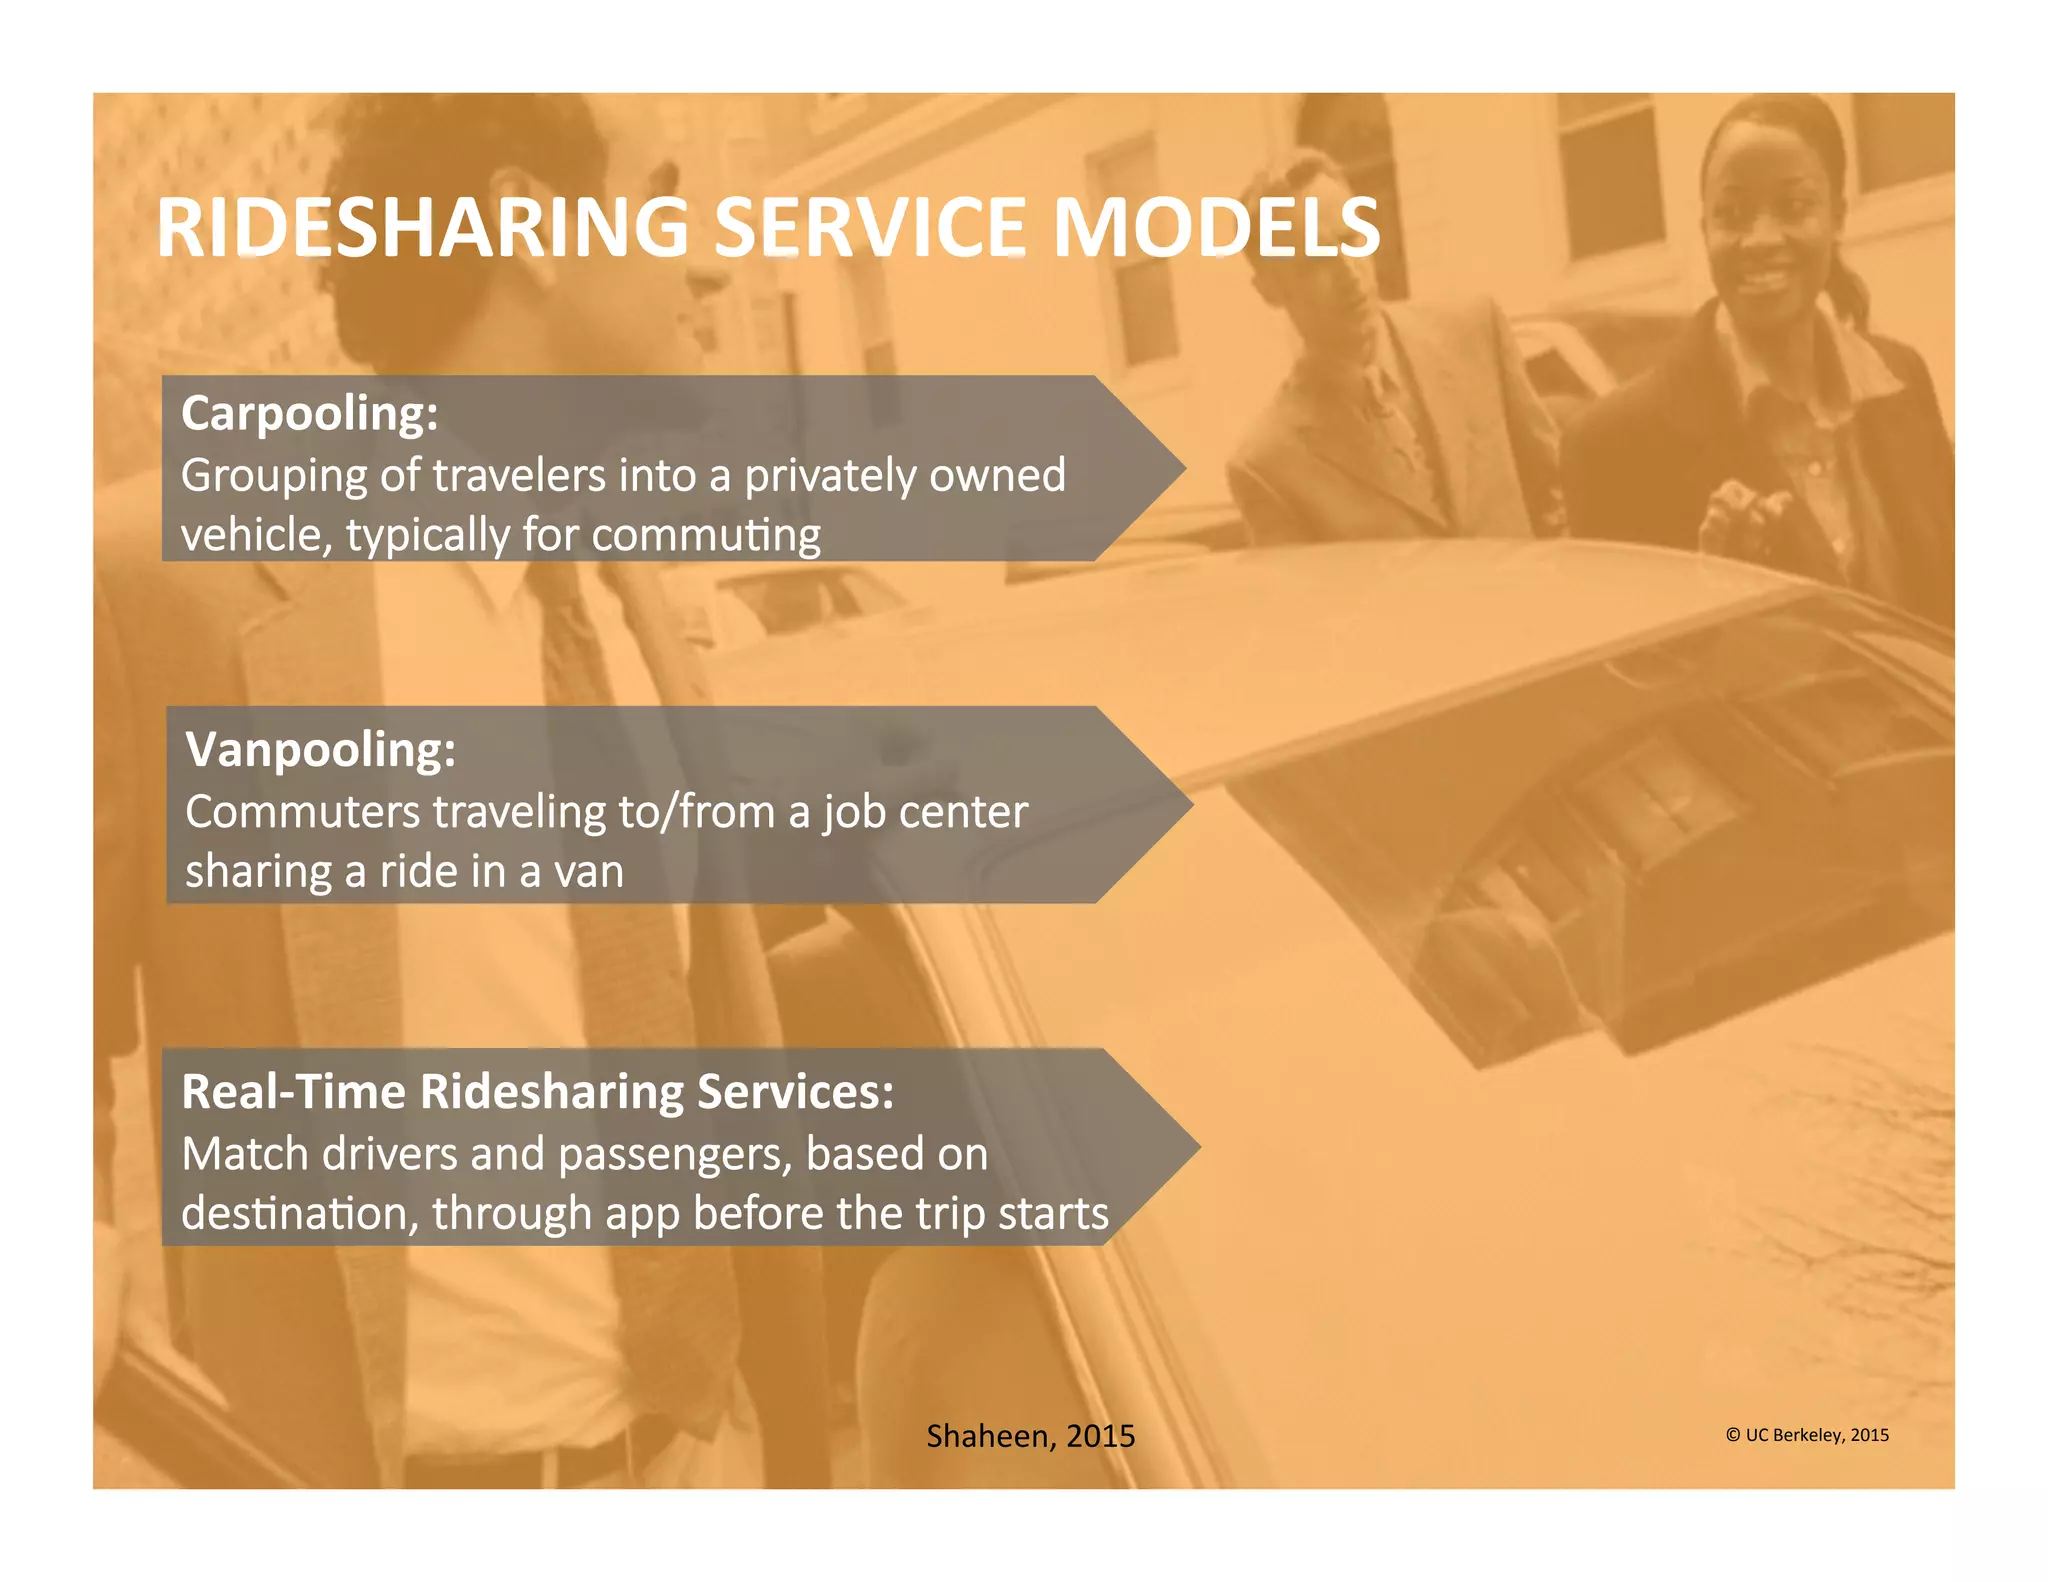
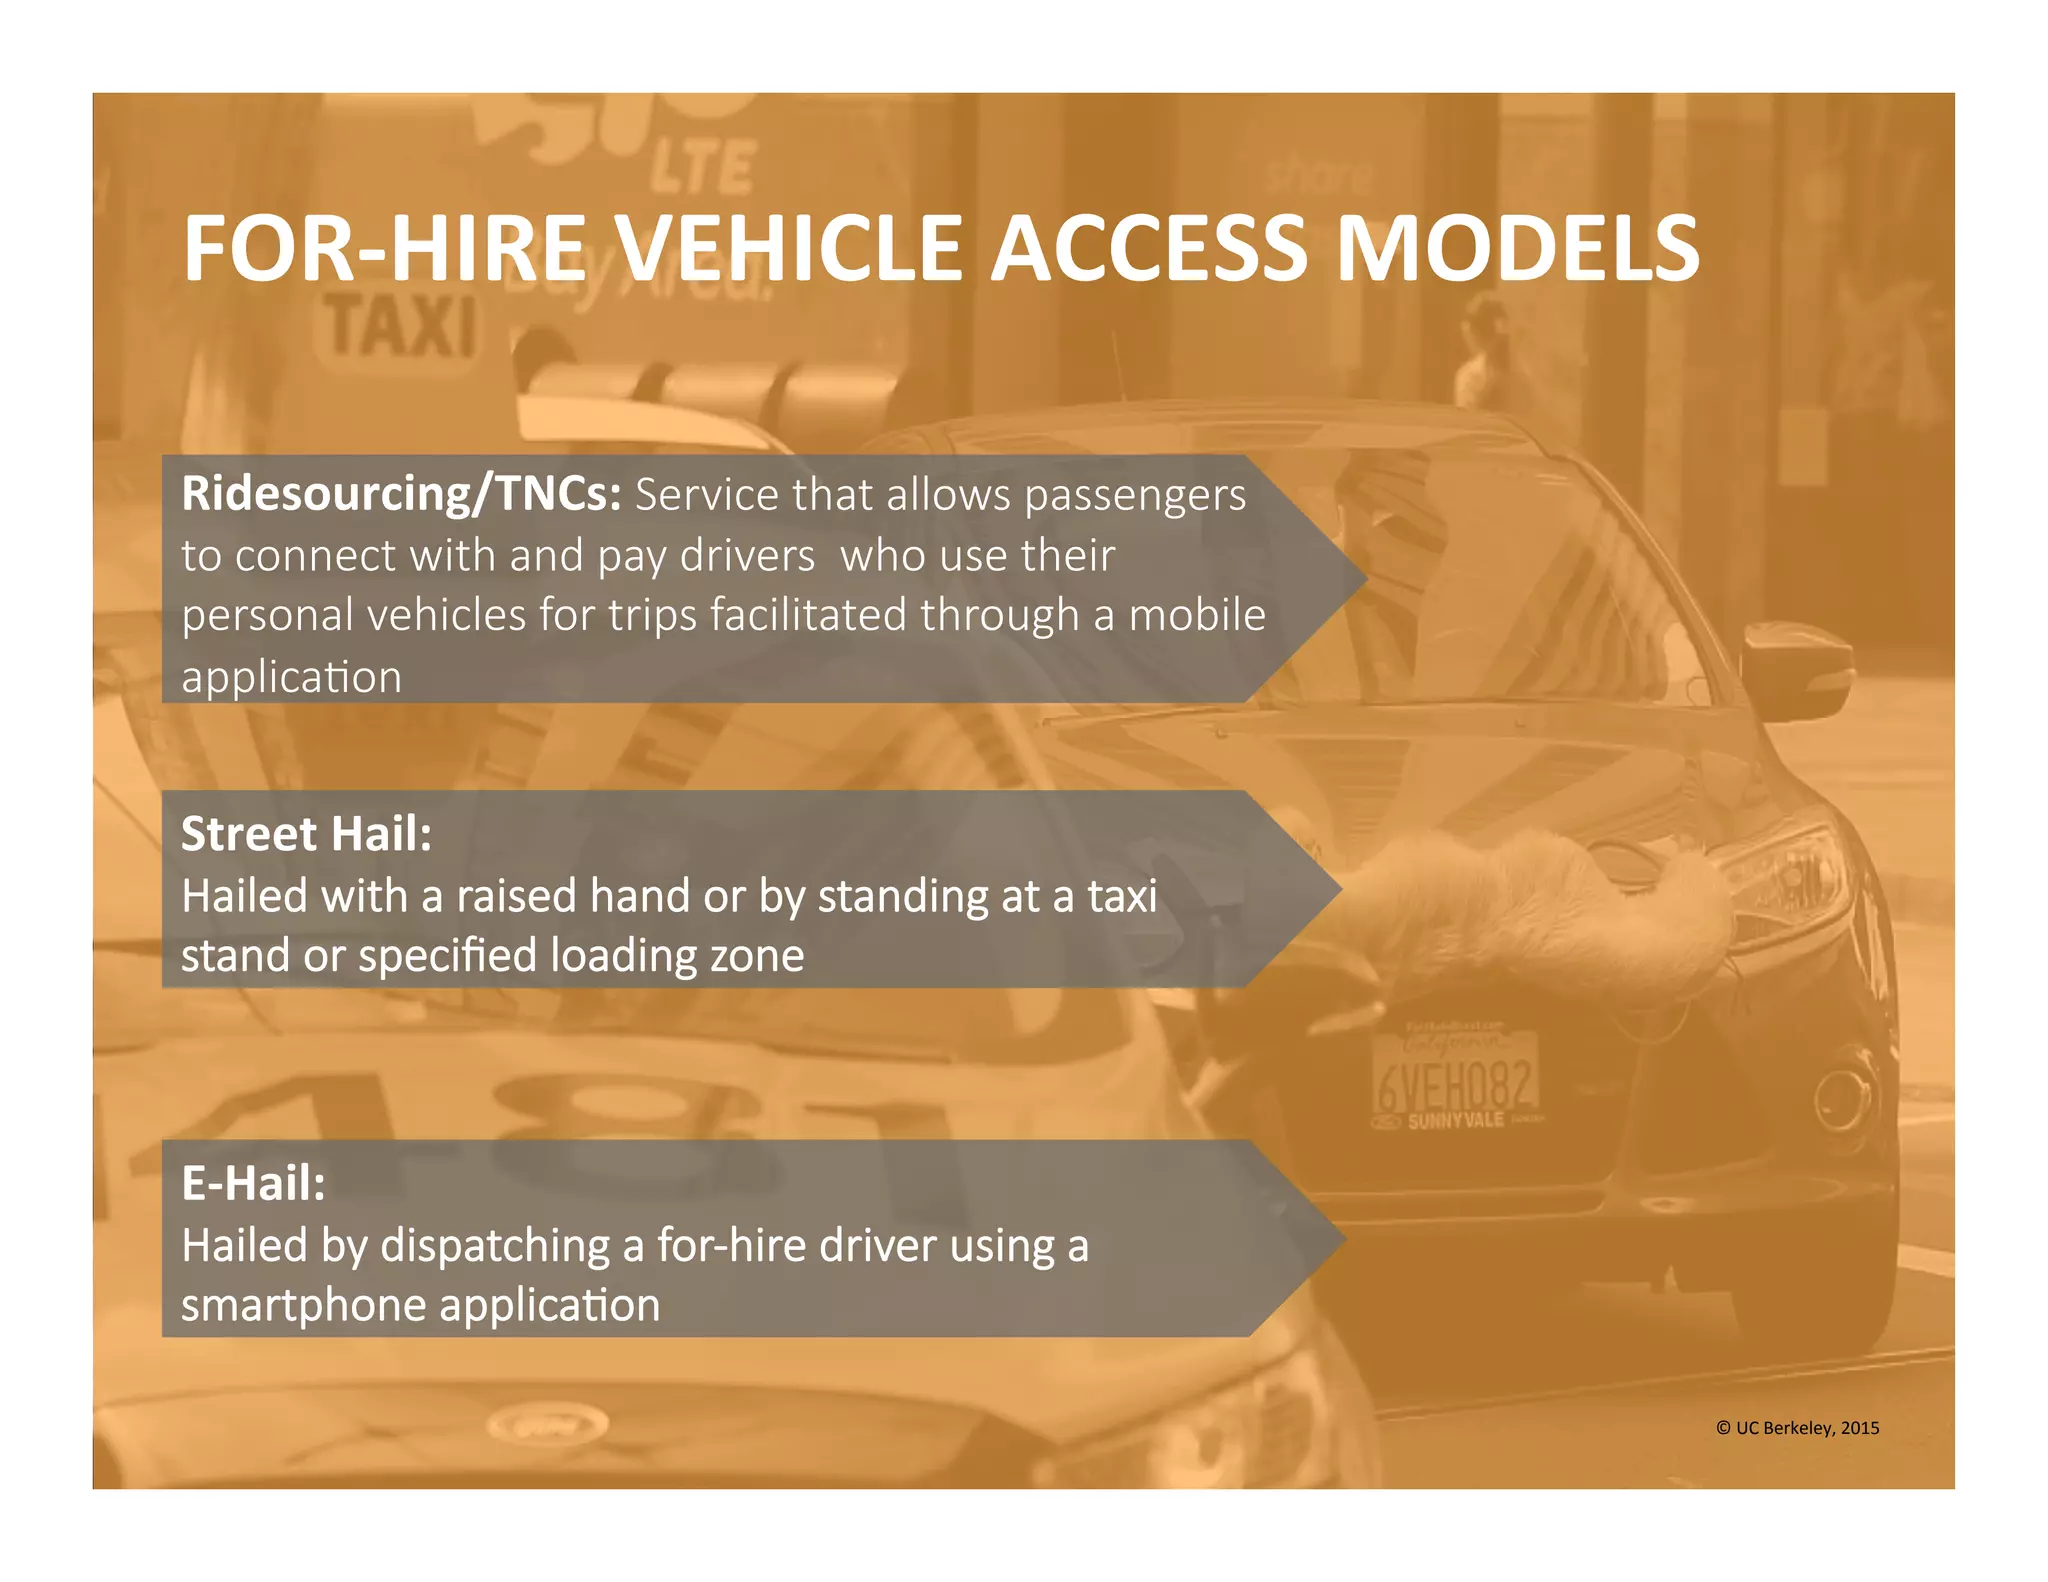
Mobility	
  +	
  Sharing	
  	
  
Economy:	
  Past,	
  Present,	
  	
  
and	
  Future	
  
SUSAN	
  SHAHEEN,	
  PH.D.	
  	
  
ADJUNCT	
  PROFESSOR,	
  CIVIL	
  AND	
  ENVIRONMENTAL	
  ENGINEERING	
  
CO-­‐DIRECTOR,	
  TRANSPORTATION	
  SUSTAINABILITY	
  RESEARCH	
  CENTER	


OVERVIEW	
  
§ Sharing	
  economy	
  
§ Changing	
  percep0ons	
  
§ Historical	
  overview	
  of	
  shared	
  mobility	
  
§ Shared	
  mobility:	
  market	
  trends,	
  impacts,	
  and	
  
highlights	
  	
  
§ Future	
  	
  
§ Summary	
  	
  
©	
  UC	
  Berkeley,	
  2015	
  
The	
  trend	
  is	
  clear:	
  
Access	
  trumps	
  possession.	
  
Access	
  is	
  beIer	
  than	
  ownership	
  
-­‐	
  Kevin	
  Kelly	


Access	
  trumps	
  ownership	
  Paradigm	
  ShiP?	
   ©	
  UC	
  Berkeley,	
  2015	
  
Shaheen,	
  2015	
  
THE	
  SHARING	
  ECONOMY	
  
WHAT	
  IS	
  SHARED	
  MOBILITY?	
  	
  
§ Shared	
  use	
  of	
  a	
  motor	
  vehicle,	
  bicycle,	
  or	
  other	
  
low-­‐speed	
  mode	
  
§ Enables	
  users	
  to	
  gain	
  short-­‐term	
  access	
  to	
  
transporta0on	
  modes	
  on	
  an	
  “as-­‐needed”	
  basis	
  
§ Includes	
  carsharing,	
  bikesharing,	
  ridesharing,	
  
flexible	
  transit	
  services,	
  on-­‐demand	
  ride	
  services,	
  
and	
  courier	
  delivery	
  services	
  
©	
  UC	
  Berkeley,	
  2015	
  
CHANGING	
  PERCEPTIONS	
  
§  Focus	
  on	
  sustainability	
  +	
  smart	
  ci0es	
  growing	
  
§  Shared	
  mobility	
  +	
  TDM	
  changing	
  percep0ons	
  of	
  mobility	
  in	
  
US	
  and	
  worldwide	
  
§  	
  The	
  Sharing	
  Economy	
  
§  	
  “Access	
  trumps	
  ownership”	
  	
  
§  Shared	
  mobility	
  spawning	
  new	
  business	
  models	
  +	
  
influencing	
  individual	
  transporta0on	
  choices	
  and	
  behavior	
  
§  Ongoing	
  evolu0on	
  +	
  changes	
  expected	
  
Understanding	
  Millennials	
  Living	
  in	
  Urban	
  
Areas	
  
TCRP	
  J-­‐11	
  Study	
  
TCRP	
  REPORT:	
  MILLENNIALS	
  &	
  MOBILITY	
  
Key	
  Findings:	
  	
  
§  Cost,	
  convenience	
  +	
  exercise	
  top	
  mo0vators	
  	
  
§  Mul0-­‐modality	
  driven	
  by	
  cost,	
  convenience,	
  and	
  0me	
  savings	
  
§  AIracted	
  to	
  mobile	
  +	
  digital	
  services	
  that	
  provide	
  detailed,	
  real-­‐
0me	
  and	
  mul0-­‐modal	
  trip-­‐planning	
  informa0on	
  
§  Decision	
  to	
  drive	
  largely	
  about	
  avoiding	
  hassles	
  —	
  e.g.,	
  finding	
  
parking,	
  avoiding	
  tolls,	
  etc.	
  
§  Constant	
  Internet	
  connec0vity	
  and	
  ability	
  to	
  mul0task	
  while	
  
commu0ng	
  key	
  
§  Environmental	
  considera0ons	
  are	
  a	
  plus	
  but	
  not	
  a	
  core	
  mo0vator	
  
©	
  UC	
  Berkeley,	
  2015	
  
 Changes	
  in	
  Driving	
  &	
  Role	
  of	
  Apps,	
  Sharing	
  Recent	
  U.S.	
  Studies	
  
Millennials	
  ShiPing	
  Away	
  from	
  Driving	
  	
  Latest	
  Study	
  
THE	
  PAST	
  
PHASES	
  OF	
  CARSHARING	
  EVOLUTION	
  
Early	
  European	
  
Programs	
  	
   ff	
  
Ini0al	
  Market	
  
Entry	
  and	
  
Experimenta0on	
  	
  
Growth	
  &	
  
Market	
  
Diversifica0on	
  	
  
Commercial	
  
Mainstreaming	
  
Shaheen	
  and	
  Cohen,	
  2015	
   ©	
  UC	
  Berkeley,	
  2015	
  
PHASES	
  OF	
  BIKESHARING	
  EVOLUTION	
  
1st	
  Genera0on	
  
Free	
  Bikes	
  	
  
2nd	
  Genera0on	
  	
  
Coin	
  Access	
  
3rd	
  Genera0on	
  
IT-­‐based	
  
4th	
  Genera0on	
  
Demand-­‐Responsive/	
  
Mul0-­‐Modal	
  
©	
  UC	
  Berkeley,	
  2015	
   Shaheen	
  et	
  al,	
  2011	
  
PHASES	
  OF	
  RIDESHARING	
  EVOLUTION	
  
World	
  War	
  II	
  
car-­‐sharing	
  
clubs	
  
Major	
  
responses	
  to	
  
energy	
  crises	
  
Early	
  
organized	
  
ridesharing	
  
schemes	
  
Reliable	
  
ridesharing	
  
schemes	
  
Technology-­‐
enabled	
  
ridematching	
  
©	
  UC	
  Berkeley,	
  2015	
  
Chan	
  and	
  Shaheen,	
  2011	
  
THE	
  PRESENT	
  
Roundtrip	
  Carsharing:	
  	
  
Round  trip,  pay  by  the  hour/mile,  non-­‐profit  and  for  profit  fleet  models
Peer-­‐to-­‐Peer	
  Carsharing:	
  	
  
Shared  use  of  private  vehicle  typically  managed  by  third  party
One-­‐Way	
  Carsharing:	
  	
  
Pay  by  the  minute,  point  to  point,  fleet  operated,  street  parking  
agreements
FracWonal	
  Ownership	
  Carsharing:	
  	
  
Individuals  sublease  or  subscribe  to  a  vehicle  owned  by  a  third  party
CARSHARING	
  SERVICE	
  MODELS	
  
©	
  UC	
  Berkeley,	
  2015	
  
Shaheen,	
  2015	
  
GROWTH	
  OF	
  WORLDWIDE	
  CARSHARING	
  
2006	
   2008	
   2010	
   2012	
   2014	
  
Members	
   346,610	
   670,822	
   1,163,405	
   1,788,027	
   4,842,616	
  
Vehicles	
   11,501	
   19,403	
   31,967	
   43,554	
   104,125	
  
0	
  
20,000	
  
40,000	
  
60,000	
  
80,000	
  
100,000	
  
120,000	
  
0	
  
1,000,000	
  
2,000,000	
  
3,000,000	
  
4,000,000	
  
5,000,000	
  
6,000,000	
  
Vehicles	
  
Members	
  
Shaheen	
  and	
  Cohen,	
  2015	
   ©	
  UC	
  Berkeley,	
  2015	
  
2014	
  MEMBERSHIP:	
  ONE-­‐WAY	
  &	
  ROUNDTRIP	
  
Shaheen	
  and	
  Cohen,	
  2015	
   ©	
  UC	
  Berkeley,	
  2015	
  
Asia	
   Europe	
   North	
  America	
   South	
  America	
   Oceania	
   Global	
  
Round-­‐trip	
   926,280	
   1,834,418	
   1,179,930	
   0	
   50,000	
   3,990,628	
  
One-­‐way	
   29,600	
   372,466	
   445,722	
   3,500	
   700	
   851,988	
  
0	
  
500,000	
  
1,000,000	
  
1,500,000	
  
2,000,000	
  
2,500,000	
  
3,000,000	
  
3,500,000	
  
4,000,000	
  
4,500,000	
  
5,000,000	
  
EUROPEAN	
  LONGITUDINAL	
  TRENDS	
  
WORLD	
  CARSHARING	
  GROWTH	
  RATES	
  
Shaheen	
  and	
  Cohen,	
  2015	
   ©	
  UC	
  Berkeley,	
  2015	
  
2006-­‐08	
   2008-­‐10	
   2010-­‐12	
   2012-­‐14	
  
Members	
   39%	
   32%	
   24%	
   64%	
  
Vehicles	
   30%	
   28%	
   17%	
   55%	
  
0%	
  
10%	
  
20%	
  
30%	
  
40%	
  
50%	
  
60%	
  
70%	
  
Growth	
  Rate	
  
2008	
  NORTH	
  AMERICAN	
  CARSHARING	
  SURVEY:	
  
KEY	
  FINDINGS	
  
§  Between	
  9	
  to	
  13	
  vehicles	
  removed,	
  including	
  postponed	
  
purchase	
  	
  
§  	
  4	
  to	
  6	
  vehicles/carsharing	
  vehicle	
  sold	
  due	
  to	
  carsharing	
  
§  	
  25%	
  sell	
  a	
  vehicle;	
  25%	
  postpone	
  purchases	
  
§  	
  27	
  -­‐	
  43%	
  VMT/VKT	
  reduc0on	
  per	
  year,	
  considering	
  vehicles	
  
sold	
  and	
  purchases	
  postponed	
  
§  More	
  users	
  increased	
  overall	
  public	
  transit	
  and	
  non-­‐
motorized	
  modal	
  use	
  (including	
  bus,	
  rail,	
  walking,	
  and	
  
carpooling)	
  than	
  decreased	
  it	
  
Mar0n	
  et	
  al.	
  2010	
   ©	
  UC	
  Berkeley,	
  2015	
  
2008	
  NORTH	
  AMERICAN	
  CARSHARING	
  SURVEY:	
  
KEY	
  FINDINGS	
  
§  Reduc0on	
  of	
  0.58-­‐0.84	
  metric	
  tons	
  
of	
  GHG	
  emissions	
  per	
  year	
  for	
  one	
  
household	
  (mean	
  observed	
  and	
  full	
  
impact)	
  
§  34%	
  -­‐	
  41%	
  reduc0on	
  of	
  GHG	
  
emissions	
  per	
  year	
  for	
  one	
  
household.	
  	
  
§  $154	
  -­‐	
  $435	
  monthly	
  household	
  
savings	
  per	
  U.S.	
  member	
  aner	
  
joining	
  carsharing	


Mar0n	
  et	
  al.	
  2010	
   ©	
  UC	
  Berkeley,	
  2015	
  
CARSHARING	
  HIGHLIGHTS:	
  2015	
  
§ CarSharing	
  Associa0on	
  Conference	
  in	
  Vancouver,	
  BC	
  	
  
–	
  September	
  22-­‐23	
  
hIp://conference.carsharing.org/	
  
§ Disrup0ng	
  Mobility	
  Summit	
  in	
  Cambridge,	
  MA	
  
–	
  November	
  11-­‐13	
  
hIp://www.disrup0ng-­‐mobility.org/#welcome-­‐	
  
§ Frac0onal	
  ownership	
  through	
  Audi	
  “Unite”	
  	
  
§ E-­‐bikesharing	
  and	
  carsharing	
  to	
  launch	
  in	
  SF	
  Bay	
  Area	
  
§ New	
  entrants	
  and	
  the	
  growth	
  of	
  one-­‐way	
  and	
  electric	
  service	
  
models	
  
©	
  UC	
  Berkeley,	
  2015	
  
Public	
  Bikesharing:	
  	
  
Point  to  point,  pay  by  the  ½  hr,  fleet  operated,  
docking  staCons
Closed	
  Community	
  Bikesharing:	
  	
  
Campuses  and  closed  membership,  mainly  
roundtrip,  linking  to  carsharing
Peer-­‐to-­‐Peer	
  Bikesharing:	
  	
  
Rent  or  borrow  hourly  or  daily  from  individuals  
or  bike  rental  shops
BIKESHARING	
  SERVICE	
  MODELS	
  
©	
  UC	
  Berkeley,	
  2015	
  Shaheen,	
  2015	
  
WORLDWIDE	
  AND	
  U.S.	
  BIKESHARING:	


MAY	
  2015	
  
Worldwide:	
  880	
  ciWes	
  with	
  IT-­‐based	
  opera0ng	
  
systems	
  
§  1,036,000	
  bikes	
  
	
  ~811,500	
  bikes	
  in	
  China	
  (and	
  256	
  ci0es)	
  
U.S.:	
  72	
  ciWes	
  with	
  IT-­‐based	
  systems	
  (52	
  
programs)	
  
§  ~24,700	
  bikes	
  
§  2,440	
  staWons	
  
In	
  2015,	
  21	
  new	
  programs	
  to	
  begin	
  opera0ng	
  in	
  
world:	
  13	
  are	
  in	
  China	
  and	
  8	
  in	
  US	
  
Source:	
  Russell	
  Meddin,	
  2015	
   ©	
  UC	
  Berkeley,	
  2015	
  
CHANGE	
  IN	
  DRIVING	
  
0% 0%
44%
9%
29%
4% 0%0% 0%
49%
6%
38%
0% 0%
0%
10%
20%
30%
40%
50%
60%
Much	
  more	
  often More	
  often Less	
  often Much	
  less	
  often About	
  the	
  same Did	
  not	
  ride	
  the
drive	
  before/after
Changed	
  driving,
not	
  due	
  to
bikesharing.
As	
  a	
  result	
  of	
  my	
  use	
  of	
  bikesharing,	
  I	
  drive	
  a	
  personal	
  vehicle	
  (e.g.,	
  car,	
  SUV,	
  etc.)	
  …
Minneapolis	
  Saint-­‐Paul,	
  N	
  =	
  620
Salt	
  Lake	
  City,	
  N	
  =	
  72
0% 0%
19%
10%
16%
3%
0%0% 0%
23%
12%
24%
4%
0%
0%
10%
20%
30%
Much	
  more	
  often More	
  often Less	
  often Much	
  less	
  often About	
  the	
  same Did	
  not	
  ride	
  the
drive	
  before/after
Changed	
  driving,
not	
  due	
  to
bikesharing.
Montreal,	
  N	
  =	
  1095
Toronto,	
  N	
  =	
  993
1% 0%
32%
21% 19%
2% 0%
0%
5%
10%
15%
20%
25%
30%
35%
Much	
  more	
  often More	
  often Less	
  often Much	
  less	
  often About	
  the	
  same Did	
  not	
  ride	
  the
drive	
  before/after
Changed	
  driving,
not	
  due	
  to
bikesharing.
Mexico	
  City,	
  N	
  =	
  3329
Shaheen	
  et	
  al.,	
  2014	
  
BIKESHARING	
  IMPACTS	
  
§ Studies	
  have	
  shown	
  bikesharing	
  members	
  in	
  larger	
  
ci0es	
  ride	
  bus	
  less,	
  aIributable	
  to	
  reduced	
  costs	
  +	
  
faster	
  travel	
  associated	
  with	
  bikesharing	
  
§ Rail	
  usage	
  increases	
  in	
  small	
  ci0es	
  (Minneapolis-­‐St.	
  
Paul)	
  and	
  decreases	
  in	
  larger	
  ci0es	
  (Mexico	
  City,	
  
Montreal,	
  and	
  Washington	
  D.C.)	
  –	
  all	
  larger	
  regions	
  
with	
  denser	
  rail	
  networks	
  	
  
§  Shins	
  away	
  from	
  public	
  transit	
  in	
  urban	
  areas	
  are	
  onen	
  
aIributed	
  to	
  faster	
  travel	
  0mes	
  +	
  cost	
  savings	
  from	
  
bikesharing	
  use	
  
Shaheen	
  et	
  al.	
  2014	
  
©	
  UC	
  Berkeley,	
  2015	
  
BIKESHARING	
  HIGHLIGHTS:	
  2015	
  
§ Recent	
  launch	
  of	
  North	
  American	
  Bikeshare	
  
Associa0on	
  (NABSA)	
  
§ Campus-­‐based	
  systems	
  (Zagster,	
  SoBi)	
  
§ Free-­‐floa0ng	
  bikesharing	
  (SoBi)	
  	
  
§ p2p	
  Bikesharing	
  (Spinlister)	
  	
  
§ E-­‐bikesharing	
  +	
  carsharing	
  
§ Keyless	
  bike	
  locks	
  (BitLock)
©	
  UC	
  Berkeley,	
  2015	
  
Shaheen,	
  2015	
  
Carpooling:	
  	
  
Grouping  of  travelers  into  a  privately  owned  
vehicle,  typically  for  commuCng
Vanpooling:	
  	
  
Commuters  traveling  to/from  a  job  center  
sharing  a  ride  in  a  van
Real-­‐Time	
  Ridesharing	
  Services:	
  	
  
Match  drivers  and  passengers,  based  on  
desCnaCon,  through  app  before  the  trip  starts
RIDESHARING	
  SERVICE	
  MODELS	
  
©	
  UC	
  Berkeley,	
  2015	
  Shaheen,	
  2015	
  
TRADITIONAL	
  RIDESHARING	
  
§  Grouping	
  of	
  travelers	
  into	
  common	
  trips	
  by	
  
private	
  auto/van	
  (e.g.,	
  carpooling	
  and	
  
vanpooling)	
  
§  Historically,	
  differs	
  from	
  ridesourcing	
  in	
  
financial	
  mo0va0on	
  and	
  trip	
  origin/
des0na0on	
  
§  662	
  ridematching	
  services	
  in	
  the	
  U.S.	
  and	
  
Canada	
  (24	
  span	
  both	
  countries)	
  	
  
§  612	
  programs	
  offer	
  carpooling	
  
§  153	
  programs	
  offer	
  vanpooling	
  
§  127	
  programs	
  offered	
  carpooling	
  and	
  
vanpooling	
  
Chan and Shaheen, 2011
©	
  UC	
  Berkeley,	
  2015	
  
BLURRING	
  LINES	
  
§  Sharing	
  a	
  ride	
  no	
  longer	
  requires	
  prearrangement	
  or	
  street	
  
hails	


§  Mobile	
  technology	
  +	
  social	
  networking	
  facilitate	
  finding	
  a	
  
ride	
  in	
  real	
  0me	
  (e.g.,	
  app-­‐based	
  taxi	
  dispatch	
  or	
  “e-­‐hail”	
  
such	
  as	
  Curb,	
  Flywheel,	
  and	
  Bandwagon)	


§  YellowZ	
  –	
  Yellow	
  Cab	
  employing	
  p2p	
  drivers	
  
§  Less	
  dis0nc0on	
  among	
  classic	
  ridesharing,	
  ridesourcing,	
  and	
  
commercial	
  transporta0on	
  
©	
  UC	
  Berkeley,	
  2015	
  Shaheen,	
  2015	
  
Ridesourcing/TNCs:	
  Service  that  allows  passengers  
to  connect  with  and  pay  drivers    who  use  their  
personal  vehicles  for  trips  facilitated  through  a  mobile  
applicaCon      
Street	
  Hail:	
  	
  
Hailed  with  a  raised  hand  or  by  standing  at  a  taxi  
stand  or  specified  loading  zone
E-­‐Hail:	
  	
  
Hailed  by  dispatching  a  for-­‐hire  driver  using  a  
smartphone  applicaCon
FOR-­‐HIRE	
  VEHICLE	
  ACCESS	
  MODELS	
  
©	
  UC	
  Berkeley,	
  2015	
  
RIDESOURCING/TNCS	
  
§  Plavorm	
  used	
  to	
  “source”	
  rides	
  
from	
  a	
  driver	
  pool	
  
§  App-­‐based,	
  on-­‐demand	
  ride	
  
services	
  
§  Transporta0on	
  Network	
  
Companies	
  (TNCs)	
  
§  Uber	
  (uberX	
  and	
  uberXL)	
  
§  Lyn	
  
§  Shuddle	
  	
  
§  Sidecar	
  
§  Summon	
  
§  Wingz	
  
©	
  UC	
  Berkeley,	
  2015	
  
Shaheen,	
  2015	
  
SOME	
  RIDESOURCING/E-­‐HAIL	
  	
  
MARKET	
  TRENDS	
  
§  Lyn:	
  60	
  ci0es;	
  51,000	
  drivers	
  (2014)	
  
§  Uber:	
  58	
  countries;	
  311	
  ci0es;	
  over	
  162,000	
  drivers	
  in	
  U.S.	
  
§  Sidecar:	
  10	
  ci0es;	
  ~10,000	
  drivers	
  
§  Flywheel:	
  6	
  ci0es,	
  over	
  5,000	
  drivers	
  	
  
§  Curb:	
  60	
  ci0es;	
  35,000	
  cabs	


Said,	
  2015;	
  Miller,	
  2015	
   ©	
  UC	
  Berkeley,	
  2015	
  
RIDESOURCING:	
  SOME	
  EARLY	
  
UNDERSTANDING	
  
Taxi,	
  39%	
  
Bus,	
  24%	
  
Rail,	
  9%	
  
Walk,	
  8%	
  
Drive	
  
Own	
  Car,	
  
6%	
  
Bike,	
  2%	
  
Get	
  A	
  
Ride,	
  1%	
  
Other,	
  
11%	
  
§  92%	
  would	
  have	
  s0ll	
  made	
  
this	
  trip	
  
§  8%	
  induced	
  travel	
  effect	
  
§  33%	
  would	
  have	
  taken	
  public	
  
transit	
  (bus	
  or	
  rail)	
  	
  
§  4%	
  named	
  a	
  transit	
  sta0on	
  
origin/des0na0on,	
  sugges0ng	
  
some	
  ridesourcing	
  usage	
  to	
  
access	
  public	
  transporta0on	
  
§  20%	
  avoided	
  driving	
  aner	
  
drinking	
  	
  
Rayle	
  et	
  al.	
  2014	
  
How	
  would	
  you	
  have	
  made	
  this	
  trip	
  if	
  Uber/
LyP/Sidecar	
  were	
  not	
  available?	


©	
  UC	
  Berkeley,	
  2015	
  
KEY	
  FINDINGS:	
  WAIT	
  TIMES	
  
Rayle	
  et	
  al,	
  2014	
  
About	
  how	
  long	
  did	
  you	
  wait	
  for	
  your	
  ride	
  (from	
  the	
  Wme	
  you	
  
made	
  the	
  request	
  to	
  the	
  Wme	
  the	
  vehicle	
  arrived)?	
  
Percentages	
  of	
  wait	
  0mes	
  less	
  than	
  or	
  equal	
  to	
  10	
  minutes:	
  
Wait	
  Times	
   Ridesourcing	
   Taxi	
  (Phone)	
   Taxi	
  (Street	
  Hail)	
  
M-­‐F	
  4am-­‐6pm	
   93%	
   35%	
   39%	
  
M-­‐F	
  (6pm-­‐4am)	
   92%	
   16%	
   33%	
  
S-­‐Su	
   88%	
   16%	
   25%	
  
INDUSTRY	
  DEVELOPMENTS:	
  
MERGING	
  INNOVATIONS	
  
§  Ridespliing	
  within	
  TNCs/ridesourcing	
  
§  Lyn	
  Line	
  
§  Sidecar	
  Shared	
  Rides	
  
§  uberPOOL	
  
§ Via	
  in	
  ManhaIan	
  merges	
  aspects	
  of	
  taxi,	
  
TNCs/ridesourcing,	
  and	
  ridesplixng	
  
§  Drivers	
  and	
  vehicles	
  contracted	
  to	
  taxi/limo	
  
company	
  
§  Flat-­‐rate	
  fares	
  with	
  set	
  zone	
  and	
  opera0ng	
  hours	
  
§  Shared	
  rides	
  with	
  others	
  going	
  similar	
  direc0on	
  
©	
  UC	
  Berkeley,	
  2015	
  
Shaheen,	
  2015	
  
THE	
  FUTURE	
  
SHARED	
  MOBILITY	
  DEVELOPMENTS	
  
e-­‐Bikesharing	
  
§  Milan’s	
  BikeMi	
  tradi0onal	
  bikesharing	
  and	
  e-­‐bikes	
  from	
  same	
  kiosks	
  
§  4,600	
  bicycles	
  (3,600	
  pushbikes	
  and	
  1,000	
  e-­‐bikes)	
  
TransportaWon	
  Courier	
  Services	
  (TCS)	
  offering	
  p2p	
  deliveries	
  (e.g.,	
  
Nimber	
  app	
  in	
  UK)	
  	
  
§  Launched	
  in	
  2013,	
  Nimber	
  has	
  30,000	
  members	
  and	
  delivers	
  ~10,000	
  
packages	
  a	
  year	
  
Flexible	
  Transit	
  Services	
  (e.g.,	
  Via,	
  Bridj,	
  Chariot,	
  Leap)	
  
P2P	
  Services	
  focused	
  on	
  college	
  market,	
  airport	
  travelers,	
  and	
  
bicycle	
  users	


©	
  UC	
  Berkeley,	
  2015	
  
Shaheen,	
  2015	
  
BLURRING	
  LINES:	
  CONVERGENCE?	
  
Carsharing	
  Services	
  
Transporta*on	
  Network	
  Companies	
  
Public	
  Transit	
  Services	
  
Car	
  Ownership	
  /	
  P2P	
  Carsharing	
  	
  
SIMILAR	
  ATTRIBUTES	
  
©	
  UC	
  Berkeley,	
  2015	
  
Michael	
  Galczynski,	
  2015	
  
FUTURE:	
  CONFLUENCE	
  OF	
  TRENDS	
  
Shared	
  Mobility	
  	
  
Electric	
  
Vehicles	
  
Autonomous	
  
Vehicles	
  
©	
  UC	
  Berkeley,	
  2015	
  
Shaheen,	
  2015	
  
42	
  
Rapid Network Boarding Island
Concept: Timothy
Papandreou
Illustration: Kathleen
Phu and Audrey Koh
THE	
  FUTURE?	
  
©	
  UC	
  Berkeley,	
  2015	
  
SUMMARY	
  
§ Growing	
  ecosystem	
  of	
  services	
  in	
  mobility	
  +	
  sharing	
  
economy	
  
§ Percep0ons	
  +	
  behaviors	
  shining	
  
§ Long	
  history	
  of	
  shared	
  mobility	
  –	
  da0ng	
  to	
  as	
  early	
  as	
  
1940s	
  with	
  ridesharing	
  and	
  carsharing	
  	
  
§ Over	
  4.8	
  M	
  members	
  and	
  ~104,000	
  vehicles	
  as	
  of	
  
October	
  2014	
  	
  
§ Shared	
  mobility	
  services:	
  ranging	
  from	
  less	
  to	
  well	
  
understood	
  
§ Lines	
  blurring,	
  par0cularly	
  in	
  area	
  of	
  on-­‐demand	
  mobility	
  
§ Future	
  convergence	
  of	
  sharing,	
  EVs,	
  and	
  AVs?	


   ©	
  UC	
  Berkeley,	
  2015	
  
ACKNOWLEDGEMENTS	
  
§  Mineta	
  Transporta0on	
  Ins0tute,	
  San	
  
Jose	
  State	
  University	
  
§  California	
  Department	
  of	
  
Transporta0on	
  
§  Adam	
  Cohen,	
  Elliot	
  Mar0n,	
  Nelson	
  
Chan,	
  MaI	
  Christensen,	
  and	
  Michael	
  
Galczynski,	
  TSRC,	
  UC	
  Berkeley	
  
§  Special	
  thanks	
  to	
  the	
  worldwide	
  
shared-­‐use	
  mobility	
  operators	
  and	
  
experts	
  who	
  make	
  our	
  research	
  
possible	
  including	
  Timothy	
  
Papandreou	
  and	
  Russell	
  Meddin	


www.tsrc.berkeley.edu	
  
Email:	
  sshaheen@berkeley.edu	
  
TwiIer:	
  SusanShaheen1	
  
©	
  UC	
  Berkeley,	
  2015	
  

Keynote Speech at International Sharing Economy Symposium in Utrecht on June 5, 2015

  • 1.
    Mobility  +  Sharing     Economy:  Past,  Present,     and  Future   SUSAN  SHAHEEN,  PH.D.     ADJUNCT  PROFESSOR,  CIVIL  AND  ENVIRONMENTAL  ENGINEERING   CO-­‐DIRECTOR,  TRANSPORTATION  SUSTAINABILITY  RESEARCH  CENTER    
  • 2.
    OVERVIEW   § Sharing  economy   § Changing  percep0ons   § Historical  overview  of  shared  mobility   § Shared  mobility:  market  trends,  impacts,  and   highlights     § Future     § Summary     ©  UC  Berkeley,  2015  
  • 3.
    The  trend  is  clear:   Access  trumps  possession.   Access  is  beIer  than  ownership   -­‐  Kevin  Kelly     Access  trumps  ownership  Paradigm  ShiP?   ©  UC  Berkeley,  2015   Shaheen,  2015  
  • 4.
  • 5.
    WHAT  IS  SHARED  MOBILITY?     § Shared  use  of  a  motor  vehicle,  bicycle,  or  other   low-­‐speed  mode   § Enables  users  to  gain  short-­‐term  access  to   transporta0on  modes  on  an  “as-­‐needed”  basis   § Includes  carsharing,  bikesharing,  ridesharing,   flexible  transit  services,  on-­‐demand  ride  services,   and  courier  delivery  services   ©  UC  Berkeley,  2015  
  • 6.
    CHANGING  PERCEPTIONS   § Focus  on  sustainability  +  smart  ci0es  growing   §  Shared  mobility  +  TDM  changing  percep0ons  of  mobility  in   US  and  worldwide   §   The  Sharing  Economy   §   “Access  trumps  ownership”     §  Shared  mobility  spawning  new  business  models  +   influencing  individual  transporta0on  choices  and  behavior   §  Ongoing  evolu0on  +  changes  expected  
  • 7.
    Understanding  Millennials  Living  in  Urban   Areas   TCRP  J-­‐11  Study  
  • 8.
    TCRP  REPORT:  MILLENNIALS  &  MOBILITY   Key  Findings:     §  Cost,  convenience  +  exercise  top  mo0vators     §  Mul0-­‐modality  driven  by  cost,  convenience,  and  0me  savings   §  AIracted  to  mobile  +  digital  services  that  provide  detailed,  real-­‐ 0me  and  mul0-­‐modal  trip-­‐planning  informa0on   §  Decision  to  drive  largely  about  avoiding  hassles  —  e.g.,  finding   parking,  avoiding  tolls,  etc.   §  Constant  Internet  connec0vity  and  ability  to  mul0task  while   commu0ng  key   §  Environmental  considera0ons  are  a  plus  but  not  a  core  mo0vator   ©  UC  Berkeley,  2015  
  • 9.
     Changes  in  Driving  &  Role  of  Apps,  Sharing  Recent  U.S.  Studies  
  • 10.
    Millennials  ShiPing  Away  from  Driving    Latest  Study  
  • 11.
  • 12.
    PHASES  OF  CARSHARING  EVOLUTION   Early  European   Programs     ff   Ini0al  Market   Entry  and   Experimenta0on     Growth  &   Market   Diversifica0on     Commercial   Mainstreaming   Shaheen  and  Cohen,  2015   ©  UC  Berkeley,  2015  
  • 13.
    PHASES  OF  BIKESHARING  EVOLUTION   1st  Genera0on   Free  Bikes     2nd  Genera0on     Coin  Access   3rd  Genera0on   IT-­‐based   4th  Genera0on   Demand-­‐Responsive/   Mul0-­‐Modal   ©  UC  Berkeley,  2015   Shaheen  et  al,  2011  
  • 14.
    PHASES  OF  RIDESHARING  EVOLUTION   World  War  II   car-­‐sharing   clubs   Major   responses  to   energy  crises   Early   organized   ridesharing   schemes   Reliable   ridesharing   schemes   Technology-­‐ enabled   ridematching   ©  UC  Berkeley,  2015   Chan  and  Shaheen,  2011  
  • 15.
  • 16.
    Roundtrip  Carsharing:     Round  trip,  pay  by  the  hour/mile,  non-­‐profit  and  for  profit  fleet  models Peer-­‐to-­‐Peer  Carsharing:     Shared  use  of  private  vehicle  typically  managed  by  third  party One-­‐Way  Carsharing:     Pay  by  the  minute,  point  to  point,  fleet  operated,  street  parking   agreements FracWonal  Ownership  Carsharing:     Individuals  sublease  or  subscribe  to  a  vehicle  owned  by  a  third  party CARSHARING  SERVICE  MODELS   ©  UC  Berkeley,  2015   Shaheen,  2015  
  • 17.
    GROWTH  OF  WORLDWIDE  CARSHARING   2006   2008   2010   2012   2014   Members   346,610   670,822   1,163,405   1,788,027   4,842,616   Vehicles   11,501   19,403   31,967   43,554   104,125   0   20,000   40,000   60,000   80,000   100,000   120,000   0   1,000,000   2,000,000   3,000,000   4,000,000   5,000,000   6,000,000   Vehicles   Members   Shaheen  and  Cohen,  2015   ©  UC  Berkeley,  2015  
  • 18.
    2014  MEMBERSHIP:  ONE-­‐WAY  &  ROUNDTRIP   Shaheen  and  Cohen,  2015   ©  UC  Berkeley,  2015   Asia   Europe   North  America   South  America   Oceania   Global   Round-­‐trip   926,280   1,834,418   1,179,930   0   50,000   3,990,628   One-­‐way   29,600   372,466   445,722   3,500   700   851,988   0   500,000   1,000,000   1,500,000   2,000,000   2,500,000   3,000,000   3,500,000   4,000,000   4,500,000   5,000,000  
  • 19.
  • 20.
    WORLD  CARSHARING  GROWTH  RATES   Shaheen  and  Cohen,  2015   ©  UC  Berkeley,  2015   2006-­‐08   2008-­‐10   2010-­‐12   2012-­‐14   Members   39%   32%   24%   64%   Vehicles   30%   28%   17%   55%   0%   10%   20%   30%   40%   50%   60%   70%   Growth  Rate  
  • 21.
    2008  NORTH  AMERICAN  CARSHARING  SURVEY:   KEY  FINDINGS   §  Between  9  to  13  vehicles  removed,  including  postponed   purchase     §   4  to  6  vehicles/carsharing  vehicle  sold  due  to  carsharing   §   25%  sell  a  vehicle;  25%  postpone  purchases   §   27  -­‐  43%  VMT/VKT  reduc0on  per  year,  considering  vehicles   sold  and  purchases  postponed   §  More  users  increased  overall  public  transit  and  non-­‐ motorized  modal  use  (including  bus,  rail,  walking,  and   carpooling)  than  decreased  it   Mar0n  et  al.  2010   ©  UC  Berkeley,  2015  
  • 22.
    2008  NORTH  AMERICAN  CARSHARING  SURVEY:   KEY  FINDINGS   §  Reduc0on  of  0.58-­‐0.84  metric  tons   of  GHG  emissions  per  year  for  one   household  (mean  observed  and  full   impact)   §  34%  -­‐  41%  reduc0on  of  GHG   emissions  per  year  for  one   household.     §  $154  -­‐  $435  monthly  household   savings  per  U.S.  member  aner   joining  carsharing       Mar0n  et  al.  2010   ©  UC  Berkeley,  2015  
  • 23.
    CARSHARING  HIGHLIGHTS:  2015   § CarSharing  Associa0on  Conference  in  Vancouver,  BC     –  September  22-­‐23   hIp://conference.carsharing.org/   § Disrup0ng  Mobility  Summit  in  Cambridge,  MA   –  November  11-­‐13   hIp://www.disrup0ng-­‐mobility.org/#welcome-­‐   § Frac0onal  ownership  through  Audi  “Unite”     § E-­‐bikesharing  and  carsharing  to  launch  in  SF  Bay  Area   § New  entrants  and  the  growth  of  one-­‐way  and  electric  service   models   ©  UC  Berkeley,  2015  
  • 24.
    Public  Bikesharing:     Point  to  point,  pay  by  the  ½  hr,  fleet  operated,   docking  staCons Closed  Community  Bikesharing:     Campuses  and  closed  membership,  mainly   roundtrip,  linking  to  carsharing Peer-­‐to-­‐Peer  Bikesharing:     Rent  or  borrow  hourly  or  daily  from  individuals   or  bike  rental  shops BIKESHARING  SERVICE  MODELS   ©  UC  Berkeley,  2015  Shaheen,  2015  
  • 25.
    WORLDWIDE  AND  U.S.  BIKESHARING:       MAY  2015   Worldwide:  880  ciWes  with  IT-­‐based  opera0ng   systems   §  1,036,000  bikes    ~811,500  bikes  in  China  (and  256  ci0es)   U.S.:  72  ciWes  with  IT-­‐based  systems  (52   programs)   §  ~24,700  bikes   §  2,440  staWons   In  2015,  21  new  programs  to  begin  opera0ng  in   world:  13  are  in  China  and  8  in  US   Source:  Russell  Meddin,  2015   ©  UC  Berkeley,  2015  
  • 26.
    CHANGE  IN  DRIVING   0% 0% 44% 9% 29% 4% 0%0% 0% 49% 6% 38% 0% 0% 0% 10% 20% 30% 40% 50% 60% Much  more  often More  often Less  often Much  less  often About  the  same Did  not  ride  the drive  before/after Changed  driving, not  due  to bikesharing. As  a  result  of  my  use  of  bikesharing,  I  drive  a  personal  vehicle  (e.g.,  car,  SUV,  etc.)  … Minneapolis  Saint-­‐Paul,  N  =  620 Salt  Lake  City,  N  =  72 0% 0% 19% 10% 16% 3% 0%0% 0% 23% 12% 24% 4% 0% 0% 10% 20% 30% Much  more  often More  often Less  often Much  less  often About  the  same Did  not  ride  the drive  before/after Changed  driving, not  due  to bikesharing. Montreal,  N  =  1095 Toronto,  N  =  993 1% 0% 32% 21% 19% 2% 0% 0% 5% 10% 15% 20% 25% 30% 35% Much  more  often More  often Less  often Much  less  often About  the  same Did  not  ride  the drive  before/after Changed  driving, not  due  to bikesharing. Mexico  City,  N  =  3329 Shaheen  et  al.,  2014  
  • 27.
    BIKESHARING  IMPACTS   § Studies  have  shown  bikesharing  members  in  larger   ci0es  ride  bus  less,  aIributable  to  reduced  costs  +   faster  travel  associated  with  bikesharing   § Rail  usage  increases  in  small  ci0es  (Minneapolis-­‐St.   Paul)  and  decreases  in  larger  ci0es  (Mexico  City,   Montreal,  and  Washington  D.C.)  –  all  larger  regions   with  denser  rail  networks     §  Shins  away  from  public  transit  in  urban  areas  are  onen   aIributed  to  faster  travel  0mes  +  cost  savings  from   bikesharing  use   Shaheen  et  al.  2014   ©  UC  Berkeley,  2015  
  • 28.
    BIKESHARING  HIGHLIGHTS:  2015   § Recent  launch  of  North  American  Bikeshare   Associa0on  (NABSA)   § Campus-­‐based  systems  (Zagster,  SoBi)   § Free-­‐floa0ng  bikesharing  (SoBi)     § p2p  Bikesharing  (Spinlister)     § E-­‐bikesharing  +  carsharing   § Keyless  bike  locks  (BitLock) ©  UC  Berkeley,  2015   Shaheen,  2015  
  • 29.
    Carpooling:     Grouping of  travelers  into  a  privately  owned   vehicle,  typically  for  commuCng Vanpooling:     Commuters  traveling  to/from  a  job  center   sharing  a  ride  in  a  van Real-­‐Time  Ridesharing  Services:     Match  drivers  and  passengers,  based  on   desCnaCon,  through  app  before  the  trip  starts RIDESHARING  SERVICE  MODELS   ©  UC  Berkeley,  2015  Shaheen,  2015  
  • 30.
    TRADITIONAL  RIDESHARING   § Grouping  of  travelers  into  common  trips  by   private  auto/van  (e.g.,  carpooling  and   vanpooling)   §  Historically,  differs  from  ridesourcing  in   financial  mo0va0on  and  trip  origin/ des0na0on   §  662  ridematching  services  in  the  U.S.  and   Canada  (24  span  both  countries)     §  612  programs  offer  carpooling   §  153  programs  offer  vanpooling   §  127  programs  offered  carpooling  and   vanpooling   Chan and Shaheen, 2011 ©  UC  Berkeley,  2015  
  • 31.
    BLURRING  LINES   § Sharing  a  ride  no  longer  requires  prearrangement  or  street   hails     §  Mobile  technology  +  social  networking  facilitate  finding  a   ride  in  real  0me  (e.g.,  app-­‐based  taxi  dispatch  or  “e-­‐hail”   such  as  Curb,  Flywheel,  and  Bandwagon)     §  YellowZ  –  Yellow  Cab  employing  p2p  drivers   §  Less  dis0nc0on  among  classic  ridesharing,  ridesourcing,  and   commercial  transporta0on   ©  UC  Berkeley,  2015  Shaheen,  2015  
  • 32.
    Ridesourcing/TNCs:  Service  that allows  passengers   to  connect  with  and  pay  drivers    who  use  their   personal  vehicles  for  trips  facilitated  through  a  mobile   applicaCon       Street  Hail:     Hailed  with  a  raised  hand  or  by  standing  at  a  taxi   stand  or  specified  loading  zone E-­‐Hail:     Hailed  by  dispatching  a  for-­‐hire  driver  using  a   smartphone  applicaCon FOR-­‐HIRE  VEHICLE  ACCESS  MODELS   ©  UC  Berkeley,  2015  
  • 33.
    RIDESOURCING/TNCS   §  Plavorm  used  to  “source”  rides   from  a  driver  pool   §  App-­‐based,  on-­‐demand  ride   services   §  Transporta0on  Network   Companies  (TNCs)   §  Uber  (uberX  and  uberXL)   §  Lyn   §  Shuddle     §  Sidecar   §  Summon   §  Wingz   ©  UC  Berkeley,  2015   Shaheen,  2015  
  • 34.
    SOME  RIDESOURCING/E-­‐HAIL     MARKET  TRENDS   §  Lyn:  60  ci0es;  51,000  drivers  (2014)   §  Uber:  58  countries;  311  ci0es;  over  162,000  drivers  in  U.S.   §  Sidecar:  10  ci0es;  ~10,000  drivers   §  Flywheel:  6  ci0es,  over  5,000  drivers     §  Curb:  60  ci0es;  35,000  cabs     Said,  2015;  Miller,  2015   ©  UC  Berkeley,  2015  
  • 35.
    RIDESOURCING:  SOME  EARLY   UNDERSTANDING   Taxi,  39%   Bus,  24%   Rail,  9%   Walk,  8%   Drive   Own  Car,   6%   Bike,  2%   Get  A   Ride,  1%   Other,   11%   §  92%  would  have  s0ll  made   this  trip   §  8%  induced  travel  effect   §  33%  would  have  taken  public   transit  (bus  or  rail)     §  4%  named  a  transit  sta0on   origin/des0na0on,  sugges0ng   some  ridesourcing  usage  to   access  public  transporta0on   §  20%  avoided  driving  aner   drinking     Rayle  et  al.  2014   How  would  you  have  made  this  trip  if  Uber/ LyP/Sidecar  were  not  available?     ©  UC  Berkeley,  2015  
  • 36.
    KEY  FINDINGS:  WAIT  TIMES   Rayle  et  al,  2014   About  how  long  did  you  wait  for  your  ride  (from  the  Wme  you   made  the  request  to  the  Wme  the  vehicle  arrived)?   Percentages  of  wait  0mes  less  than  or  equal  to  10  minutes:   Wait  Times   Ridesourcing   Taxi  (Phone)   Taxi  (Street  Hail)   M-­‐F  4am-­‐6pm   93%   35%   39%   M-­‐F  (6pm-­‐4am)   92%   16%   33%   S-­‐Su   88%   16%   25%  
  • 37.
    INDUSTRY  DEVELOPMENTS:   MERGING  INNOVATIONS   §  Ridespliing  within  TNCs/ridesourcing   §  Lyn  Line   §  Sidecar  Shared  Rides   §  uberPOOL   § Via  in  ManhaIan  merges  aspects  of  taxi,   TNCs/ridesourcing,  and  ridesplixng   §  Drivers  and  vehicles  contracted  to  taxi/limo   company   §  Flat-­‐rate  fares  with  set  zone  and  opera0ng  hours   §  Shared  rides  with  others  going  similar  direc0on   ©  UC  Berkeley,  2015   Shaheen,  2015  
  • 38.
  • 39.
    SHARED  MOBILITY  DEVELOPMENTS   e-­‐Bikesharing   §  Milan’s  BikeMi  tradi0onal  bikesharing  and  e-­‐bikes  from  same  kiosks   §  4,600  bicycles  (3,600  pushbikes  and  1,000  e-­‐bikes)   TransportaWon  Courier  Services  (TCS)  offering  p2p  deliveries  (e.g.,   Nimber  app  in  UK)     §  Launched  in  2013,  Nimber  has  30,000  members  and  delivers  ~10,000   packages  a  year   Flexible  Transit  Services  (e.g.,  Via,  Bridj,  Chariot,  Leap)   P2P  Services  focused  on  college  market,  airport  travelers,  and   bicycle  users     ©  UC  Berkeley,  2015   Shaheen,  2015  
  • 40.
    BLURRING  LINES:  CONVERGENCE?   Carsharing  Services   Transporta*on  Network  Companies   Public  Transit  Services   Car  Ownership  /  P2P  Carsharing     SIMILAR  ATTRIBUTES   ©  UC  Berkeley,  2015   Michael  Galczynski,  2015  
  • 41.
    FUTURE:  CONFLUENCE  OF  TRENDS   Shared  Mobility     Electric   Vehicles   Autonomous   Vehicles   ©  UC  Berkeley,  2015   Shaheen,  2015  
  • 42.
    42   Rapid NetworkBoarding Island Concept: Timothy Papandreou Illustration: Kathleen Phu and Audrey Koh THE  FUTURE?   ©  UC  Berkeley,  2015  
  • 43.
    SUMMARY   § Growing  ecosystem  of  services  in  mobility  +  sharing   economy   § Percep0ons  +  behaviors  shining   § Long  history  of  shared  mobility  –  da0ng  to  as  early  as   1940s  with  ridesharing  and  carsharing     § Over  4.8  M  members  and  ~104,000  vehicles  as  of   October  2014     § Shared  mobility  services:  ranging  from  less  to  well   understood   § Lines  blurring,  par0cularly  in  area  of  on-­‐demand  mobility   § Future  convergence  of  sharing,  EVs,  and  AVs?       ©  UC  Berkeley,  2015  
  • 44.
    ACKNOWLEDGEMENTS   §  Mineta  Transporta0on  Ins0tute,  San   Jose  State  University   §  California  Department  of   Transporta0on   §  Adam  Cohen,  Elliot  Mar0n,  Nelson   Chan,  MaI  Christensen,  and  Michael   Galczynski,  TSRC,  UC  Berkeley   §  Special  thanks  to  the  worldwide   shared-­‐use  mobility  operators  and   experts  who  make  our  research   possible  including  Timothy   Papandreou  and  Russell  Meddin     www.tsrc.berkeley.edu   Email:  sshaheen@berkeley.edu   TwiIer:  SusanShaheen1   ©  UC  Berkeley,  2015