Download to read offline
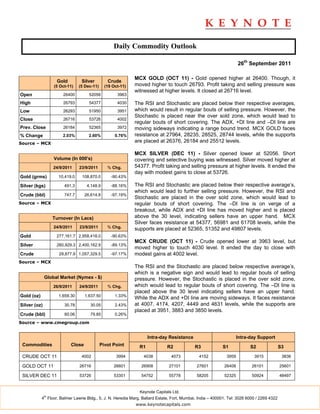

The daily commodity outlook summarizes prices and trends for gold, silver, and crude oil futures on the MCX exchange. Gold prices rose 2.03% and closed at 26716, supported by short covering but facing resistance. Silver prices gained 2.6% to close at 53726, also facing resistance with sellers maintaining an advantage. Crude oil futures climbed 0.76% to close at 4002 but face resistance with selling pressure remaining. Technical indicators show most commodities in oversold territory, signaling potential short-term rebounds.


