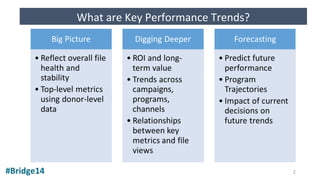
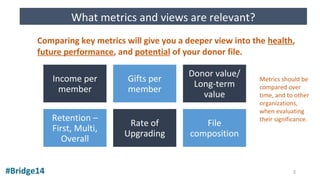
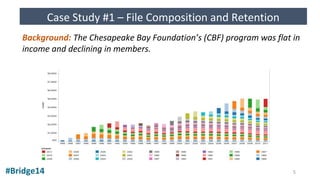
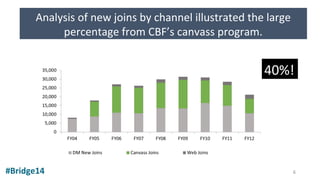
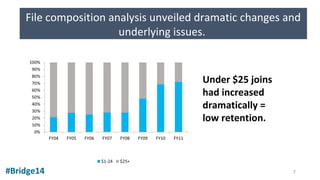
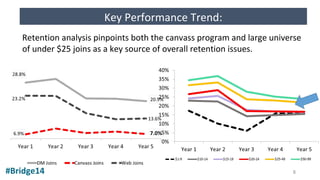
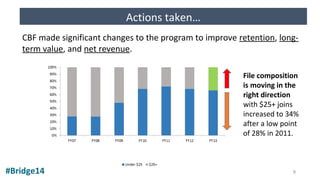
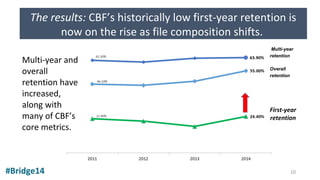
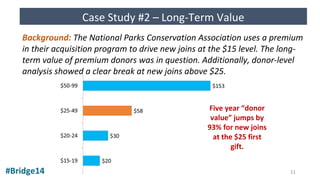
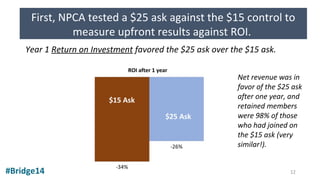
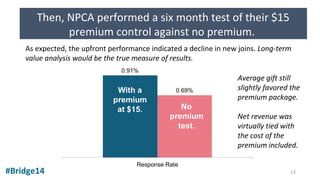
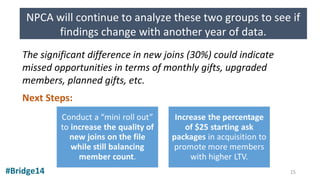
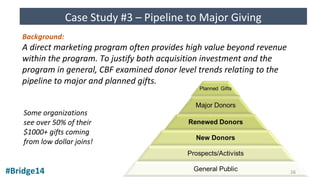
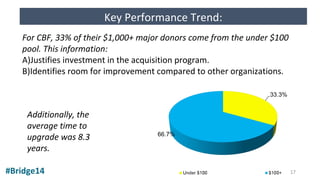
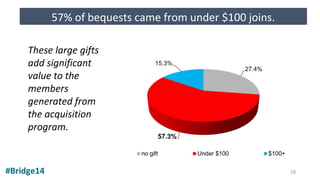
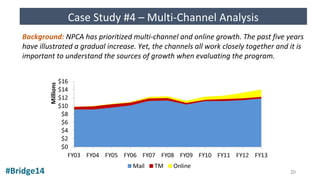
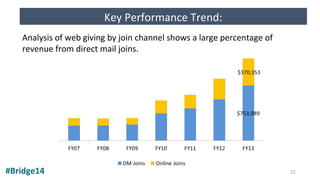
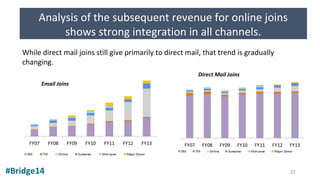
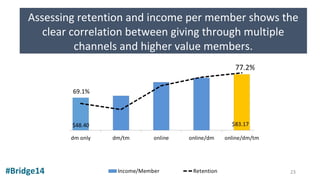
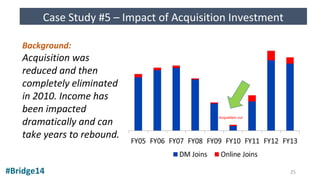
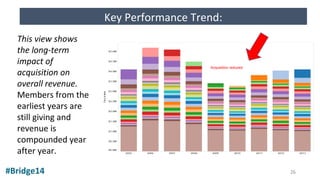
Key Performance
Trends Found Only in
Donor File Analysis
Data
Laura Connors, Deputy Vice President for Membership, National Parks Conservation
Association
Amelia Koch, Director of Membership, Chesapeake Bay Foundation
TJ Hillinger, Vice President, Avalon Consulting Group
#Bridge14 1
#Bridge14
What are Key Performance Trends?
2
#Bridge14
What metrics and views are relevant?
Comparing key metrics will give you a deeper view into the health,
future performance, and potential of your donor file.
3
Income per
member
Gifts per
member
Donor value/
Long-term
value
Retention –
First, Multi,
Overall
Rate of
Upgrading
File
composition
Metrics should be
compared over
time, and to other
organizations,
when evaluating
their significance.
#Bridge14
5 Case Studies
Critical views into donor-level data…
1.File Composition & Retention
2.Long-Term Value
3.Pipeline to Major Giving
4.Multi-Channel Relationships
5.Impact of Acquisition Investment
4
#Bridge14
Case Study #1 – File Composition and Retention
Background: The Chesapeake Bay Foundation’s (CBF) program was flat in
income and declining in members.
5
#Bridge14
Analysis of new joins by channel illustrated the large
percentage from CBF’s canvass program.
40%!
6
#Bridge14
File composition analysis unveiled dramatic changes and
underlying issues.
Under $25 joins
had increased
dramatically =
low retention.
7
#Bridge14
Key Performance Trend:
Retention analysis pinpoints both the canvass program and large universe
of under $25 joins as a key source of overall retention issues.
8
#Bridge14
Actions taken…
CBF made significant changes to the program to improve retention, long-
term value, and net revenue.
File composition
is moving in the
right direction
with $25+ joins
increased to 34%
after a low point
of 28% in 2011.
9
#Bridge14
The results: CBF’s historically low first-year retention is
now on the rise as file composition shifts.
10
First-year
retention
Overall
retention
Multi-year
retention
Multi-year and
overall
retention have
increased,
along with
many of CBF’s
core metrics.
#Bridge14
Case Study #2 – Long-Term Value
Background: The National Parks Conservation Association uses a premium
in their acquisition program to drive new joins at the $15 level. The long-
term value of premium donors was in question. Additionally, donor-level
analysis showed a clear break at new joins above $25.
Five year “donor
value” jumps by
93% for new joins
at the $25 first
gift.
11
#Bridge14
First, NPCA tested a $25 ask against the $15 control to
measure upfront results against ROI.
Year 1 Return on Investment favored the $25 ask over the $15 ask.
Net revenue was in
favor of the $25 ask
after one year, and
retained members
were 98% of those
who had joined on
the $15 ask (very
similar!).
12
ROI after 1 year
#Bridge14
Then, NPCA performed a six month test of their $15
premium control against no premium.
As expected, the upfront performance indicated a decline in new joins. Long-term
value analysis would be the true measure of results.
Average gift still
slightly favored the
premium package.
Net revenue was
virtually tied with
the cost of the
premium included.
13
#Bridge14
Key Performance Trend:
Evaluating the new joins from each group at 2 years out unveiled more
interesting findings about the test.
With a
premium
at $15.
14
Despite far fewer
joins, the No
Premium group
produced similar
net revenue after
one year, and
individual donors
had a better long-
term value.
#Bridge14
NPCA will continue to analyze these two groups to see if
findings change with another year of data.
The significant difference in new joins (30%) could indicate
missed opportunities in terms of monthly gifts, upgraded
members, planned gifts, etc.
Next Steps:
15
#Bridge14
Case Study #3 – Pipeline to Major Giving
Background:
A direct marketing program often provides high value beyond revenue
within the program. To justify both acquisition investment and the
program in general, CBF examined donor level trends relating to the
pipeline to major and planned gifts.
Some organizations
see over 50% of their
$1000+ gifts coming
from low dollar joins!
16
#Bridge14
Key Performance Trend:
For CBF, 33% of their $1,000+ major donors come from the under $100
pool. This information:
A)Justifies investment in the acquisition program.
B)Identifies room for improvement compared to other organizations.
Additionally, the
average time to
upgrade was 8.3
years.
17
#Bridge14
57% of bequests came from under $100 joins.
These large gifts
add significant
value to the
members
generated from
the acquisition
program.
18
#Bridge14
To continue moving members up the pipeline…
19
CBF continues
to monitor
trends on an
annual basis.
#Bridge14
Case Study #4 – Multi-Channel Analysis
Background: NPCA has prioritized multi-channel and online growth. The past five years
have illustrated a gradual increase. Yet, the channels all work closely together and it is
important to understand the sources of growth when evaluating the program.
20
#Bridge14
Key Performance Trend:
Analysis of web giving by join channel shows a large percentage of
revenue from direct mail joins.
21
#Bridge14
Analysis of the subsequent revenue for online joins
shows strong integration in all channels.
While direct mail joins still give primarily to direct mail, that trend is gradually
changing.
Email Joins
22
#Bridge14
Assessing retention and income per member shows the
clear correlation between giving through multiple
channels and higher value members.
23
#Bridge14
Showing the close tie between all channels further
justifies continued investment in the mail, as well as
online.
24
NPCA’s progress
confirms the need to
provide multi-channel
opportunities.
Analysis shows
continued room for
improvement with
additional integration
strategies.
Background:
Acquisition was
reduced and then
completely eliminated
in 2010. Income has
been impacted
dramatically and can
take years to rebound.
#Bridge14
Case Study #5 – Impact of Acquisition Investment
Acquisition cut
25
#Bridge14
Key Performance Trend:
Acquisition reduced
This view shows
the long-term
impact of
acquisition on
overall revenue.
Members from the
earliest years are
still giving and
revenue is
compounded year
after year.
26
#Bridge14
Results: The file is slowly rebounding, but will take time
to return to past highs.
27
Quarterly and
annual
oversight of
key metrics
through
dashboards
and full file
analysis.
Identification
of changing
performance
trends.
Continuous
goal
evaluation,
resetting,
and
forecasting.
Education
and
reporting to
leadership.
REPEAT.
#Bridge14
So, how do you really use this information?
28
Questions?
#Bridge14 29
Thank you!
Don’t forget to visit the
Solutions Showcase!
Many of the ideas discussed today are on display at the
Solutions Showcase!
#Bridge14 30

Key Performance Trends Found Only in Donor File Analysis Data - Bridge 2014

  • 1.
    Key Performance Trends FoundOnly in Donor File Analysis Data Laura Connors, Deputy Vice President for Membership, National Parks Conservation Association Amelia Koch, Director of Membership, Chesapeake Bay Foundation TJ Hillinger, Vice President, Avalon Consulting Group #Bridge14 1
  • 2.
    #Bridge14 What are KeyPerformance Trends? 2
  • 3.
    #Bridge14 What metrics andviews are relevant? Comparing key metrics will give you a deeper view into the health, future performance, and potential of your donor file. 3 Income per member Gifts per member Donor value/ Long-term value Retention – First, Multi, Overall Rate of Upgrading File composition Metrics should be compared over time, and to other organizations, when evaluating their significance.
  • 4.
    #Bridge14 5 Case Studies Criticalviews into donor-level data… 1.File Composition & Retention 2.Long-Term Value 3.Pipeline to Major Giving 4.Multi-Channel Relationships 5.Impact of Acquisition Investment 4
  • 5.
    #Bridge14 Case Study #1– File Composition and Retention Background: The Chesapeake Bay Foundation’s (CBF) program was flat in income and declining in members. 5
  • 6.
    #Bridge14 Analysis of newjoins by channel illustrated the large percentage from CBF’s canvass program. 40%! 6
  • 7.
    #Bridge14 File composition analysisunveiled dramatic changes and underlying issues. Under $25 joins had increased dramatically = low retention. 7
  • 8.
    #Bridge14 Key Performance Trend: Retentionanalysis pinpoints both the canvass program and large universe of under $25 joins as a key source of overall retention issues. 8
  • 9.
    #Bridge14 Actions taken… CBF madesignificant changes to the program to improve retention, long- term value, and net revenue. File composition is moving in the right direction with $25+ joins increased to 34% after a low point of 28% in 2011. 9
  • 10.
    #Bridge14 The results: CBF’shistorically low first-year retention is now on the rise as file composition shifts. 10 First-year retention Overall retention Multi-year retention Multi-year and overall retention have increased, along with many of CBF’s core metrics.
  • 11.
    #Bridge14 Case Study #2– Long-Term Value Background: The National Parks Conservation Association uses a premium in their acquisition program to drive new joins at the $15 level. The long- term value of premium donors was in question. Additionally, donor-level analysis showed a clear break at new joins above $25. Five year “donor value” jumps by 93% for new joins at the $25 first gift. 11
  • 12.
    #Bridge14 First, NPCA testeda $25 ask against the $15 control to measure upfront results against ROI. Year 1 Return on Investment favored the $25 ask over the $15 ask. Net revenue was in favor of the $25 ask after one year, and retained members were 98% of those who had joined on the $15 ask (very similar!). 12 ROI after 1 year
  • 13.
    #Bridge14 Then, NPCA performeda six month test of their $15 premium control against no premium. As expected, the upfront performance indicated a decline in new joins. Long-term value analysis would be the true measure of results. Average gift still slightly favored the premium package. Net revenue was virtually tied with the cost of the premium included. 13
  • 14.
    #Bridge14 Key Performance Trend: Evaluatingthe new joins from each group at 2 years out unveiled more interesting findings about the test. With a premium at $15. 14 Despite far fewer joins, the No Premium group produced similar net revenue after one year, and individual donors had a better long- term value.
  • 15.
    #Bridge14 NPCA will continueto analyze these two groups to see if findings change with another year of data. The significant difference in new joins (30%) could indicate missed opportunities in terms of monthly gifts, upgraded members, planned gifts, etc. Next Steps: 15
  • 16.
    #Bridge14 Case Study #3– Pipeline to Major Giving Background: A direct marketing program often provides high value beyond revenue within the program. To justify both acquisition investment and the program in general, CBF examined donor level trends relating to the pipeline to major and planned gifts. Some organizations see over 50% of their $1000+ gifts coming from low dollar joins! 16
  • 17.
    #Bridge14 Key Performance Trend: ForCBF, 33% of their $1,000+ major donors come from the under $100 pool. This information: A)Justifies investment in the acquisition program. B)Identifies room for improvement compared to other organizations. Additionally, the average time to upgrade was 8.3 years. 17
  • 18.
    #Bridge14 57% of bequestscame from under $100 joins. These large gifts add significant value to the members generated from the acquisition program. 18
  • 19.
    #Bridge14 To continue movingmembers up the pipeline… 19 CBF continues to monitor trends on an annual basis.
  • 20.
    #Bridge14 Case Study #4– Multi-Channel Analysis Background: NPCA has prioritized multi-channel and online growth. The past five years have illustrated a gradual increase. Yet, the channels all work closely together and it is important to understand the sources of growth when evaluating the program. 20
  • 21.
    #Bridge14 Key Performance Trend: Analysisof web giving by join channel shows a large percentage of revenue from direct mail joins. 21
  • 22.
    #Bridge14 Analysis of thesubsequent revenue for online joins shows strong integration in all channels. While direct mail joins still give primarily to direct mail, that trend is gradually changing. Email Joins 22
  • 23.
    #Bridge14 Assessing retention andincome per member shows the clear correlation between giving through multiple channels and higher value members. 23
  • 24.
    #Bridge14 Showing the closetie between all channels further justifies continued investment in the mail, as well as online. 24 NPCA’s progress confirms the need to provide multi-channel opportunities. Analysis shows continued room for improvement with additional integration strategies.
  • 25.
    Background: Acquisition was reduced andthen completely eliminated in 2010. Income has been impacted dramatically and can take years to rebound. #Bridge14 Case Study #5 – Impact of Acquisition Investment Acquisition cut 25
  • 26.
    #Bridge14 Key Performance Trend: Acquisitionreduced This view shows the long-term impact of acquisition on overall revenue. Members from the earliest years are still giving and revenue is compounded year after year. 26
  • 27.
    #Bridge14 Results: The fileis slowly rebounding, but will take time to return to past highs. 27
  • 28.
    Quarterly and annual oversight of keymetrics through dashboards and full file analysis. Identification of changing performance trends. Continuous goal evaluation, resetting, and forecasting. Education and reporting to leadership. REPEAT. #Bridge14 So, how do you really use this information? 28
  • 29.
  • 30.
    Thank you! Don’t forgetto visit the Solutions Showcase! Many of the ideas discussed today are on display at the Solutions Showcase! #Bridge14 30