Offshore fresh groundwater reserves as a global phenomenon
Bull Kelp Stress from Ocean Acidification and Salinity Changes
1. • Three replicate tanks per condition
• Three blades per tank
• Fv/Fm (quantum efficiency of photosystem
II) was used to measure stress
• Collected using a chlorophyll fluorometer
(PAM Jr.)
• Tank water was partially changed every day
to discourage decreases in pH from
biological processes
• Duration: five days
Ocean Acidification, Salinity Stress, and Bull Kelp
Evelyn Byer, Pitzer College
1.Introduction
A large quantity of precipitation, snow-melt, and
glacial-melt in the Vancouver area influences the
salinity of the local marine environment. When a
decrease in salinity is severe, mass die-offs can
occur. Climate change may affect the frequency
and severity of these events. Also, atmospheric
CO2 is rising, acidifying the local marine
environment. It is unclear how the ability of kelp
forests to survive freshwater events will be
affected by ocean acidification.
Fig. 1: Bull Kelp grows in the low intertidal to subtidal
regions. A) Collecting took place near Weston Park, West
Vancouver. B) Submerged Bull Kelp (Brenda Konar for NaGISA).
3.Design
Acknowledgements
This project would not have been possible
without the help and generosity of Chris Harley,
the Harley lab, Branwen Williams, and Diane
Thomson. Funding was received from the A.W.
Mellon Environmental Analysis Grant.
2.Aim
Assess the effects of ocean acidification on the
stress exhibited by Bull Kelp (Nereocystis
leutkeana) when subjected to decreasing salinities.
A)
B)
5.Implications
Elevated atmospheric CO2 may have a negative
compound effect on the stress of Bull Kelp as
salinity decreases. If true, ocean acidification will
inhibit the ability of Bull Kelp to survive seasonal
freshwater events near Vancouver.
Map
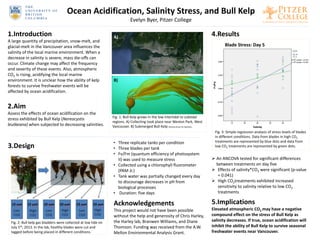
4.Results
Fig. 2: Bull kelp gas bladders were collected at low tide on
July 5th, 2013. In the lab, healthy blades were cut and
tagged before being placed in different conditions.
Blade Stress: Day 5
Fig. 3: Simple regression analysis of stress levels of blades
in different conditions. Data from blades in high CO2
treatments are represented by blue dots and data from
low CO2 treatments are represented by green dots.
An ANCOVA tested for significant differences
between treatments on day five
Effects of salinity*CO2 were significant (p-value
= 0.041)
High CO2treatments exhibited increased
sensitivity to salinity relative to low CO2
treatments
A)