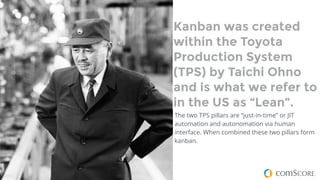
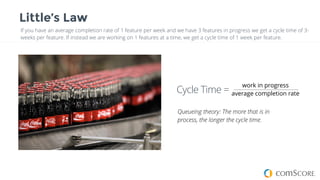
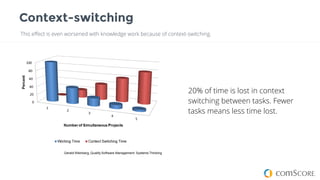
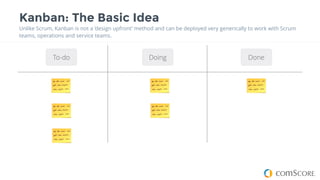
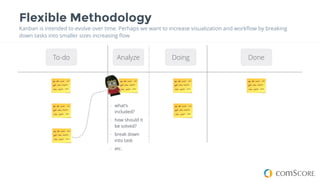
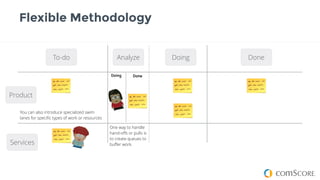
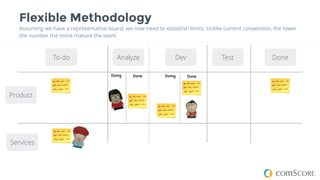
kanbanAnthony Brown Director, Solutions Consulting
Overview for Analytics and Services teams
pull, not push!
51
In order to visualize work,
we need to understand
how work works.
visualization
Kanban, means visual
board in Japanese.
Kanban was created
within the Toyota
Production System
(TPS) by Taichi Ohno
and is what we refer to
in the US as “Lean”.
The two TPS pillars are “just-in-time” or JIT
automation and autonomation via human
interface. When combined these two pillars form
kanban.
Principles
Plan
Visualize Workflow
Limit Work-in-progress
Analyze, Improve
Kanban is predicated by limiting the work in progress, and only pulling
work from a queue once work is complete. Traditional project
management promotes moving large volumes of work between groups,
whereas lean or kanban promote limiting the amount of work in
progress and completing small amounts. This allows teams to really
understand their work and remove waste or non-valued tasks.
Time is money.
If we can deliver faster to customers, they are able to harvest the benefits of our work and can pay
us sooner to keep doing what we are, and what our competitors are not doing.
Cycle Time =
If you have an average completion rate of 1 feature per week and we have 3 features in progress we get a cycle time of 3-
weeks per feature. If instead we are working on 1 features at a time, we get a cycle time of 1 week per feature.
Little’s Law
work in progress
average completion rate
Queueing theory: The more that is in
process, the longer the cycle time.
This effect is even worsened with knowledge work because of context-switching.
Context-switching
20% of time is lost in context
switching between tasks. Fewer
tasks means less time lost.
Kanban: The Basic Idea
Unlike Scrum, Kanban is not a ‘design upfront’ method and can be deployed very generically to work with Scrum
teams, operations and service teams.
To-do
16
Doing Done
Flexible Methodology
Kanban is intended to evolve over time. Perhaps we want to increase visualization and workflow by breaking
down tasks into smaller sizes increasing flow
To-do
16
Doing DoneAnalyze
- what’s
included?
- how should it
be solved?
- break down
into task
- etc.
Flexible Methodology
To-do
16
Doing DoneAnalyze
One way to handle
hand-offs or pulls is
to create queues to
buffer work.
You can also introduce specialized swim
lanes for specific types of work or resources
Doing Done
Product
Services
Flexible Methodology
Assuming we have a representative board, we now need to establish limits. Unlike current convention, the lower
the number the more mature the team.
To-do
16
Dev DoneAnalyze
Doing Done
Product
Services
Doing Done
Test
Work-in-Progress Limits
We are going to place constraints in all of the ‘doing’ status columns allowing 2-points per person.
To-do
16
Dev DoneAnalyze
Doing Done
Product
Services
Doing Done
Test
( )2 = 10
4 24WIP
Bottlenecks
Let’s load the board with cards and ask a couple of questions:
To-do
16
Dev DoneAnalyze
Doing Done
Product
Services
Doing Done
Test
4 24WIP
1. Where is the bottleneck?
2. How many cards can the engineering take currently?
3. How would you improve the flow of the current cards?
Starvation
Dev has no active work or ability to pull from analyze creating starvation.
To-do
16
Dev DoneAnalyze
Doing Done
Product
Services
Doing Done
Test
4 24WIP
This can be prevented looking at leading indicators.
Bugs
A Customer Service request turns into a bug, what do we do? Is it an emergency, can it wait?
To-do
16
Dev DoneAnalyze
Doing Done
Product
Services
Doing Done
Test
4 24WIP
Emergencies
A Customer has an urgent request, that cannot wait, what do we do?
To-do
16
Dev DoneAnalyze
Doing Done
Product
Services
Doing Done
Test
4 24WIP
!
Differing Items
Work comes in different shapes, sizes and scope. How do we work with this?
To-do
16
Dev DoneAnalyze
Doing Done
Product
Services
Doing Done
Test
4 24WIP
Metrics: Weekly Progress Example
Sources
14
Basecamp
01. ALL / IN-PROGRESS TASKS
Removed sensitive project data
02. WORK
Done
61
In Progress
13
Validation
2
All Tasks
Urgent
1
Default
4
CMR
10
In-progress
0
30
60
90
120
2014-04-09
2014-04-12
2014-04-15
2014-04-18
2014-04-21
2014-04-24
2014-04-27
2014-04-30
2014-05-03
PROJECT STATUS = GREEN
4.5AVG DAYS PER TASK
Burn-down or Burn-up?
Kanban
14
Basecamp
0
30
60
90
120
2014-04-09
2014-04-12
2014-04-15
2014-04-18
2014-04-21
2014-04-24
2014-04-27
2014-04-30
2014-05-03
Scrum
Dissecting a Burn-down Chart
Sources
14
Basecamp
0
30
60
90
120
2014-04-09
2014-04-12
2014-04-15
2014-04-18
2014-04-21
2014-04-24
2014-04-27
2014-04-30
2014-05-03
Cycle Time
Lead Time
NewTasks
Backlog
WIP
Remainder
THANK YOU.
88
awbrown

Kanban Primer

  • 1.
    kanbanAnthony Brown Director,Solutions Consulting Overview for Analytics and Services teams
  • 2.
  • 3.
    51 In order tovisualize work, we need to understand how work works. visualization Kanban, means visual board in Japanese.
  • 4.
    Kanban was created withinthe Toyota Production System (TPS) by Taichi Ohno and is what we refer to in the US as “Lean”. The two TPS pillars are “just-in-time” or JIT automation and autonomation via human interface. When combined these two pillars form kanban.
  • 5.
    Principles Plan Visualize Workflow Limit Work-in-progress Analyze,Improve Kanban is predicated by limiting the work in progress, and only pulling work from a queue once work is complete. Traditional project management promotes moving large volumes of work between groups, whereas lean or kanban promote limiting the amount of work in progress and completing small amounts. This allows teams to really understand their work and remove waste or non-valued tasks.
  • 6.
    Time is money. Ifwe can deliver faster to customers, they are able to harvest the benefits of our work and can pay us sooner to keep doing what we are, and what our competitors are not doing.
  • 7.
    Cycle Time = Ifyou have an average completion rate of 1 feature per week and we have 3 features in progress we get a cycle time of 3- weeks per feature. If instead we are working on 1 features at a time, we get a cycle time of 1 week per feature. Little’s Law work in progress average completion rate Queueing theory: The more that is in process, the longer the cycle time.
  • 8.
    This effect iseven worsened with knowledge work because of context-switching. Context-switching 20% of time is lost in context switching between tasks. Fewer tasks means less time lost.
  • 9.
    Kanban: The BasicIdea Unlike Scrum, Kanban is not a ‘design upfront’ method and can be deployed very generically to work with Scrum teams, operations and service teams. To-do 16 Doing Done
  • 10.
    Flexible Methodology Kanban isintended to evolve over time. Perhaps we want to increase visualization and workflow by breaking down tasks into smaller sizes increasing flow To-do 16 Doing DoneAnalyze - what’s included? - how should it be solved? - break down into task - etc.
  • 11.
    Flexible Methodology To-do 16 Doing DoneAnalyze Oneway to handle hand-offs or pulls is to create queues to buffer work. You can also introduce specialized swim lanes for specific types of work or resources Doing Done Product Services
  • 12.
    Flexible Methodology Assuming wehave a representative board, we now need to establish limits. Unlike current convention, the lower the number the more mature the team. To-do 16 Dev DoneAnalyze Doing Done Product Services Doing Done Test
  • 13.
    Work-in-Progress Limits We aregoing to place constraints in all of the ‘doing’ status columns allowing 2-points per person. To-do 16 Dev DoneAnalyze Doing Done Product Services Doing Done Test ( )2 = 10 4 24WIP
  • 14.
    Bottlenecks Let’s load theboard with cards and ask a couple of questions: To-do 16 Dev DoneAnalyze Doing Done Product Services Doing Done Test 4 24WIP 1. Where is the bottleneck? 2. How many cards can the engineering take currently? 3. How would you improve the flow of the current cards?
  • 15.
    Starvation Dev has noactive work or ability to pull from analyze creating starvation. To-do 16 Dev DoneAnalyze Doing Done Product Services Doing Done Test 4 24WIP This can be prevented looking at leading indicators.
  • 16.
    Bugs A Customer Servicerequest turns into a bug, what do we do? Is it an emergency, can it wait? To-do 16 Dev DoneAnalyze Doing Done Product Services Doing Done Test 4 24WIP
  • 17.
    Emergencies A Customer hasan urgent request, that cannot wait, what do we do? To-do 16 Dev DoneAnalyze Doing Done Product Services Doing Done Test 4 24WIP !
  • 18.
    Differing Items Work comesin different shapes, sizes and scope. How do we work with this? To-do 16 Dev DoneAnalyze Doing Done Product Services Doing Done Test 4 24WIP
  • 19.
    Metrics: Weekly ProgressExample Sources 14 Basecamp 01. ALL / IN-PROGRESS TASKS Removed sensitive project data Removed sensitive project data 02. WORK Done 61 In Progress 13 Validation 2 All Tasks Urgent 1 Default 4 CMR 10 In-progress 0 30 60 90 120 2014-04-09 2014-04-12 2014-04-15 2014-04-18 2014-04-21 2014-04-24 2014-04-27 2014-04-30 2014-05-03 PROJECT STATUS = GREEN 4.5AVG DAYS PER TASK
  • 20.
  • 21.
    Dissecting a Burn-downChart Sources 14 Basecamp 0 30 60 90 120 2014-04-09 2014-04-12 2014-04-15 2014-04-18 2014-04-21 2014-04-24 2014-04-27 2014-04-30 2014-05-03 Cycle Time Lead Time NewTasks Backlog WIP Remainder
  • 22.