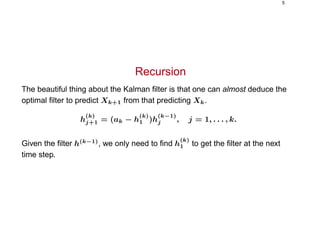
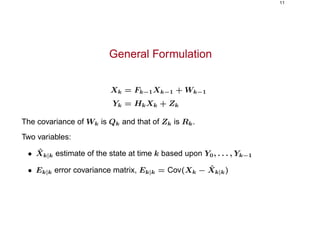
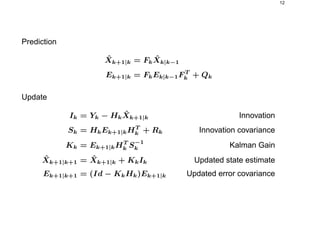
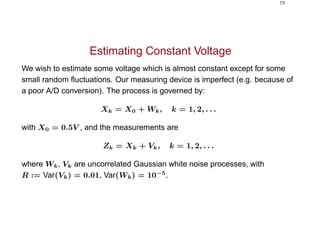
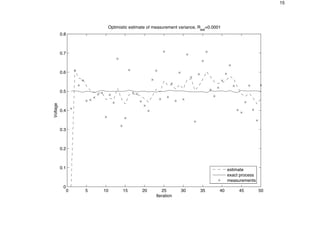
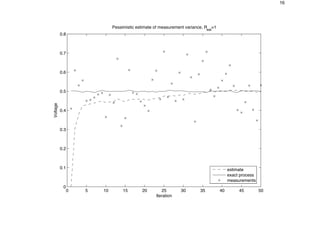
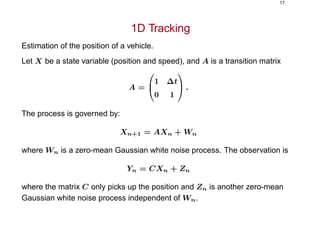
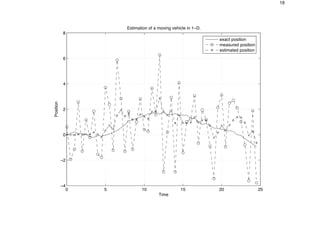
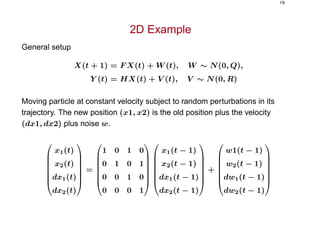
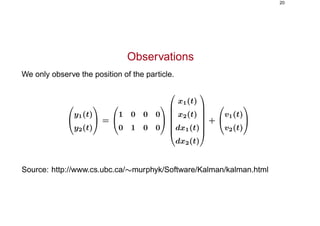
This document provides an overview of the Kalman filter, including its derivation and applications. It begins with an example of using a Kalman filter to estimate the position and velocity of a truck moving on rails. It then presents the general setup of the Kalman filter for estimating a stochastic dynamic system based on noisy observations. The derivation shows how to recursively calculate the optimal estimate and its error covariance. Several numerical examples are provided to illustrate Kalman filtering, including estimating a constant voltage, tracking a vehicle's position in 1D and 2D.


![7
Error of Prediction
To find h
(k)
1 , we look at the error of prediction
k = Xk − ˆXk
We have the recursion
k+1 = (ak − h
(k)
1 ) k + Wk − h
(k)
1 Zk
• 0 = Z0
• E( k) = 0
• E( 2
k+1) = [ak − h
(k)
1 ]2
E( 2
k) + E(W 2
k ) + [h
(k)
1 ]2
E(Z2
k)](https://image.slidesharecdn.com/kalman-180701101155/85/Kalman-7-320.jpg)


![21
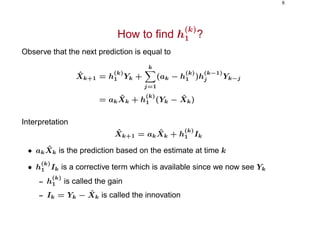
Implementation
% Make a point move in the 2D plane
% State = (x y xdot ydot). We only observe (x y).
% This code was used to generate Figure 17.9 of
% "Artificial Intelligence: a Modern Approach",
% Russell and Norvig, 2nd edition, Prentice Hall, in preparation.
% X(t+1) = F X(t) + noise(Q)
% Y(t) = H X(t) + noise(R)
ss = 4; % state size
os = 2; % observation size
F = [1 0 1 0; 0 1 0 1; 0 0 1 0; 0 0 0 1];
H = [1 0 0 0; 0 1 0 0];
Q = 1*eye(ss);
R = 10*eye(os);
initx = [10 10 1 0]’;
initV = 10*eye(ss);](https://image.slidesharecdn.com/kalman-180701101155/85/Kalman-21-320.jpg)
![22
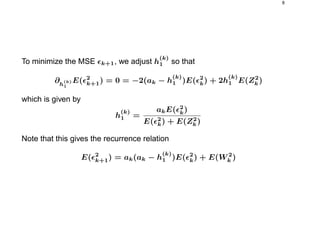
seed = 8; rand(’state’, seed);
randn(’state’, seed);
T = 50;
[x,y] = sample_lds(F,H,Q,R,initx,T);](https://image.slidesharecdn.com/kalman-180701101155/85/Kalman-22-320.jpg)
![23
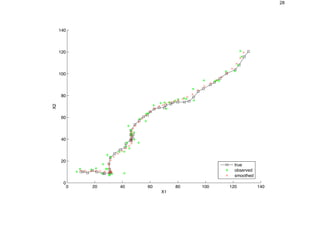
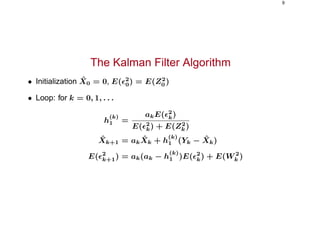
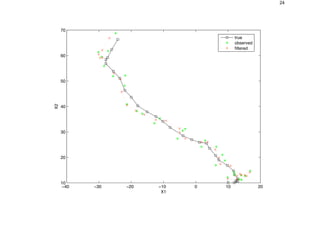
Apply Kalman Filter
[xfilt,Vfilt] = kalman_filter(y,F,H,Q,R,initx,initV);
dfilt = x([1 2],:) - xfilt([1 2],:);
mse_filt = sqrt(sum(sum(dfilt.ˆ2)))
figure;
plot(x(1,:), x(2,:), ’ks-’);
hold on
plot(y(1,:), y(2,:), ’g*’);
plot(xfilt(1,:), xfilt(2,:), ’rx:’);
hold off
legend(’true’, ’observed’, ’filtered’, 0)
xlabel(’X1’), ylabel(’X2’)](https://image.slidesharecdn.com/kalman-180701101155/85/Kalman-23-320.jpg)
![26
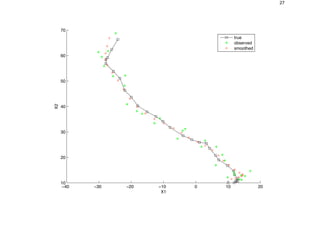
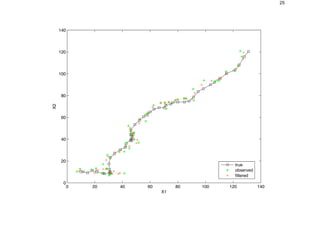
Apply Kalman Smoother
[xsmooth, Vsmooth] = kalman_smoother(y,F,H,Q,R,initx,initV);
dsmooth = x([1 2],:) - xsmooth([1 2],:);
mse_smooth = sqrt(sum(sum(dsmooth.ˆ2)))
figure;
hold on
plot(x(1,:), x(2,:), ’ks-’);
plot(y(1,:), y(2,:), ’g*’);
plot(xsmooth(1,:), xsmooth(2,:), ’rx:’);
hold off
legend(’true’, ’observed’, ’smoothed’, 0)
xlabel(’X1’), ylabel(’X2’)](https://image.slidesharecdn.com/kalman-180701101155/85/Kalman-26-320.jpg)