Download to read offline


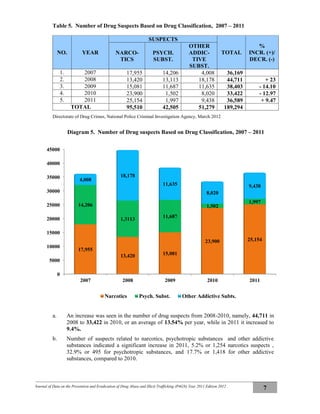
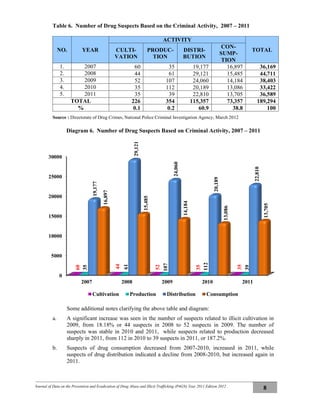
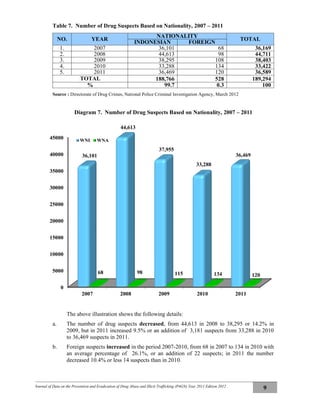
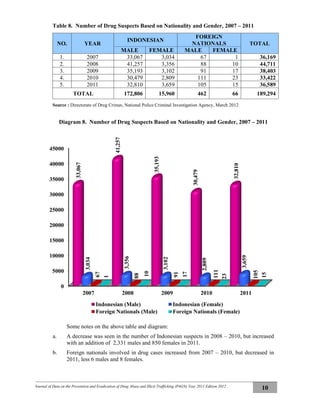
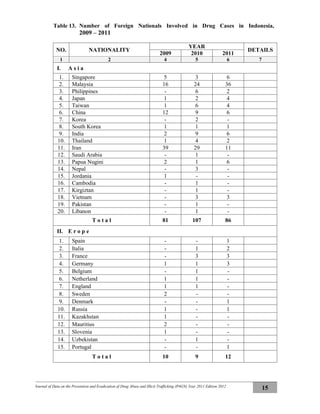
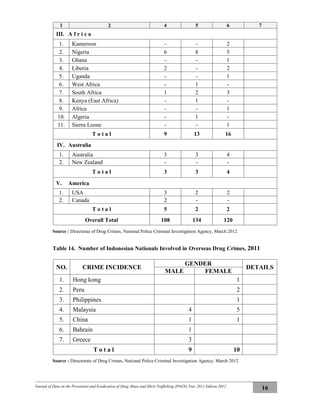

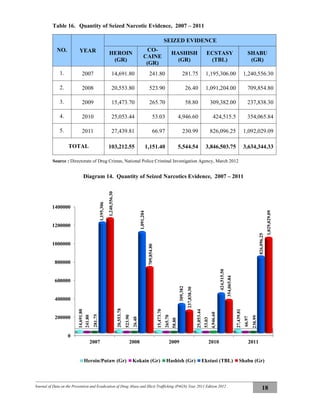
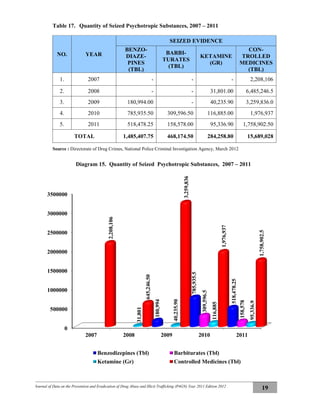
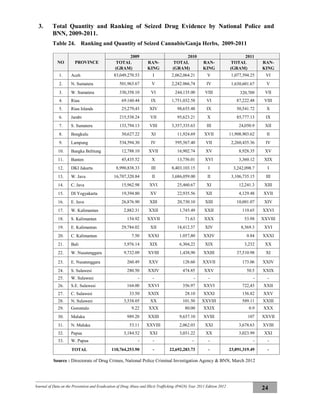
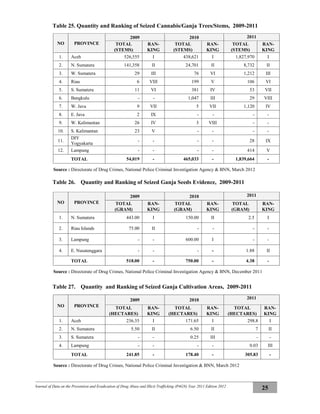
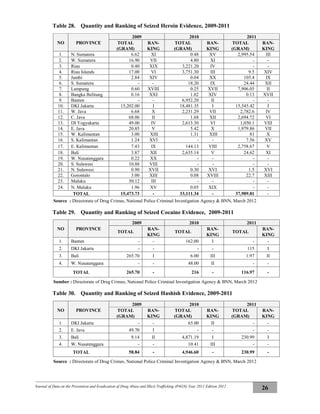
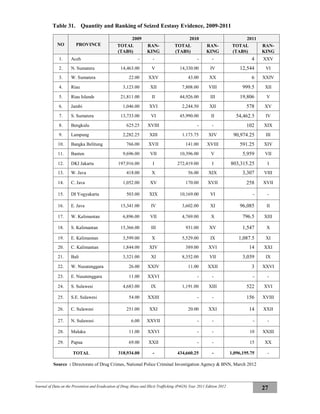


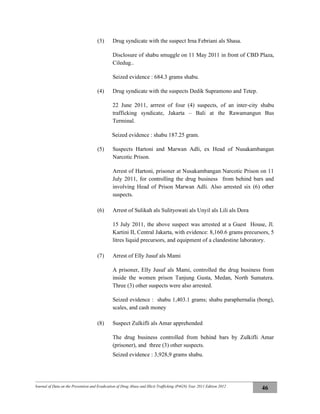


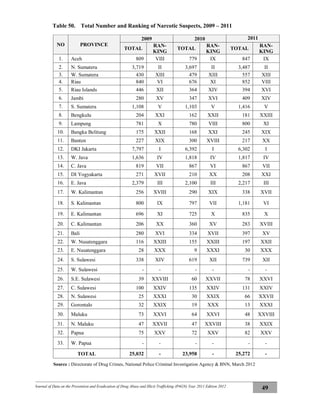
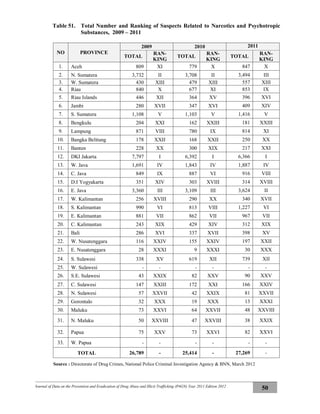
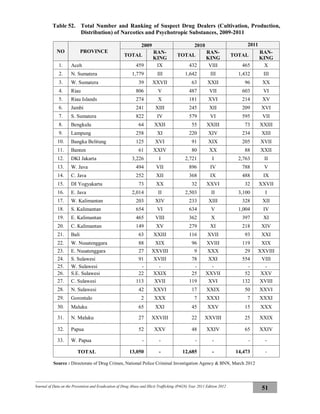
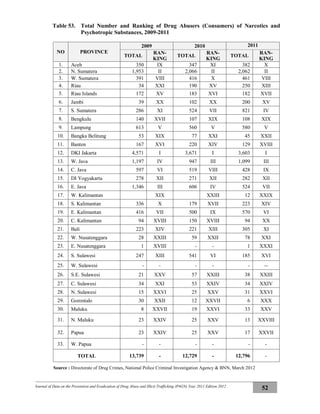
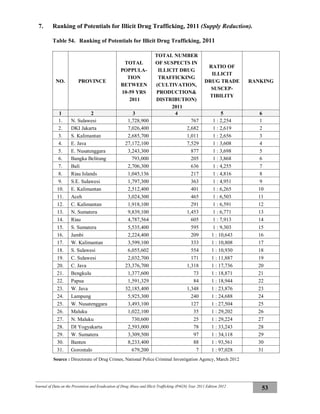

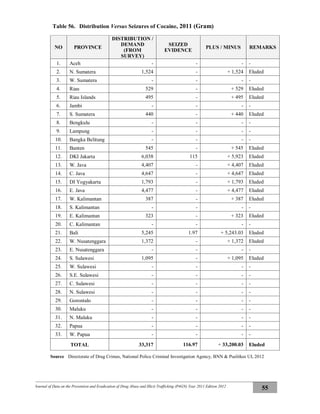
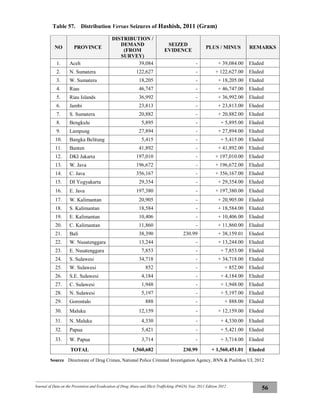
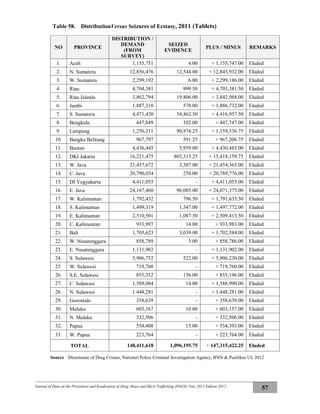
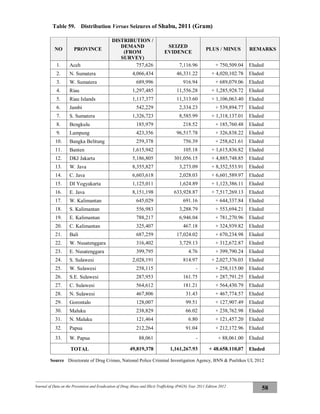
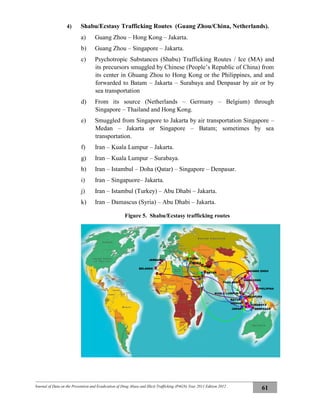

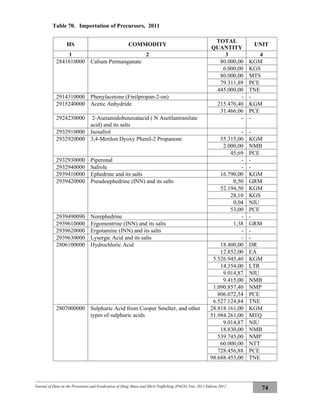


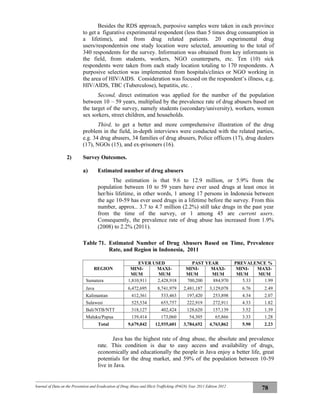
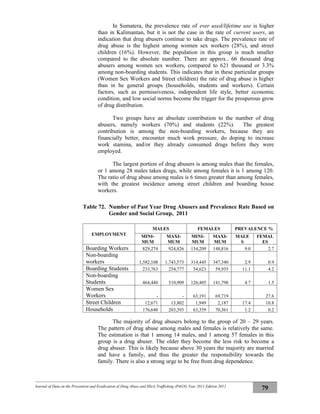
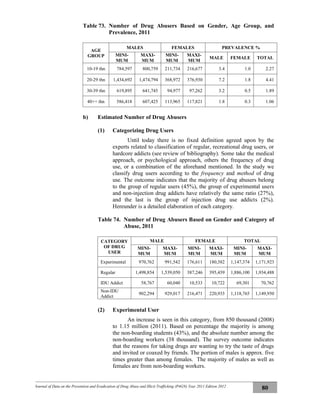
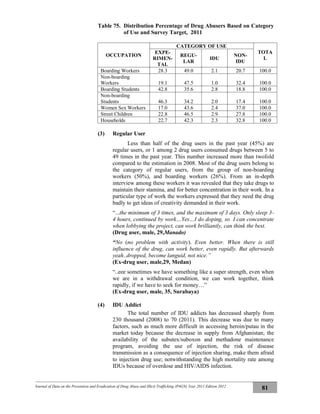
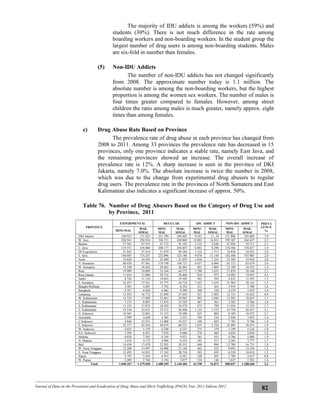


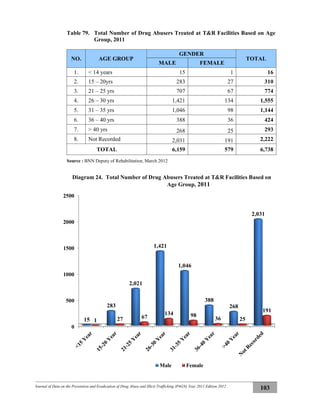
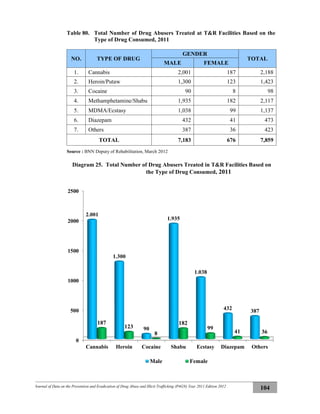
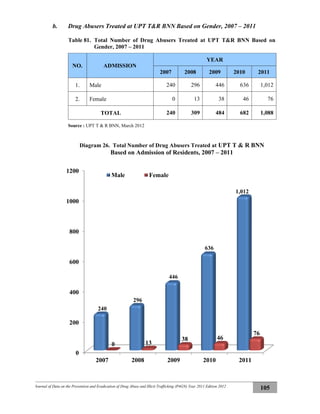
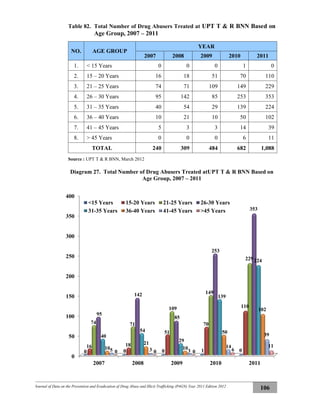


The document discusses the global threat of drug abuse and illicit trafficking, highlighting an increase in drug consumption and trafficking activities despite efforts to control these issues. It provides specific statistics on drug abuse trends and trafficking in Indonesia, noting significant rises in certain drugs like shabu, while others like cannabis and heroin have seen declines in cases. The overall prevalence of drug abuse in Indonesia is estimated at 2.2% among the population aged 10-60, representing about 3.8 million people.


