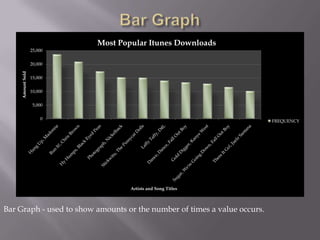
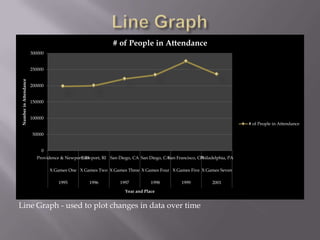
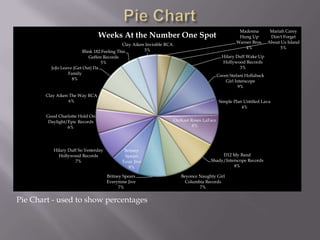
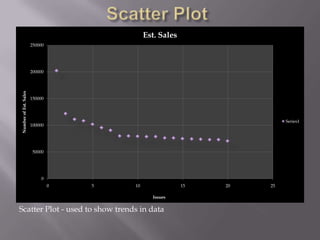
By: Josh and Travis
Most Popular Itunes Downloads
                  25,000


                  20,000
    Amount Sold


                  15,000


                  10,000


                   5,000


                      0
                                                                          FREQUENCY


                                   Artists and Song Titles


Bar Graph - used to show amounts or the number of times a value occurs.
# of People in Attendance
                       300000


                       250000
Number in Attendance


                       200000


                       150000


                       100000
                                                                                                                       # of People in Attendance

                       50000


                            0
                          Providence & Newport, RI
                                             Newport, RI San Diego, CA San Diego, CASan Francisco, CA
                                                                                                    Philadelphia, PA

                                X Games One X Games Two X Games Three X Games Four X Games Five X Games Seven

                                   1995           1996          1997          1998          1999          2001
                                                                  Year and Place


Line Graph - used to plot changes in data over time
Madonna         Mariah Carey
                                 Weeks At the Number One Spot                                           Hung Up         Don't Forget
                                                                                                       Warner Bros.    About Us Island
                                            Clay Aiken Invisible RCA
                                                                                                           4%                5%
                        Blink 182 Feeling This        5%
                            Geffen Records                                                      Hilary Duff Wake Up
                                  5%                                                            Hollywood Records
          JoJo Leave (Get Out) Da                                                                       3%
                  Family                                                                      Gwen Stefani Hollaback
                    8%                                                                           Girl Interscope
                                                                                                        9%

        Clay Aiken The Way RCA
                   6%                                                                         Simple Plan Untitled Lava
                                                                                                         4%

        Good Charlotte Hold On
         Daylight/Epic Records                                         Outkast Roses LaFace
                  6%                                                            8%


           Hilary Duff So Yesterday           Britney
             Hollywood Records                Spears                                         D12 My Band
                     7%                      Toxic Jive                                 Shady/Interscope Records
                                                8%                                                8%

                                      Britney Spears                      Beyonce Naughty Girl
                                      Everytime Jive                        Columbia Records
                                            7%                                    7%


Pie Chart - used to show percentages
Est. Sales
                       250000


                       200000
Number of Est. Sales


                       150000


                                                                         Series1
                       100000


                       50000


                           0
                                0   5   10                15   20   25

                                               Issues

Scatter Plot - used to show trends in data
   1. The Bar graph was chosen to show the
    differences in the amount of downloads between
    the current top songs

   2. The Line graph was chosen to show the
    differences in the attendance over a certain amount
    of time.

   3. The Pie chart shows the amount of time each
    song spent at the number 1 spot through percent's.
   4. The Scatter Plot graph shows the comparison of
    the different points of estimated sales for the
    comics and creates an average.
   1. The different downloads of the top songs on
    ITunes.
   2. The attendance at the different X-Games
    events each year.
   3. The percentage comparison on how long
    each song stayed at number 1.
   4. The comparisons of the estimated sales of the
    comics was illustrated through the scatter plot
    graph.

Josh and travis project1

  • 1.
  • 2.
    Most Popular ItunesDownloads 25,000 20,000 Amount Sold 15,000 10,000 5,000 0 FREQUENCY Artists and Song Titles Bar Graph - used to show amounts or the number of times a value occurs.
  • 3.
    # of Peoplein Attendance 300000 250000 Number in Attendance 200000 150000 100000 # of People in Attendance 50000 0 Providence & Newport, RI Newport, RI San Diego, CA San Diego, CASan Francisco, CA Philadelphia, PA X Games One X Games Two X Games Three X Games Four X Games Five X Games Seven 1995 1996 1997 1998 1999 2001 Year and Place Line Graph - used to plot changes in data over time
  • 4.
    Madonna Mariah Carey Weeks At the Number One Spot Hung Up Don't Forget Warner Bros. About Us Island Clay Aiken Invisible RCA 4% 5% Blink 182 Feeling This 5% Geffen Records Hilary Duff Wake Up 5% Hollywood Records JoJo Leave (Get Out) Da 3% Family Gwen Stefani Hollaback 8% Girl Interscope 9% Clay Aiken The Way RCA 6% Simple Plan Untitled Lava 4% Good Charlotte Hold On Daylight/Epic Records Outkast Roses LaFace 6% 8% Hilary Duff So Yesterday Britney Hollywood Records Spears D12 My Band 7% Toxic Jive Shady/Interscope Records 8% 8% Britney Spears Beyonce Naughty Girl Everytime Jive Columbia Records 7% 7% Pie Chart - used to show percentages
  • 5.
    Est. Sales 250000 200000 Number of Est. Sales 150000 Series1 100000 50000 0 0 5 10 15 20 25 Issues Scatter Plot - used to show trends in data
  • 6.
    1. The Bar graph was chosen to show the differences in the amount of downloads between the current top songs  2. The Line graph was chosen to show the differences in the attendance over a certain amount of time.  3. The Pie chart shows the amount of time each song spent at the number 1 spot through percent's.  4. The Scatter Plot graph shows the comparison of the different points of estimated sales for the comics and creates an average.
  • 7.
    1. The different downloads of the top songs on ITunes.  2. The attendance at the different X-Games events each year.  3. The percentage comparison on how long each song stayed at number 1.  4. The comparisons of the estimated sales of the comics was illustrated through the scatter plot graph.