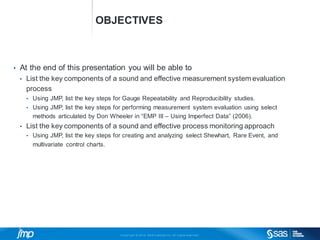
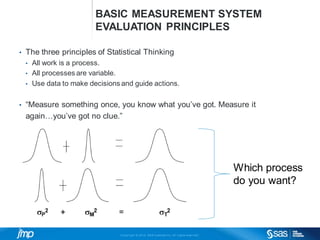
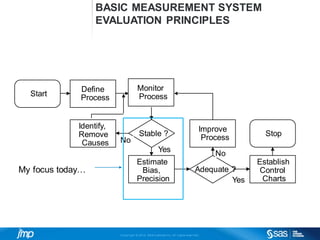
Copyri ght © 2014, SAS Institute Inc. Al l ri ghts reserved.
EVALUATING & MONITORING
YOUR PROCESS USING
MSA AND SPC
Peter Bartell
JMP Systems Engineer
peter.bartell@jmp.com
Copyri ght © 2014, SAS Institute Inc. Al l ri ghts reserved.
OBJECTIVES
• At the end of this presentation you will be able to
• List the key components of a sound and effective measurement system evaluation
process
• Using JMP, list the key steps for Gauge Repeatability and Reproducibility studies.
• Using JMP, list the key steps for performing measurement system evaluation using select
methods articulated by Don Wheeler in “EMP III – Using Imperfect Data” (2006).
• List the key components of a sound and effective process monitoring approach
• Using JMP, list the key steps for creating and analyzing select Shewhart, Rare Event, and
multivariate control charts.
Copyri ght © 2014, SAS Institute Inc. Al l ri ghts reserved.
BASIC MEASUREMENT SYSTEM
EVALUATION PRINCIPLES
• The three principles of Statistical Thinking
• All work is a process.
• All processes are variable.
• Use data to make decisions and guide actions.
• “Measure something once, you know what you’ve got. Measure it
again…you’ve got no clue.”
Which process
do you want?
Copyri ght © 2014, SAS Institute Inc. Al l ri ghts reserved.
BASIC MEASUREMENT SYSTEM
EVALUATION PRINCIPLES
Start
Define
Process
Monitor
Process
Stable ?
Identify,
Remove
Causes
Estimate
Bias,
Precision
Adequate ?
Establish
Control
Charts
Stop
Improve
ProcessNo
Yes
Yes
No
My focus today…
Copyri ght © 2014, SAS Institute Inc. Al l ri ghts reserved.
AN EXAMPLE OF GAUGE R & R
• Essentially a designed experiment coupled with appropriate analysis.
• Continuous and attribute responses.
• Focuses on repeatability and reproducibility of the system.
• Fixed, random effects, nesting vs. crossed designs, all considerations.
• Measuring multiple items, by multiple operators, across instruments, sites,
etc.
Cindy Tom GeorgeOperator (i)
Part (j) 1….10
Measurement (k)
y111… y3,10,3
Example: Using 2 Factors Crossed.jmp
Copyri ght © 2014, SAS Institute Inc. Al l ri ghts reserved.
AN EXAMPLE OF THE “EMP” METHOD
• Described by Don Wheeler in “EMP III – Using Imperfect Data” (2006)
• A novel use of xbar and R charts and other graphical approaches.
A B COperator (i)
Part (j) 1….5
y111… y3,5,2
Example: Using gasket.jmp
Measurement (k)
Copyri ght © 2014, SAS Institute Inc. Al l ri ghts reserved.
PROCESS MONITORING
• “Is the process behaving in a way that suggests there are no assignable
causes of variation occurring?”
• “If assignable causes rear their heads or occur, how will I know?”
AND
• “How can I balance the risk of making either of these two mistakes?”
• Going to look for assignable causes when they aren’t present.
• Failing to look for assignable causes when they are present.
• As Dr. Deming often asked, “By what method?”
Copyri ght © 2014, SAS Institute Inc. Al l ri ghts reserved.
PROCESS MONITORING APPROACH
• Phase I
• Process stabilization, characterizing common cause variability.
• Phase II
• Process monitoring, ongoing characterizationto identify assignable cause variability
in a timely fashion, with acceptable risk.
Copyri ght © 2014, SAS Institute Inc. Al l ri ghts reserved.
STATISTICAL PROCESS CONTROL
CHARTS
• Shewhart variables and attribute.
• AnnualSnowfall.jmp, (Individuals, Moving Range charts),
• SocketThickness.jmp (xbar, r charts), BottleTops.jmp (np chart)
• Rare event.
• FanBurnout.jmp (t chart)
• Multivariate charts (Hotelling’s T2)
• ThicknessPhaseI.jmp
• ThicknessPhaseII.jmp
• ThicknessTargets.jmp
• Via either the Control Chart Builder or Analyze -> Quality and Process ->
Control Chart path.

Evaluating & Monitoring Your Process Using MSA & SPC

  • 1.
    Copyri ght ©2014, SAS Institute Inc. Al l ri ghts reserved. EVALUATING & MONITORING YOUR PROCESS USING MSA AND SPC Peter Bartell JMP Systems Engineer peter.bartell@jmp.com
  • 2.
    Copyri ght ©2014, SAS Institute Inc. Al l ri ghts reserved. OBJECTIVES • At the end of this presentation you will be able to • List the key components of a sound and effective measurement system evaluation process • Using JMP, list the key steps for Gauge Repeatability and Reproducibility studies. • Using JMP, list the key steps for performing measurement system evaluation using select methods articulated by Don Wheeler in “EMP III – Using Imperfect Data” (2006). • List the key components of a sound and effective process monitoring approach • Using JMP, list the key steps for creating and analyzing select Shewhart, Rare Event, and multivariate control charts.
  • 3.
    Copyri ght ©2014, SAS Institute Inc. Al l ri ghts reserved. BASIC MEASUREMENT SYSTEM EVALUATION PRINCIPLES • The three principles of Statistical Thinking • All work is a process. • All processes are variable. • Use data to make decisions and guide actions. • “Measure something once, you know what you’ve got. Measure it again…you’ve got no clue.” Which process do you want?
  • 4.
    Copyri ght ©2014, SAS Institute Inc. Al l ri ghts reserved. BASIC MEASUREMENT SYSTEM EVALUATION PRINCIPLES Start Define Process Monitor Process Stable ? Identify, Remove Causes Estimate Bias, Precision Adequate ? Establish Control Charts Stop Improve ProcessNo Yes Yes No My focus today…
  • 5.
    Copyri ght ©2014, SAS Institute Inc. Al l ri ghts reserved. AN EXAMPLE OF GAUGE R & R • Essentially a designed experiment coupled with appropriate analysis. • Continuous and attribute responses. • Focuses on repeatability and reproducibility of the system. • Fixed, random effects, nesting vs. crossed designs, all considerations. • Measuring multiple items, by multiple operators, across instruments, sites, etc. Cindy Tom GeorgeOperator (i) Part (j) 1….10 Measurement (k) y111… y3,10,3 Example: Using 2 Factors Crossed.jmp
  • 6.
    Copyri ght ©2014, SAS Institute Inc. Al l ri ghts reserved. AN EXAMPLE OF THE “EMP” METHOD • Described by Don Wheeler in “EMP III – Using Imperfect Data” (2006) • A novel use of xbar and R charts and other graphical approaches. A B COperator (i) Part (j) 1….5 y111… y3,5,2 Example: Using gasket.jmp Measurement (k)
  • 7.
    Copyri ght ©2014, SAS Institute Inc. Al l ri ghts reserved. PROCESS MONITORING • “Is the process behaving in a way that suggests there are no assignable causes of variation occurring?” • “If assignable causes rear their heads or occur, how will I know?” AND • “How can I balance the risk of making either of these two mistakes?” • Going to look for assignable causes when they aren’t present. • Failing to look for assignable causes when they are present. • As Dr. Deming often asked, “By what method?”
  • 8.
    Copyri ght ©2014, SAS Institute Inc. Al l ri ghts reserved. PROCESS MONITORING APPROACH • Phase I • Process stabilization, characterizing common cause variability. • Phase II • Process monitoring, ongoing characterizationto identify assignable cause variability in a timely fashion, with acceptable risk.
  • 9.
    Copyri ght ©2014, SAS Institute Inc. Al l ri ghts reserved. STATISTICAL PROCESS CONTROL CHARTS • Shewhart variables and attribute. • AnnualSnowfall.jmp, (Individuals, Moving Range charts), • SocketThickness.jmp (xbar, r charts), BottleTops.jmp (np chart) • Rare event. • FanBurnout.jmp (t chart) • Multivariate charts (Hotelling’s T2) • ThicknessPhaseI.jmp • ThicknessPhaseII.jmp • ThicknessTargets.jmp • Via either the Control Chart Builder or Analyze -> Quality and Process -> Control Chart path.