Downloaded 15 times


![JEM Vol. 211, No. 8
Ar t icle
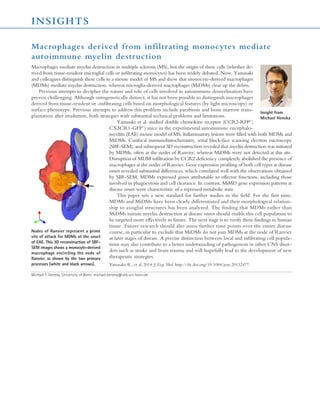
Histological and immunohistochemical analysis. Spinal columns were
removed after mice were perfused with 4% paraformaldehyde (PFA). For im-munofluorescence
assay, free floating sections of the lumbar spinal cord were
prepared as previously described (Huang et al., 2006). For immunofluores-cence
assay, sections were blocked with 10% normal serum for 2 h and stained
with primary antibodies at 4°C for 24–48 h. After washing with PBS-T (PBS
with 0.1% Triton X-100; Sigma-Aldrich) three times, the sections were incu-bated
with secondary antibodies at room temperature for 2 h and mounted
in ProLong Gold antifade reagent (Invitrogen). Antibodies used include rat
anti-CD11b (BD), mouse anti-GFP (Abcam), rabbit anti-RFP (Abcam), Alexa
Fluor 488 goat anti–mouse IgG (Invitrogen), Alexa Fluor 594 goat anti–rabbit
IgG (Invitrogen), and Alexa Fluor 647 goat anti–rat IgG (Invitrogen). Nuclei
were labeled by DAPI. Images were collected by confocal laser-scanning mi-croscope
1547
(SP5; Leica).
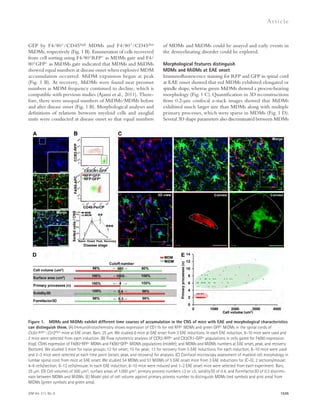
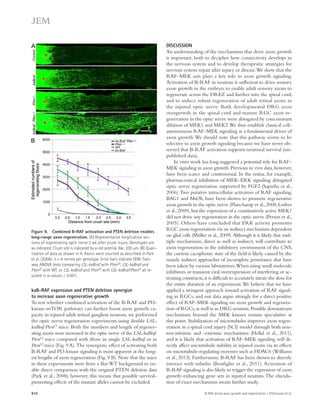
Quantitative 3D morphology. Quantitative 3D morphology of MDMs
and MiDMs was analyzed in confocal images from spinal cord of mice at
EAE onset. Free floating sections of the lumbar spinal cord were stained with
RFP for MDMs, GFP for MiDMs, and DAPI for nuclei. Stack images were
taken at 0.2-μm step size along the z-direction with a 63× objective (numer-ical
aperture [NA] = 1.4) and zoom factor 2. A square (1,024 × 1,024 pixels)
corresponding to 123 × 123 μm2 was used for the analysis. Cells were 3D re-constructed
by ImageJ software and all analyses were performed using ImageJ
with 3D Convex Hull plugin. The parameters analyzed include voxel (volu-metric
pixel), convex voxel, volume, convex volume, surface, and convex sur-face
area. Other calculated parameters were: Solidity3D = volume/convex
volume; Convexity3D = convex surface area/surface area; Formfactor3D =
36 3 π × volume2 surface area3. The number of primary processes was esti-mated
visually. We included 5 mice, 54 MDMs; 51 MiDMs in this assay with
2 sections/mouse, 4–6 cells/section and 8–12 cells/mouse. Those mice came
from three EAE inductions.
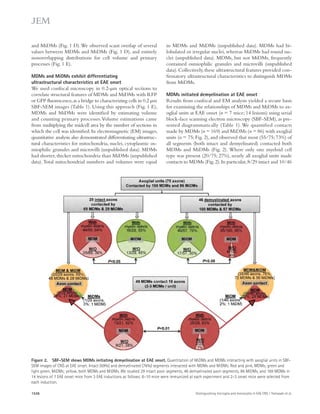
SBF-SEM. Spinal cords were removed after mice were perfusion-fixed
using 4% PFA with 1% glutaraldehyde. Lumbar spinal cord sections were
made on a vibratome (Leica). Sections were stained with 0.4% OsO4, uranyl
acetate and lead aspartate, then embedded in epon resin (Electronic Micros-copy
Sciences). SBF-SEM images were acquired using a Sigma VP SEM
(Carl Zeiss) with 3View (Gatan). Serial image stacks of images at 100-nm
steps were obtained by sectioning 48 × 48 × 20 μm3 tissue blocks (length ×
width × depth) at a resolution of 8192 × 8192 pixels. Image stacks were pro-cessed
for 3D reconstruction by TrakEM2 in FIJI software (National Institutes
of Health). Alternating sections from the same stacked images were chosen to
make stacks for 3D reconstructions which matched the 0.2-μm step size used
for acquiring confocal stacked images. In SBF-SEM images, we discriminated
MDMs and MiDMs using the volume/primary processes model (Fig. 1 E)
generated from analyzing confocal images. Quantifications of myeloid-cell
spatial relationships to axoglial units, including myelin incorporation, were
done in SBF-SEM images.
Quantification of nuclei and mitochondria. Characterizations of nu-clear
shapes were conducted in SBF-SEM images. Nuclei were categorized
as follows: round, round shape and smooth surface with ratio of length/
width ≤1.5; elongated, elongated or oval shape with length/width 1.5, and
may have small indentations; Bilobulated: two connected lobes with single
intervening large indentation; Irregular: complicated shape with corrugated
surface, and may have multiple and variable sizable indentations. Blinded ob-servers
(n = 3) scoring the nuclear morphology from SBF-SEM images in-cluded
a research student, a research fellow and a neuroscientist. Observers
were trained on the same nuclear examples in each category and practiced
using 20 nuclei comprising all shapes before scoring the nuclei. Kappa test
showed good pairwise agreement rates among observers (0.8) and the data
from the neuroscientist are used. Quantifications were done in 3 individual
mice from 3 EAE inductions including 28–35 cells from two separate lesions
from each mouse in the assay.
by demonstrating and characterizing differential responses of
infiltrating monocytes and resident microglia in a relevant dis-ease
model at a prespecified time point, at which point patho-genic
events are taking place. Therefore, we focused our analysis
on the day of EAE onset rather than subsequent events to
challenge our overall hypothesis that infiltrating monocytes
versus resident microglia respond very differently to acute in-flammatory
stimuli.
Activated myeloid cells are the proximate effectors of a
bewildering array of acute and chronic disorders (Wynn et al.,
2013). The technical and conceptual approach taken in this
study may be applicable to other tissues and disease processes.
In many pathological conditions, tissues harbor a mixed pop-ulation
of activated resident and recruited monocytes. The
therapeutic strategy will differ conclusively based on the spe-cific
effector properties of each cell type and the stage of dis-ease.
In particular, if monocytes are pathogenic, then their
trafficking should be blocked using a peripherally active agent.
The optimal application of agents that regulate leukocyte mi-gration
and intracellular signaling will be promoted by de-tailed
examination of each individual myeloid population.
MATERIALS AND METHODS
Mice. C57BL/6 mice were obtained from the National Cancer Institute.
Ccr2rfp/+::Cx3cr1gfp/+ mice were generated by crossbreeding Ccr2rfp/rfp::C57BL/6
mice (Saederup et al., 2010) with Cx3cr1gfp/gfp::C57BL/6 mice ( Jung et al.,
2000). Ccr2rfp/rfp::Cx3cr1gfp/gfp mice were generated by breeding Ccr2rfp/+
::Cx3cr1gfp/+ mice. Ccr2rfp/rfp::Cx3cr1gfp/+ mice were generated by crossbreed-ing
Ccr2rfp/rfp::C57BL/6 mice with Ccr2rfp/rfp::Cx3cr1gfp/gfp mice. Animal ex-periments
were performed according to the protocols approved by the
Institutional Animal Care and Use Committee at the Cleveland Clinic fol-lowing
the National Institutes of Health guidelines for animal care.
EAE induction and clinical evaluation. EAE was induced in Ccr2rfp/+
::Cx3cr1gfp/+ mice and Ccr2rfp/rfp::Cx3cr1gfp/+ mice of 24–28 wk of age using
myelin-oligodendrocyte-glycoprotein peptide 35–55 (MOG) as previously
described (Huang et al., 2006). All mice were weighed and graded daily for
clinical stages as previously reported (Saederup et al., 2010). We defined clinical
stage of EAE as follows: pre-onset was the day sudden weight loss for 8–10%
occurred; onset was the day EAE signs appeared; peak was the second day score
didn’t increase after sustained daily worsening; and recovery was the second
day score didn’t decrease after a period of sustained daily improvement.
To address our research questions, we integrated flow cytometry, immunohistochemistry
with quantitative morphometry, cell sorting for expression
profiling, and serial block-face scanning electronic microscopy. In all, we per-formed
12 EAE immunizations in Ccr2rfp/+::Cx3cr1gfp/+ mice and 19 immu-nizations
in Ccr2rfp/rfp::Cx3cr1gfp/+ mice for this project, with 8–10 mice in
each immunization. We selected EAE mice at onset, peak or recovery de-pending
on the specific studies underway at that time, with the majority of
mice coming from the onset stage of EAE. Each experiment incorporated
samples from at least three separate immunizations. Details of mouse numbers
and how they were selected for each experiment were included in the figure
legends as requested.
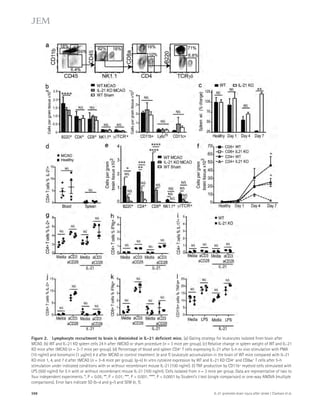
Cell isolation and flow cytometry. Brains and spinal cords were removed
and homogenized. Mononuclear cells were separated with a 30%/70% Per-coll
(GE Healthcare) gradient as previously reported (Pino and Cardona,
2011). Single-cell suspensions from CNS were stained with anti–F4/80-APC
(BM8; eBioscience) and anti–CD45-PerCP (30-F11; BioLegend). Cells were
either analyzed on a LSR-II (BD) or sorted on a FACSAria II (BD) running
Diva6. Data were analyzed with FlowJo software (Tree Star).](https://image.slidesharecdn.com/jemneurosciencespecialissue-141202045722-conversion-gate02/85/Jem-neuroscience-special_issue-29-320.jpg)
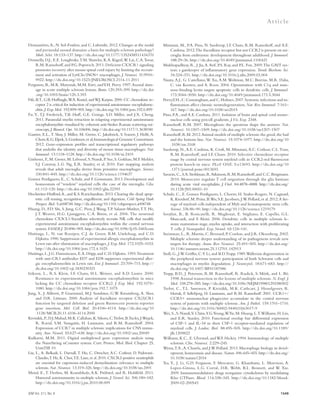
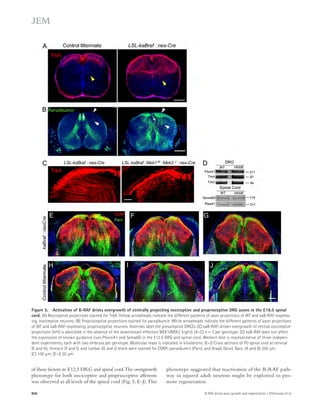
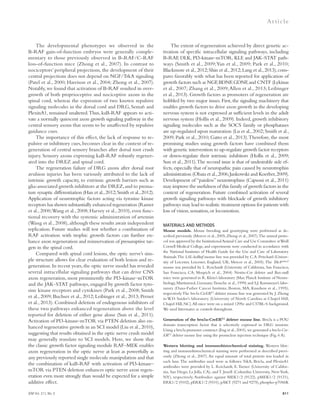
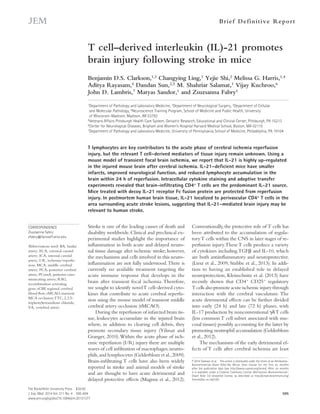
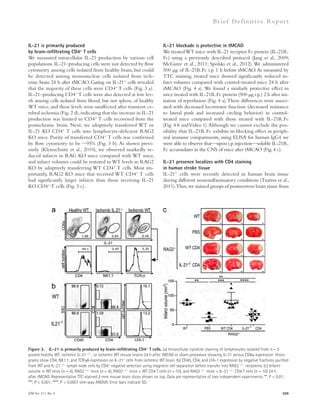
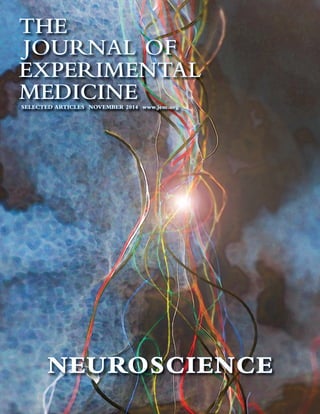
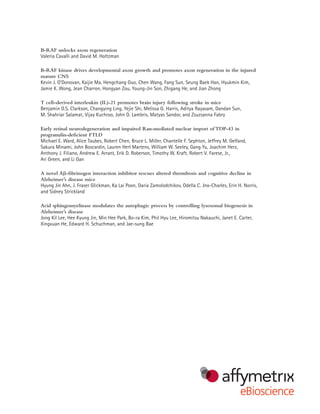
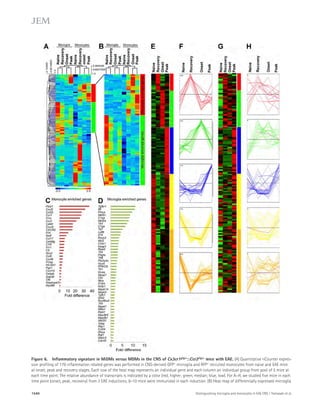
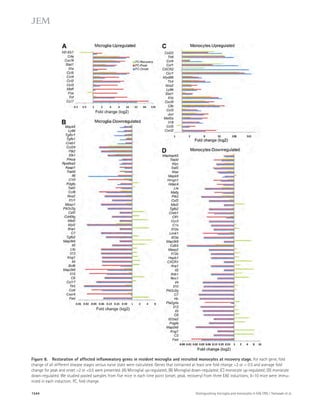
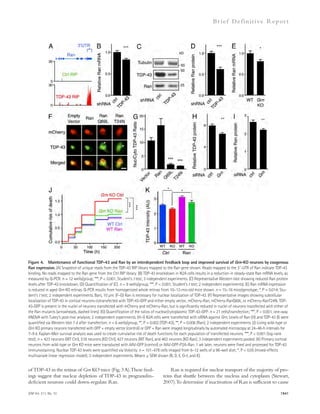
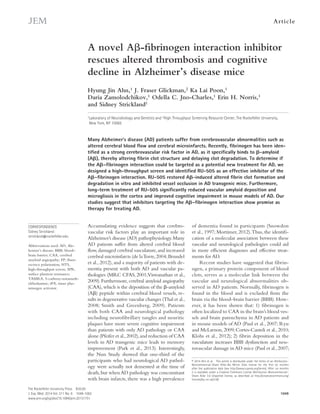
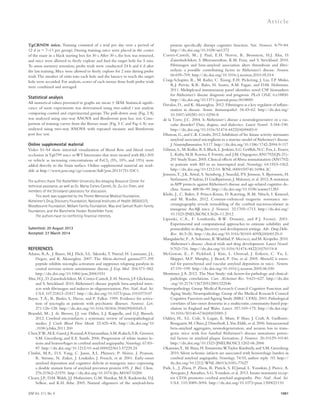
![Figure 4. Blockade of IL-21 signaling before or after tMCAO reduces infarct size in WT mice. (a) Infarct volumes 24 h after tMCAO in WT mice
treated with 500 μg recombinant mIL-21R.Fc or PBS 1 h before (pretreatment) or 2 h after (posttreatment) surgery. Representative TTC-stained brain
slices shown on left (n = 3–4 mice per group). (b) Still image from Video 1 depicting behavioral differences between WT mice posttreated with IL-21R.Fc
or PBS. (c) IL-21R.Fc protein levels in the indicated organs 20–24 h after tMCAO in WT mice injected with 500 μg IL-21R.Fc 2 h after start of reperfusion
(n = 2–4 mice per group). N.D., not detected. Data are representative of two independent experiments. **, P 0.01; ***, P 0.001, by Student’s t test. Error
bars indicate SEM. Representative images of postmortem paraffin-embedded human acute stroke lesions stained with control sera (d), or primary anti-bodies
against CD4 (e and g [ii-iii]), IL-21 (f and g [iii]), or eosin (g [i]) visualized with Fast Red (d, e, and g) and/or DAB (d, f, and g [iii]) and counterstained
with hematoxylin. High magnification images are shown on right. Arrows indicate positive staining. Bars, 50 μm.
600 IL-21 promotes brain injury after stroke | Clarkson et al.](https://image.slidesharecdn.com/jemneurosciencespecialissue-141202045722-conversion-gate02/85/Jem-neuroscience-special_issue-52-320.jpg)
![Br ief Def ini t ive Repor t
Statistical analyses and quality standards. All surgeries were performed
in a blinded manner by a third party and measurements masked where possi-ble.
Infarct volume measurements from TTC stained sections were averaged
from two to three independent blinded observers. Based on power calcula-tions,
n = 3–10 sex- and age-matched mice were used for each experiment
and group assignment was randomized. Among animals receiving MCAO
procedure, 86.5% of WT mice, 93.5% of IL-21KO mice, and 100% of
RAG2KO mice were included in analysis. Mice were excluded due to prema-ture
death (13.5% of WT mice, 3.2% of IL-21 KO mice) or vessel variation
(3.2% of IL-21KO mice). Results are given as means ±1 SD. Multiple com-parisons
were made using one-way ANOVA. Where appropriate, two-tailed
Student’s t test analysis was used for comparing measures made between two
groups. For comparison of RT-PCR data, nonparametric Mann-Whitney
rank sum analysis was used. P-values 0.05 were considered significant.
Online supplemental material. Video 1 shows groups of WT C57BL6
mice treated with 500 μg IL-21R.Fc or PBS control via i.p. injection. On-line
supplemental material is available at http://www.jem.org/cgi/content/
full/jem.20131377/DC1.
We thank Satoshi Kinoshita for expert histopathology services, Guoqing Song for
assisting in the surgical procedures, Dr. Wenda Gao for providing reagents and
protocols for the purification of IL-21R.Fc protein, and members of our laboratory
for helpful discussions and constructive criticisms of this work. We also thank Khen
Macvilay and Sinarack Macvilay for their expertise provided for cytofluorimetry and
immunohistochemistry studies and Samuel (Joe) Ollar for assisting in the OGD procedure.
This work was supported by awards from the American Heart Association (pre-doctoral
fellowship #12PRE12060020 to B.D.S. Clarkson) and the National Institutes
of Health (NS037570 and NS076946 to ZF, AI048087 to M.S. Salamat, and
AI068730 to J.D. Lambris).
The authors have no competing financial interests.
Submitted: 1 July 2013
Accepted: 24 February 2014
REFERENCES
Baan, C.C., A.H. Balk, I.E. Dijke, S.S. Korevaar, A.M. Peeters, R.P. de Kuiper, M.
Klepper, P.E. Zondervan, L.A. Maat, and W. Weimar. 2007. Interleukin-21:
an interleukin-2 dependent player in rejection processes. Transplantation.
83:1485–1492. http://dx.doi.org/10.1097/01.tp.0000264998.23349.54
Barone, F.C., D.J. Knudsen, A.H. Nelson, G.Z. Feuerstein, and R.N. Willette.
1993. Mouse strain differences in susceptibility to cerebral ischemia are
related to cerebral vascular anatomy. J. Cereb. Blood Flow Metab. 13:683–
692. http://dx.doi.org/10.1038/jcbfm.1993.87
Barone, F.C., B. Arvin, R.F. White, A. Miller, C.L. Webb, R.N. Willette, P.G.
Lysko, and G.Z. Feuerstein. 1997. Tumor necrosis factor-alpha. A mediator
of focal ischemic brain injury. Stroke. 28:1233–1244. http://dx.doi.org/
10.1161/01.STR.28.6.1233
Battaglia, A., A. Buzzonetti, C. Baranello, M. Fanelli, M. Fossati, V. Catzola,
G. Scambia, and A. Fattorossi. 2013. Interleukin-21 (IL-21) synergizes
with IL-2 to enhance T-cell receptor-induced human T-cell proliferation
and counteracts IL-2/transforming growth factor--induced regulatory
T-cell development. Immunology. 139:109–120. http://dx.doi.org/10.1111/
imm.12061
Gelderblom, M., F. Leypoldt, K. Steinbach, D. Behrens, C.U. Choe, D.A. Siler,
T.V. Arumugam, E. Orthey, C. Gerloff, E. Tolosa, and T. Magnus. 2009.
Temporal and spatial dynamics of cerebral immune cell accumulation in
stroke. Stroke. 40:1849–1857. http://dx.doi.org/10.1161/STROKEAHA
.108.534503
Gelderblom, M., A. Weymar, C. Bernreuther, J. Velden, P. Arunachalam, K.
Steinbach, E. Orthey, T.V. Arumugam, F. Leypoldt, O. Simova, et al.
2012. Neutralization of the IL-17 axis diminishes neutrophil invasion
and protects from ischemic stroke. Blood. 120:3793–3802. http://dx.doi
.org/10.1182/blood-2012-02-412726
Hecker, A., A. Kaufmann, M. Hecker, W. Padberg, and V. Grau. 2009. Expression
of interleukin-21, interleukin-21 receptor alpha and related type I
cytokines by intravascular graft leukocytes during acute renal allograft
forepaw(s); 2, hangs on with forepaws and moves laterally on string; 3, hangs
onto string with forepaws and hindpaw(s); 4, hangs onto string with forepaws,
hindpaw(s) and tail; 5, escape to supports. Mice were allowed to rest between
trials. Scores for each mouse were determined by averaging 5–10 trials (each
lasting 15 s). Global neurological deficit was determined by a modified Bed-erson
scoring system: 0, no deficit; 1, forelimb flexion; 2, unidirectional circling
after being lifted by tail; 3, spontaneous unidirectional circling; 4, longitudinal
rolling upon being lifted by tail; 5, spontaneous longitudinal rolling.
Generation of IL-21 receptor Fc fusion protein. Chinese hamster ovary
cell line (Korn et al., 2007) expressing the extracellular domain (aa 20–236)
of mouse IL-21R fused to the fragment crystallizable (Fc) portion of human
IgG4 (IL-21R.Fc) were maintained in UltraCHO (BioWhittaker). IL-21R.
Ig was purified from the culture supernatant by passage through a protein
G–Sepharose column and concentrated by ultrafiltration. Concentration was
determined spectrophotometrically. Purity and molecular weight were con-firmed
by sodium dodecyl-sulfate PAGE and human-IgG4 ELISA (eBiosci-ence)
following the manufacturer’s instructions. The IL-21R.Fc reagent was
tested in vitro for its ability to suppress IL-21–induced T cell proliferation.
Immunohistochemistry. Paraffin-embedded postmortem brain tissue sec-tions
from individuals with acute and chronic stroke lesions were obtained
from the Neuropathology Laboratory of the University of Wisconsin De-partment
of Pathology. After rehydration and deparaffinization, sections un-derwent
heat-induced antigen retrieval in 10 mM sodium citrate, pH 6.0, for
surface antigens or Tris-EDTA (10 mM/1 mM) with 0.05% Tween-20 for
intracellular antigens. Sections were blocked for 30 min with secondary
serum (10% in Tris-buffered saline) and then stained with primary antibodies,
0.5% chicken anti–IL-21 (Lifespan Biosciences) or prediluted mouse anti-
CD4 ([1F6]; ab17131; Abcam) for 1–2 h at 37°C or overnight at 4°C. Nor-mal
primary sera (5–10%) were used for negative control. After several washes,
secondary antibodies (biotin-labeled goat anti–chicken or biotin-labeled
goat anti–mouse; Vector Laboratories) were applied to sections and incubated
for 2 h at room temperature. Staining was developed using the VECTA-STAIN
ABC-HRP kit (Vector Laboratories) with diaminobenzidine sub-strate
(BD) or streptavidin-alkaline phosphatase with Fast Red substrate
(Laboratory Vision), following the manufacturer’s instructions. Slides were
lightly counterstained with hematoxylin, rinsed with running tap water, and
mounted. For frozen mouse sections WT and IL-21 KO mice underwent 1-h
tMCAO and 1–7-d reperfusion. Brains were perfused with PBS and 3% for-malin,
embedded in OCT, and cut into 8-μm frozen sections for immunohistochemistry.
Frozen sections were thawed for 10 min at room temperature
and blocked with 5% goat serum solution in PBS for 15 min. Sections were
stained with rabbit polyclonal antibodies for ATG6 for 1 h at room tempera-ture,
followed by phycoerythrin-labeled goat anti–rabbit IgG (Santa Cruz
Biotechnology, Inc.). Images were acquired on a BX40 microscope equipped
with a Q-Color 3 camera using Q-Capture software (Olympus). Digital
images were processed and analyzed using Photoshop CS4 software (Adobe).
Color balance, brightness, and contrast settings were manipulated to generate
final images. All changes were applied equally to entire image.
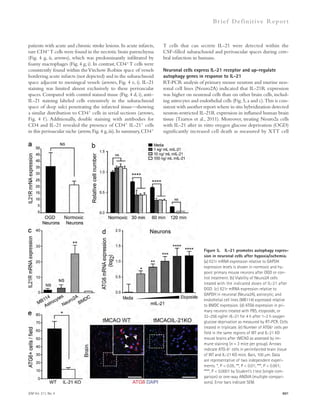
Neuronal cell oxygen glucose deprivation. Primary neuronal cultures
derived from embryonic day 14–18 mouse cortices were grown to 80% con-fluency
in neural basal media supplemented with B27 (2%) and penicillin/
streptomycin (1%), as previously described (Kintner et al., 2010). Astrocytic
and microglial contamination was excluded based on the absence of GFAP+
and CD11b+ cells when stained by immunocytochemistry. For OGD, media
was replaced with neural basal media with or without glucose and placed in
a hypoxic chamber or under normoxic conditions for 2 h at 37°C. Afterward,
cells were lysed and mRNA isolated using RNeasy mini kit (QIAGEN). For
XTT viability assay, Neuro2A underwent OGD and were treated with dose
curve of IL-21 immediately after return to normoxic media and incubated
for 4 h at 37°C. XTT labeling mixture (50 μl per well; Roche) was added ac-cording
to manufacturer’s instructions, and at18 h fluorescence was read on
a GENious Microplate reader (Tecan). Cell number was calculated using a
standard curve of known untreated cells kept under normoxic conditions.
JEM Vol. 211, No. 4 603](https://image.slidesharecdn.com/jemneurosciencespecialissue-141202045722-conversion-gate02/85/Jem-neuroscience-special_issue-55-320.jpg)
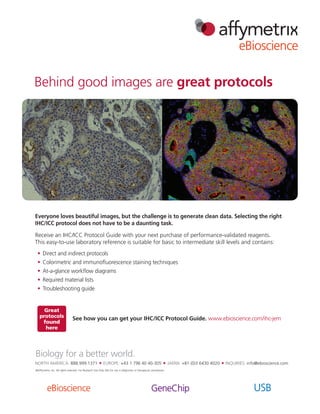
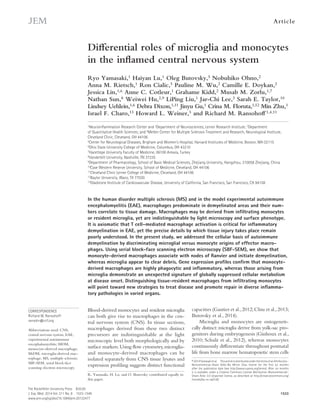
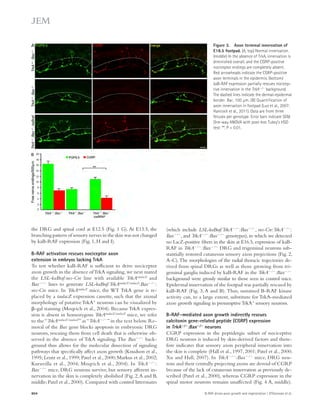
![TDP-43 levels correlated with those of nuclear Ran (Fig. 3 C).
Moreover, in the inferior frontal gyrus of three patients with
FTLD-TDP due to GRN mutations, we found a significant
correlation between nuclear depletion of TDP-43 and Ran
(Fig. 3, D and E).
To understand the mechanisms underlying the intimate
correlation between nuclear TDP-43 and Ran, we next as-sessed
whether Ran mRNA is altered in the brains of FTLD-TDP-
43 patients, in which TDP-43 is mislocalized. By
mining an existing mRNA-expression database comparing
healthy control versus GRN-mutation-carrying FTD sub-jects
(Chen-Plotkin et al., 2008), we found that cortical Ran
expression was reduced by 60% in human subjects carrying a
GRN mutation (P = 0.04). As TDP-43 regulates the expression
of thousands of genes, in many cases by binding directly to
mRNAs and altering their stability (Polymenidou et al., 2011),
we explored the possibility that Ran mRNA is a substrate of
TDP-43. Indeed, analyses of a published unbiased screen of the
TDP-43–RNA interactions (Sephton et al., 2011) revealed
that TDP-43 binds to the 3 UTR of Ran mRNA (Fig. 4 A).
Moreover, inhibiting TDP-43 expression by shRNA-mediated
knockdown significantly reduced levels of Ran mRNA
(Fig. 4 B) and protein (Fig. 4, C–D) in N2A cells. Ran mRNA
levels were also reduced in retinas of aged Grn KO mouse
(Fig. 4 E), consistent with our observations of nuclear depletion
were strikingly reduced in Grn-KO retinal GCL neurons,
whereas levels of cytoplasmic TDP-43 were unchanged (Fig. 2,
B and C). Depletion of nuclear TDP-43 also occurred in
12-mo-old Grn-KO mice, before significant GCL neuron
loss (Fig. 2 D). Interestingly, neither nuclear nor cytoplasmic
TDP-43 inclusions were found in the 100 Grn-KO GCL
neurons we examined (Fig. 2 B). Thus, in progranulin-deficient
FTLD-TDP, nuclear depletion of TDP-43 and neurodegeneration
can occur independent of cytoplasmic TDP-43
accumulation/aggregation. These results are consistent with
observations that TDP-43, especially nuclear TDP-43, is re-quired
for neuron survival (Wegorzewska and Baloh, 2011;
Igaz et al., 2011; Arnold et al., 2013).
TDP-43 regulates Ran mRNA levels
and requires Ran for nuclear localization
We then explored how nuclear clearing of TDP-43 occurs in
FTLD. The small GTPase Ran is a master regulator of nuclear
transport (Melchior et al., 1995), and Ran accessory proteins
are necessary for nuclear TDP-43 localization (Nishimura
et al., 2010). We hypothesized that Ran expression might be
altered in our retinal FTLD model and contribute to nuclear
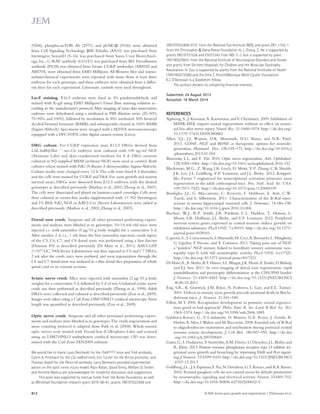
TDP-43 depletion. Indeed, nuclear Ran was significantly de-pleted
in Grn-KO GCL neurons (Fig. 3, A and B), and nuclear
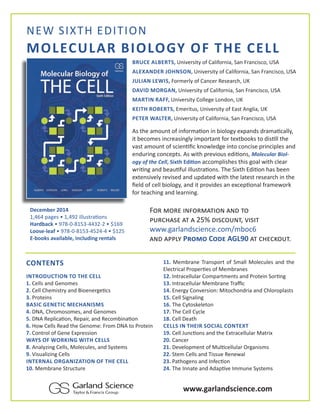
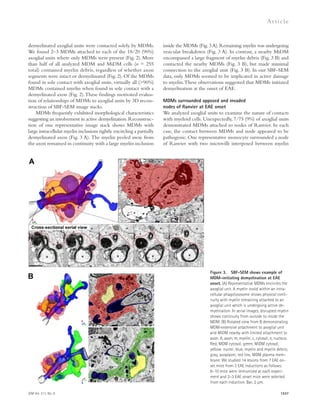
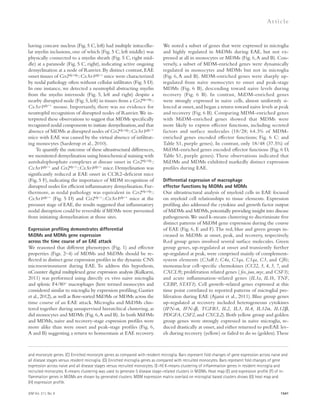
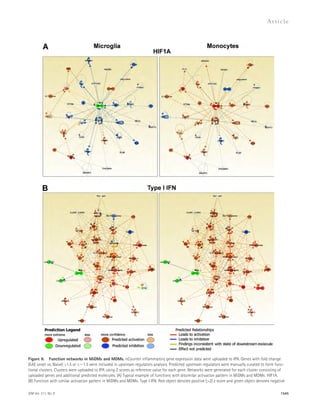
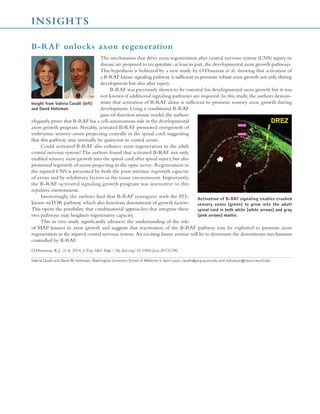
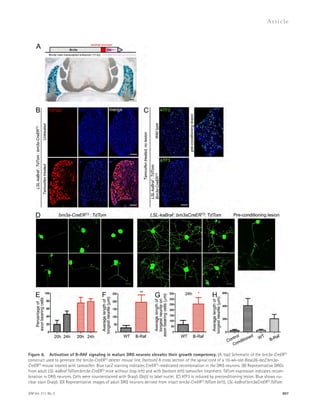
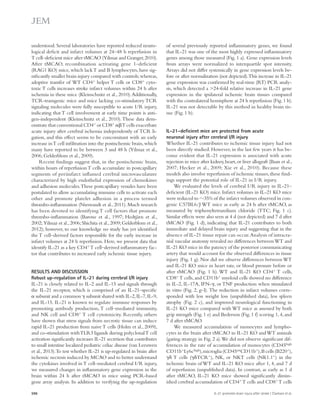
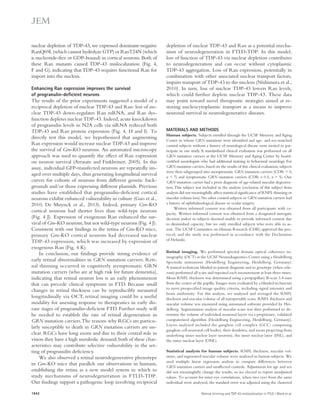
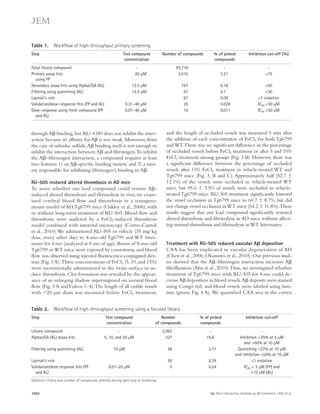
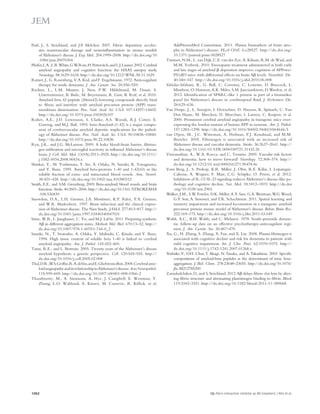
Figure 3. Nuclear clearing of TDP-43
and Ran are pathologically associated in
FTLD-TDP. (A) 18-mo-old GCL neurons from
WT and Grn-KO retinas were co-stained for
TDP-43 and Ran. Nuclei were labeled with
DAPI. (B) Nuclear Ran levels in 18-mo-old GCL
neurons. n = 165–278 cells from 6 mice/gen-otype;
*, P = 0.019, linear regression model;
2 independent experiments. Scatter plot of
individual cell intensities with medians shown.
(C) Nuclear Ran and TDP-43 intensities are
correlated in Grn-KO GCL neurons. Each dot
represents a single cell. n = 165 cells from 6
Grn-KO mice; r = 0.8963; P 0.001, Spear-man’s
rho; 2 independent experiments.
(D) Immunofluorescence co-staining of GRN
mutant human cortex shows depletion of Ran
and TDP-43 in the same neuron (noted with
an arrow; compare to neurons with high lev-els
of TDP-43 and Ran [arrowhead]). (E) TDP-43
and Ran levels correlate in cortical neurons
from human GRN-mutation carriers. Shown
are the correlation analyses of nuclear Ran
and TDP-43 intensities of individual neurons
from post-mortem brain. n = 111–141 cells
from each of 3 subjects;, r = 0.56; P 0.001.
The serum progranulin levels were 19.3–21.2
ng/ml for R493X carrier (control patients: 41.3 ±
15.5 ng/ml). Spearman’s rho. Bars: 2 μm (A),
10 μm (D).
1940 Retinal thinning and TDP-43 mislocalization in FTLD | Ward et al.](https://image.slidesharecdn.com/jemneurosciencespecialissue-141202045722-conversion-gate02/85/Jem-neuroscience-special_issue-60-320.jpg)

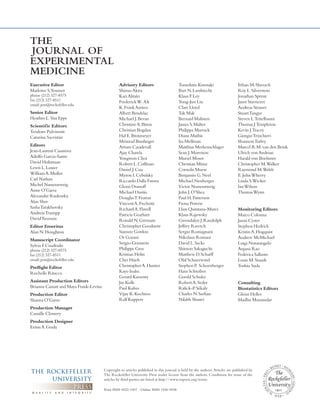
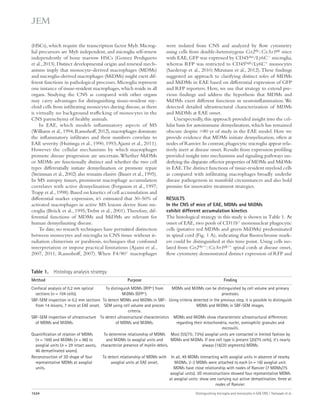
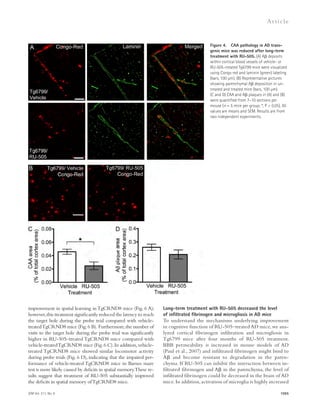
![the background AlphaLISA signal. Therefore, the actual in-hibitory
efficacy of these compounds could be higher than
the results from dose–response experiments of AlphaLISA.
In addition, avidity effects may cause higher IC50 values in
AlphaLISA than FP. There could be multiple A–fibrinogen
interactions between acceptor bead and donor bead in Alph-aLISA
(Fig. 1 B), and therefore blocking one interaction may
not reduce the signal.
Because both AlphaLISA and the FP assay are based on
optical measurements, colored compounds could significantly
modify the measurement through inner filter effects. Thus, we
confirmed the potency of our candidates using a pull-down
assay. All five compounds showed inhibitory effects, whereas
RU-505 had significant inhibitory efficacy (Fig. 2 A). These
combined experiments show that the compounds identified
are inhibitors of the A–fibrinogen interaction.
Soluble oligomeric A has been hypothesized to be the
primary toxic species in AD (Cleary et al., 2005). Therefore, we
tested which form of A, monomer or oligomer (prepared as
in Stine et al. [2011]), interacts with fibrinogen and whether
RU-505 can selectively inhibit the interaction of one or the
other. Using the AlphaLISA assay, we found that both A42
monomer and oligomer interact with fibrinogen, but the affin-ity
of oligomer for fibrinogen binding is 4 times higher than
that of the monomer (Fig. 2 B). RU-505 inhibits the interaction
of both monomer and oligomer with fibrinogen, but
has higher inhibitory efficacy against the monomer–fibrinogen
interaction than the oligomer (Fig. 2 C).
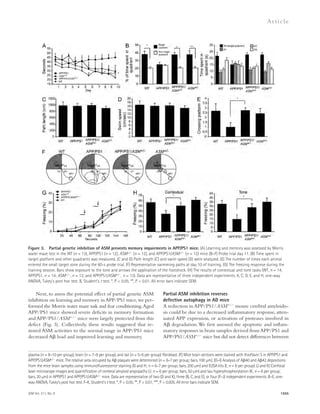
Validation of hit compounds using in vitro clotting assay
Because the interaction between A42 and fibrinogen in-duces
a structurally abnormal fibrin clot and delays fibrin clot
degradation during fibrinolysis (Ahn et al., 2010; Cortes-
Canteli et al., 2010; Zamolodchikov and Strickland, 2012),
one of the main objectives of our study was to identify com-pounds
that restore A-induced delayed fibrinolysis. When
fibrinogen associates into a fibrin meshwork after cleavage by
thrombin, the fine structure of this fibrin clot scatters light
and the solution increases in turbidity. Thus, the kinetics of
turbidity can be used as a read-out to analyze fibrin network
formation and degradation. We tested whether our hits re-stored
A-induced altered thrombosis and fibrinolysis in vitro.
Each hit compound (20 μM) or vehicle (0.4% DMSO) was
incubated for 10 min with purified human fibrinogen and
plasminogen in the presence or absence of A42. Fibrin clot
formation and degradation were analyzed by measuring tur-bidity
immediately after adding thrombin and tissue plasmin-ogen
activator (tPA) to the mixture. In the presence of A42,
the maximum turbidity of the fibrin clot was decreased be-cause
A altered fibrin clot structure and the dissolution of
the fibrin clot was delayed (Fig. 2 D; red). RU-505 restored
the A-induced decrease in turbidity during fibrin clot for-mation
(Fig. 2 D; green) and significantly reduced the delay in
fibrin degradation in the presence of A (Fig. 2 E). We also
tested other hit compounds, including RU-965, using the
turbidity assay, but none had significant effects (Fig. 2 F and
Cortes-Canteli et al., 2010); 3) A binds specifically to fibrino-gen;
and 4) fibrin clots formed in the presence of A have an
abnormal structure, making them resistant to degradation by
fibrinolytic enzymes (Ahn et al., 2010; Cortes-Canteli et al.,
2010). Overall, these results indicate that in the presence of A,
any fibrin clots formed might be more persistent and may ex-acerbate
neurovascular damage and cognitive impairment.
Therefore, molecules that block this interaction without affect-ing
clotting in general could restore altered thrombosis and fi-brinolysis
and protect against vascular damage in AD patients,
and could be used as therapeutic agents.
RESULTS
Hit identification and optimization
using high-throughput screening
To investigate this idea, we designed a high-throughput screen
(HTS) to identify small molecules that inhibit the interaction
between A and fibrinogen. Low molecular weight compounds
were screened using fluorescence polarization (FP) and Alpha-
LISA assays in a complementary fashion to cross check the
activity of the hit compounds and to ensure the removal of
false-positive artifacts. Primarily, 93,000 compounds were
screened using FP, which measured the changes in the anisotro-phy
induced by binding of a 5-carboxy-tetramethylrhodamine
(TAMRA)–labeled A peptide to fibrinogen (Fig. 1 A). Then,
hits from FP were screened using AlphaLISA to independently
confirm the activity of the inhibitors identified in the FP assay
(Fig. 1 B). After both steps, we selected only drug-like com-pounds
using Lipinski’s Rule of Five, which allowed us to de-termine
which chemical compounds have pharmacological
properties that would make them likely orally active drugs in
humans (Lipinski et al., 2001). We also filtered out artifactual
compounds using a quenching assay, which identifies insoluble
compounds, singlet oxygen quenchers, and biotin mimetics in-terfering
with the AlphaLISA signal. We identified several candi-date
compounds with half-maximal inhibitions (IC50) between
10 and 50 μM from the dose-response assays using both FP and
AlphaLISA assays (Table 1).
To expand and improve our candidate compounds, we
purchased a focused analogues compound library, based on
combinatorial variations of scaffolds from the primary hit
compounds. These analogues were screened at three different
concentrations (5, 10, and 20 μM) using AlphaLISA. Next, we
selected only drug-like compounds using Lipinski’s Rule of
Five and also included the quenching assay. If inhibition by
quenching was 30%, the compounds were removed from fur-ther
analyses because these compounds were more likely to be
false positives. Finally, we screened the active nonquenching
compounds in concentration-response experiments with freshly
dissolved powders using both FP and AlphaLISA assays. We
identified five drug-like compounds with IC50 3 μM by FP
and IC50 10 μM by AlphaLISA (Fig. 1 C and Table 2).
In some cases, the maximum inhibition of several com-pounds
in AlphaLISA was lower than that of FP. There are
several possible reasons for these differences. First, some hit
compounds showed negative quenching values, which increases
1050 A-fibrin interaction inhibitor as AD treatment | Ahn et al.](https://image.slidesharecdn.com/jemneurosciencespecialissue-141202045722-conversion-gate02/85/Jem-neuroscience-special_issue-68-320.jpg)
![JEM Vol. 211, No. 6
Ar t icle
to the sensor chip surface, and RU-505 was injected for 2 min
at 30 μl/min. Sulindac sulfide was used as positive control, and
sulindac was used as negative control (Richter et al., 2010). To
analyze the correlation between HTS and SPR, we used an
analogue of RU-505, RU-4180 (Fig. 2 H), which did not in-hibit
the A–fibrinogen interaction in AlphaLISA assay. Al-though
RU-4180 weakly binds to A42 (green; Fig. 2 G),
RU-505 showed strong binding to A42 (blue; Fig. 2 G). Fur-thermore,
because it is known that sulindac sulfide binds A,
we tested whether it could inhibit the A–fibrinogen interac-tion
by AlphaLISA and found that it had no effect. These results
suggest that RU-505 inhibits the A–fibrinogen interaction
1051
not depicted). Moreover, RU-505 did not have any effect
on fibrin clot formation and degradation in the absence of
A (Fig. 2 D, purple). This result suggests that RU-505 could
effectively restore A-induced altered fibrin clot structure
and delayed degradation without affecting normal clot for-mation
and fibrinolysis.
The interaction between A and RU-505
To elucidate how RU-505 inhibits the A–fibrinogen inter-action,
surface plasmon resonance (SPR) was used to analyze
the binding characteristics of RU-505 (Fig. 2 G). Hexaflu-oroisopropanol-
treated monomerized A42 was immobilized
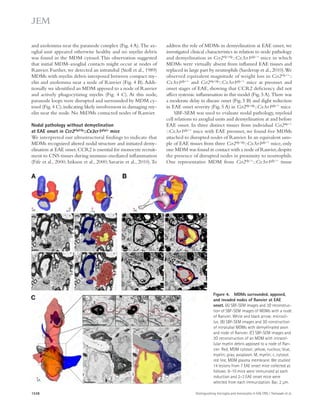
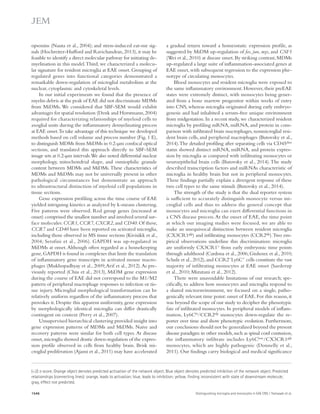
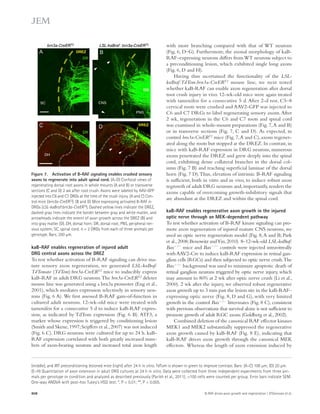
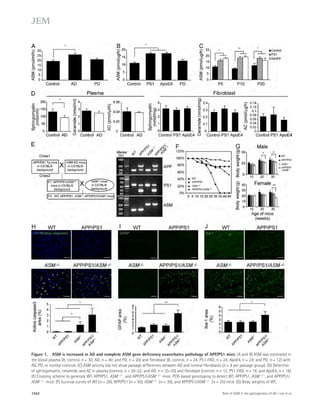
Figure 1. The chemical structure and
dose–response curve of A–fibrinogen
interaction inhibitors. (A) TAMRA–labeled
A peptide was bound to fibrinogen and the
test compound, and the anisotropy of
TAMRA–A–fibrinogen binding was deter-mined
by FP. (B) Biotin-labeled A42, which
binds a streptavidin donor, was incubated
with fibrinogen, which binds a protein A ac-ceptor
bead coated with antifibrinogen anti-body.
A42 and fibrinogen interactions bring
the beads in close proximity, resulting in the
excitation of the donor beads and release of
singlet oxygen molecules that triggers light
emission in acceptor beads (AlphaLISA [AL]).
(C) The half-maximal inhibitory concentration
(IC50) values of the indicated compounds were
determined by dose–response FP and AL ex-periments
and are indicated inside the panel
(red, FP; blue, AL). A quenching test was also
performed to calculate how much each hit
compound interfered with the AL signal at
10 μM concentration. Quenching values are
indicated below the dose–response curve.
n = 3–4 repeats per assay and all error bars
indicate SEM. Data are representative of at
least three independent experiments.](https://image.slidesharecdn.com/jemneurosciencespecialissue-141202045722-conversion-gate02/85/Jem-neuroscience-special_issue-69-320.jpg)
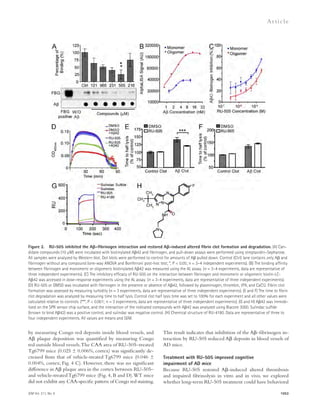
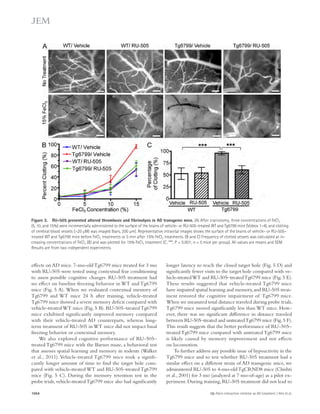
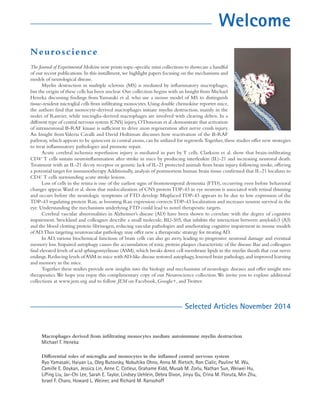
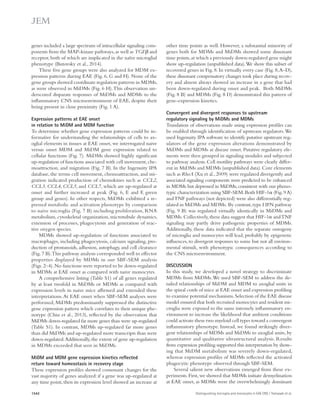
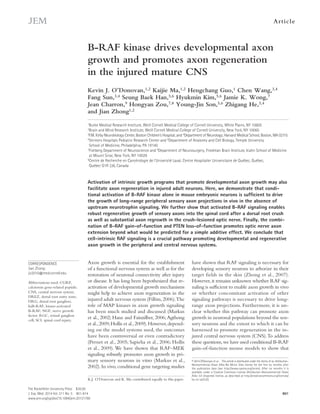
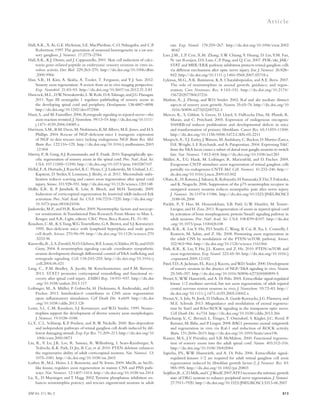
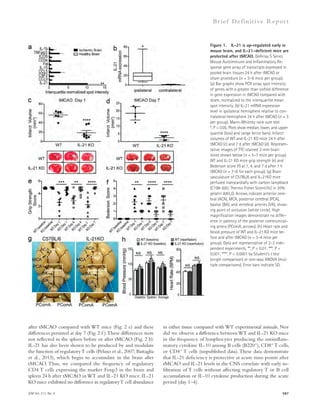
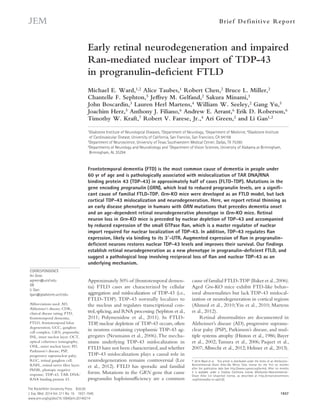
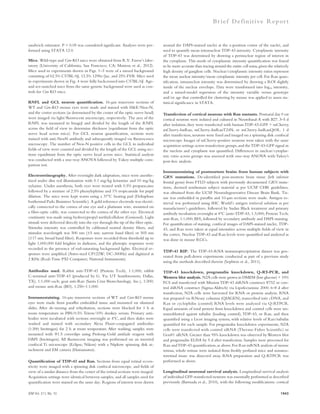
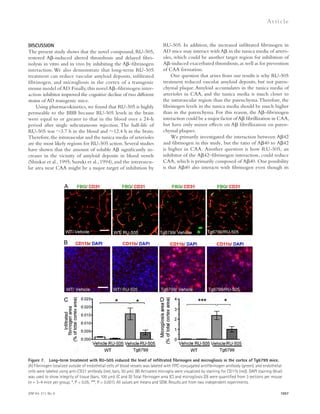
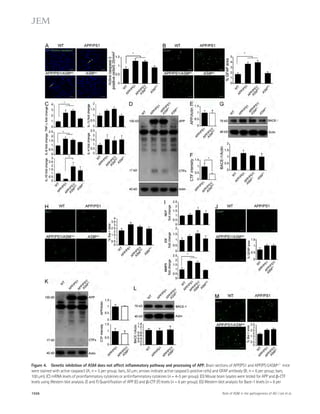
![Figure 5. RU-505 restored cognitive function in Tg6799 mice. (A) Freezing behavior was measured before electric foot shock during the training
day to assess the basal freezing tendency of each group of mice. (n = 8–10 mice per group). (B) Contextual memory was assessed by measuring freezing
behavior upon reexposure to the training chamber 24 h after fear conditioning training. (*, P 0.05; **, P 0.01; n = 8–10 mice per group). Results are
from two independent experiments. (C–E) Spatial learning and memory retention of WT and Tg6799 mice was assessed using the Barnes maze after 3 mo
of treatment with RU-505 or vehicle. One target hole was connected to a hidden escape chamber. (C) During training trials, latency to poke the target
hole was measured. Significance was assessed using two-way ANOVA analysis with repeated measure (WT/vehicle vs. Tg6799/vehicle: F[1,120] = 40.47;
P 0.001; Tg6799/vehicle vs. Tg6799/RU-505: F[1,108] = 11.97; P 0.01; n = 10–14 mice per group). Differences in latency were assessed by Bonferroni post hoc
analysis. (D–F) During the Barnes maze probe trial, latency to reach the closed target hole (D), number of visits to the target hole (E), and total traveled
distance (F) were measured ([E] *, P 0.05; **, P 0.01; ***, P 0.001; n = 10–14 mice per group; [F] ***, P 0.001; n = 10–14 mice per group). All results
of the Barnes maze are from three independent experiments.
deposition (green; Fig. 7 A) outside the endothelial cells of
blood vessels that were labeled using CD31 (red; Fig. 7 A), and
the area of activated microglia that were labeled using CD11b
(red; Fig. 7 B). The levels of infiltrated fibrinogen and micro-gliosis
were highly increased in the cortex of Tg6799 com-pared
with WT mice (Fig. 7, C and D), and these increases
were significantly decreased by RU-505 (Fig. 7, C and D).
in AD patients and mouse models of AD, and an increase of
inflammation in the brain is correlated with memory im-pairment
(Bayer et al., 1999; Dhawan and Combs, 2012;
Vom Berg et al., 2012).
Therefore, we measured the level of infiltrated fibrinogen
and microgliosis in the cortex of Tg6799 or WT littermate
mice after RU-505 treatment. We quantified fibrinogen
Figure 6. RU-505 restored spatial retention memory
in TgCRND8 mice without affecting motor behavior.
(A) The spatial memory of vehicle- or RU-505–treated WT
and TgCRND8 mice was assessed using Barnes maze.
(B and C) Spatial memory of RU-505–treated WT and
TgCRND8 mice was tested using the Barnes maze probe
trials. Time to reach the target hole (B), the number of visits
to the closed target hole (C), and total distance traveled (D)
were assessed (n = 7–11 mice per group). The results cor-roborate
those in Fig. 5 and are from one experiment. All
values are means and SEM.
1056 A-fibrin interaction inhibitor as AD treatment | Ahn et al.](https://image.slidesharecdn.com/jemneurosciencespecialissue-141202045722-conversion-gate02/85/Jem-neuroscience-special_issue-74-320.jpg)
![over 3 mo, which minimized this issue. Our future direction
would modify RU-505, and find less toxic analogues with sim-ilar
or better efficacy.
For more than a decade, A has been the major target for
developing AD therapies. Most of these efforts focused on using
antibodies to lower A levels, preventing A aggregation, or re-ducing
A production. However, none of these methods were
successful as the treatments did not show clinical efficacy or
caused serious adverse side effects such as aseptic meningoen-cephalitis
(Gilman et al., 2005; Mangialasche et al., 2010). How-ever,
numerous studies still support the hypothesis that A plays
an important role in the pathogenesis of AD (Tanzi and Bertram,
2005; Jonsson et al., 2012). Therefore, new strategies for anti-A
therapy are necessary for developing novel treatments for AD. In-hibiting
the interaction between A and its binding proteins
could be an alternative therapeutic approach, and our study
shows that a small molecule, bioavailable inhibitor of the A–
fibrinogen interaction, RU-505, significantly restored altered
thrombosis and improved cognitive deficits observed in AD
transgenic mouse models. Therefore, treatment of the neurovas-cular
pathology observed in AD using an inhibitor of the
A–fibrinogen interaction may be a valuable strategy for devel-oping
novel AD therapeutics.
MATERIALS AND METHODS
Animals
Tg6799 mice (The Jackson Laboratory) are double transgenic mice for APP/
Presenilin 1 that coexpress five early onset familial AD mutations on a mixed
background C57BL/6 x SJL (Oakley et al., 2006). TgCRND8 mice (pro-vided
by A. Chishti and D. Westaway, University of Toronto, Canada) have
three APP mutations (K670N, M671L, and V717F) driven by the human
prion protein promoter on a mixed background C57 x C3H/C57 (Chishti
et al., 2001). RU-505 was prepared in 2.5% EtOH, 4.5% Cremophor RH40
(Sigma-Aldrich), and 14% D5W (5% dextrose in water) in saline. We admin-istered
35 mg/kg dose of RU-505 or vehicle to Tg6799 mice and 25 mg/kg
dose or vehicle to TgCRND8 mice subcutaneously every other day. Non-transgenic
(WT) littermates were used in all experiments. The assigned geno-type
of all the mice used in the experiments throughout the paper was
double-checked by taking tail tissue the day of sacrifice. Only male mice
were used in experiments, and all animals were maintained in The Rocke-feller
University Comparative Biosciences Center and treated in accordance
with protocols approved by The Rockefeller University Institutional Animal
Care and Use Committee.
Primary compound screening
Approximately 93,000 compounds were screened using HTS. Compound
screening libraries that include known off-patent drugs, natural products, and
combinatorially elaborated active pharmacophores were purchased from
several vendors listed in Table 3. The primary assay used FP to measure the
changes in the anisotropy induced by binding of TAMRA-labeled A42
(Anaspec) to fibrinogen. TAMRA-A42 (2 nM) was mixed with 300 nM
fibrinogen (EMD Millipore) and 20 μM compounds (dissolved in 1% DMSO
[final]) in 50 mM PBS, pH 7.4, 0.001% Tween 20, and 0.001% BSA as 50 μl
final volume in black 384-well plates (Greiner) at RT. After binding reached
equilibrium, polarization measurements were recorded with a Perkin-Elmer
EnVision plate reader with excitation at 490 nm and emission at 535 nm. The
FP response was monitored and plotted as milli-Polarization (mP) units.
Compounds that showed 75% inhibition of the A–fibrinogen inter-action
in the FP assay were selected for screening by AlphaLISA as a second-ary
assay. Compounds (12.5 μM) were plated in white 384-well plates
affinity is 10 times less than A42, and RU-505 has a strong
inhibitory efficacy on A40–fibrinogen interaction (unpub-lished
data). Therefore, RU-505 could reduce CAA through
inhibition of both A42- and A40–fibrinogen interaction.
Second, despite the higher levels of A40 in vascular amy-loid,
A42 is also essential for vascular amyloid deposition
in transgenic mice overexpressing human APP (Van Dorpe
et al., 2000; McGowan et al., 2005) and AD human patients
(Roher et al., 1993; Shinkai et al., 1995). A42 could act as
a nucleation seed of amyloid deposit in the vessel walls and
accelerate deposition of A40 (Van Dorpe et al., 2000; Yoshiike
et al., 2003; McGowan et al., 2005). Therefore, even though
the ratio of A40 to A42 is higher in vascular amyloid, the
A42–fibrinogen interaction could be critically involved in
CAA formation.
Fibrinogen is a proinflammatory mediator in several dis-eases
and induces the activation of microglia in the nervous
system (Adams et al., 2007; Davalos and Akassoglou, 2012).
Our study showed that RU-505 treatment reduced the level
of infiltrated fibrinogen and activated microglia in the brain
of AD transgenic mice. One possible mechanism for this re-duction
is that RU-505 binds A, inhibits the A–fibrinogen
interaction, and facilitates fibrinogen degradation. The decreased
level of infiltrated fibrinogen could result in the decrease of
microgliosis. The other possible mechanism is that long-term
RU-505 treatment reduced vascular amyloid deposits and
prevented BBB leakage. This recovery of a healthy BBB could
reduce fibrinogen infiltration and inflammation in the paren-chyma
of Tg6799 mice.
Increased levels of plasma fibrinogen are associated with
cognitive deficits (Xu et al., 2008), AD risk (van Oijen et al.,
2005), and brain atrophy (Thambisetty et al., 2011), and in-creased
levels of fibrinogen have also been found in the CSF
of AD patients (Craig-Schapiro et al., 2011; Vafadar-Isfahani
et al., 2012). Moreover, several studies have shown that anti-coagulant
treatment improves cognition in mouse models of
AD and dementia patients (Ratner et al., 1972; Walsh et al.,
1978; Cortes-Canteli et al., 2010; Timmer et al., 2010). How-ever,
anticoagulant therapy can cause severe problems in
elderly patients who have a more fragile vasculature because
it may increase the incidence of major systemic bleeding. There-fore,
drugs should specifically block the A–fibrinogen inter-action
so that A-induced altered blood clot formation and
degradation can be restored without affecting general hemo-stasis.
RU-505 successfully targeted only A-induced altered
blood clot formation and did not affect general clot forma-tion
and degradation (Fig. 2 D and Fig. 3).
The maximum tolerated dose of RU-505 after single in-travenous
dose in mice was between 100 and 200 mg/kg.
When we treated Tg6799 mice and WT littermates with two
doses (100 and 50 mg/kg) of RU-505 every other day for 3 mo,
we found that 100 mg/kg for long-term treatment was toxic
to the AD mice, but 50 mg/kg showed no clinical signs of
toxicity except local chronic inflammation at the injection
site. To address the issue of local inflammation, we lowered the
dose to 35 mg/kg for Tg6799 or 25 mg/kg for TgCRND8
1058 A-fibrin interaction inhibitor as AD treatment | Ahn et al.](https://image.slidesharecdn.com/jemneurosciencespecialissue-141202045722-conversion-gate02/85/Jem-neuroscience-special_issue-76-320.jpg)
![JEM Vol. 211, No. 6
Ar t icle
biotinylated A42 (Anaspec) and 5 nM fibrinogen (EMD Millipore) for 1 h
at room temperature in 500 μl of binding buffer (50 mM Tris-HCl, pH 7.4,
150 mM NaCl, 0.1% Nonidet P-40, 0.1% BSA, and protease inhibitor mix-ture).
The samples were gently rotated for 1 h at room temperature with
30 μl streptavidin–Sepharose high performance beads (GE Healthcare). After
incubation, the beads were washed five times with binding buffer, and non-reducing
sample buffer was added to the beads for elution. Western blots
were performed using antifibrinogen antibody (Dako). Dot blots were per-formed
using anti-A antibody 4G8 (Covance) to show comparable amounts
1059
of A were also being pulled down.
The binding assay between fibrinogen
and monomeric or oligomeric A42
Biotin-A42 monomers and oligomers were prepared as in (Stine et al.,
2011). In brief, biotin-LC-A42 (Anaspec) was monomerized by treatment
with hexafluoroisopropanol, dissolved to 5 mM with dimethyl sulfoxide,
then diluted to 100 μM with cold PBS, and sonicated. Monomeric biotin-
LC-A42 was incubated at 4°C for 24 h for oligomeric preparation. 1 nM
fibrinogen was mixed with increasing concentrations of monomeric or
oligomeric biotin-LC-A42 (0.5–20 nM) for 30 min at room temperature
and the binding affinity was measured using AlphaLISA assay. The inhibitory
efficacy of RU-505 on the interaction between fibrinogen and monomeric
or oligomeric biotin-LC-A42 was accessed in dose–response experiments
using AlphaLISA assay.
In vitro thrombosis and fibrinolysis assay
To test whether hit compound have an effect on fibrin clot formation and
lysis, 20 μM of each compound (dissolved in 0.4% DMSO [final]) or DMSO
control was incubated with fibrinogen (1.5 μM) in the presence or absence
of A42 (3 μM) for 10 min and then mixed with plasminogen (0.25 μM) in
20 mM Hepes buffer (pH 7.4) with 137 mM NaCl. Fibrin clot formation
and degradation was analyzed measuring turbidity right after adding throm-bin
(0.5 U/ml), tPA (0.15 nM), and CaCl2 (5 mM) in a final volume of
150 μl. Assays were performed at RT in High Binding 96-well plates
(Thermo Fisher Scientific) in triplicate and were measured at 450 nm using
a Spectramax Plus384 reader (Molecular Devices).
SPR
SPR experiments were performed to test whether our lead compounds bind
to A42 as described previously (Richter et al., 2010). Biacore 3000 instru-ment
and CM5 sensor chips (GE Healthcare) were used for this assay. Hexa-fluoroisopropanol-
treated monomerized A42 was immobilized to the
sensor chip surface by amine coupling. Compounds were diluted to 40 μM
from DMSO stock solutions in PBS as running buffer (final 2% DMSO) and
injected for 2 min at a flow rate of 30 μl/min using the KINJECT command.
After the dissociation phase the chip was rinsed with 20 mM HCl. Corre-sponding
DMSO dilutions were used as a buffer blank, and a solvent correc-tion
assay was performed to correct the difference of DMSO response
between empty reference surface and protein-immobilized surface. Sulindac
sulfide and sulindac were used as positive control and negative controls, re-spectively
(Richter et al., 2010).
In vivo toxicity study
Maximum tolerated dose studies were performed to determine the toxicity
of RU-505 (AMRI) and to identify the optimal dose for in vivo assays. Sin-gle
injection toxicity was performed at Absorption Systems LP (Exton, PA),
and four different doses (200, 100, 50, and 20 mg/kg mouse) of RU-505,
along with saline and vehicle, were injected into male and female CD-1
mice intravenously. Mortality and overt clinical signs of toxicity were moni-tored
for 2 d. All animals dosed with 200 mg/kg were found dead after single
intravenous injection, and no clinical signs of toxicity were observed after
single dose of 20, 50, or 100 mg/kg for 2 d after injection. Therefore, the
maximum tolerated dose of RU-505 after single intravenous dose in mice
was established as 100 mg/kg.
(Greiner) and were incubated with 10 nM biotinylated A42 (Anaspec) and
1 nM fibrinogen for 30 min at RT in final volume of 10 μl assay buffer
(25 mM Tris-HCl, pH 7.4, 150 mM NaCl, 0.05% Tween-20, and 0.1%
BSA). The mixture was incubated with anti–fibrinogen antibody (Dako),
20 μg/ml streptavidin-conjugated donor, and protein A–conjugated accep-tor
beads (PerkinElmer) for 90 min at RT. Samples were read by a PerkinElmer
EnVision plate reader.
Hit compounds from the secondary assay were evaluated using Lipinski’s
Rule of Five to determine whether each chemical compound has properties
that make it a potential usable drug. If compounds violated more than one of
Lipinski’s Rule of Five, those compounds were removed from our list. The
AlphaScreen TruHits kit (PerkinElmer) was used to detect those compounds
that react with singlet oxygen and thus unspecifically quench the assay. The
AlphaScreen TruHits kit also allows for the identification of color quenchers,
light scatterers (insoluble compounds), and biotin mimetics interfering with
the AlphaLISA signal. If inhibition by quenching was more than 30% at 10 μM
compound, those compounds were removed from our list. After completing
the quenching test, we screened hit compounds in a dose–response experiment
with various compound concentrations (0.01–20 μM) using FP and Alpha-
LISA. The data were fitted to sigmoidal dose–response equation (Y = Bottom +
(Top – Bottom)/1 + 10(logIC50 X) × Hill coefficient)) using GraphPad Prism 4 to
calculate half-maximal inhibition (IC50) of each compound. Compounds with
IC50 50 μM in both FP and AlphaLISA were purchased as powder and were
retested in dose–response experiments using both assays.
Analogue compound screening
To improve our candidate compounds, we had access to the ChemNavigator
database, which has 50 million commercially available compounds and software
for Tanimoto-based similarity searching. We purchased 2,000 analogue com-pounds
through ChemNavigator or directly from Albany Molecular Research
Inc. These analogues were tested using AlphaLISA at 5, 10, and 20 μM. We se-lected
compounds which have 50% inhibition at 10 μM and a proportional in-hibitory
effect at 5 or 20 μM. Drug-like compounds were evaluated using
Lipinski’s Rule of Five, and false-positive compounds were filtered out using the
AlphaScreen TruHits kit (PerkinElmer) as described above. Compounds with
IC50 10 μM in both FP and AlphaLISA were selected using dose–response ex-periments.
Selected compounds were purchased as powder and were retested in
dose–response experiments using both assays. Finally, we identified hit com-pounds
of with IC50 3 μM in FP and IC50 10 μM AlphaLISA assay.
Pull-down assay
Hit compounds were tested using a pull-down assay as described previously
(Ahn et al., 2010). In brief, compounds at 10 μM were incubated with 100 nM
Table 3. Vendor list for primary screening library
Provider No. of compound
from each provider
ChemDiv 21,986
Prestwick 1,110
Cerep 4,000
ChemBridge 5,000
Microsource 2,000
AMRI 50,000
Biofocus 7,750
GreenPharma 240
Sigma LOPAC 1,280
Prof. Derek Tan (Memorial Sloan-
Kettering Cancer Center, New
York, NY)
350
Total 93,716](https://image.slidesharecdn.com/jemneurosciencespecialissue-141202045722-conversion-gate02/85/Jem-neuroscience-special_issue-77-320.jpg)
![Ar t icle
Acid sphingomyelinase modulates
the autophagic process by controlling
lysosomal biogenesis in Alzheimer’s disease
Jong Kil Lee,1,2,3 Hee Kyung Jin,1,4 Min Hee Park,1,2,3 Bo-ra Kim,1,2,3
Phil Hyu Lee,5 Hiromitsu Nakauchi,6 Janet E. Carter,7 Xingxuan He,8
Edward H. Schuchman,8 and Jae-sung Bae1,2,3
1Stem Cell Neuroplasticity Research Group, 2Department of Physiology, Cell and Matrix Research Institute, School of Medicine,
3Department of Biomedical Science, BK21 Plus KNU Biomedical Convergence Program, 4Department of Laboratory Animal
Medicine, College of Veterinary Medicine, Kyungpook National University, Daegu 702-701, Korea
5Department of Neurology and Brain Research Institute, Yonsei University College of Medicine, Seoul 120-752, Korea
6Division of Stem Cell Therapy, Center for Stem Cell Biology and Regenerative Medicine, Institute of Medical Science,
University of Tokyo, Tokyo 108-8639, Japan
7Mental Health Sciences Unit, Faculty of Brain Sciences, University College London, London WC1E 6DE, England, UK
8Department of Genetics and Genomic Sciences, Icahn School of Medicine at Mount Sinai, New York, NY 10029
In Alzheimer’s disease (AD), abnormal sphingolipid metabolism has been reported, although
the pathogenic consequences of these changes have not been fully characterized. We show
that acid sphingomyelinase (ASM) is increased in fibroblasts, brain, and/or plasma from
patients with AD and in AD mice, leading to defective autophagic degradation due to
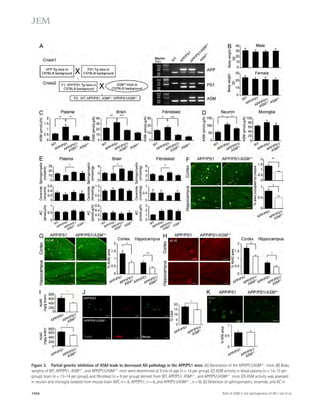
lysosomal depletion. Partial genetic inhibition of ASM (ASM+/) in a mouse model of famil-ial
pathological findings, including reduction of amyloid- (A) deposition and improvement
of memory impairment. Similar effects were noted after pharmacologic restoration of ASM
to the normal range in APP/PS1 mice. Autophagic dysfunction in neurons derived from FAD
patient induced pluripotent stem cells (iPSCs) was restored by partial ASM inhibition.
Overall, these results reveal a novel mechanism of ASM pathogenesis in AD that leads to
defective autophagy due to impaired lysosomal biogenesis and suggests that partial ASM
inhibition is a potential new therapeutic intervention for the disease.
The Rockefeller University Press $30.00
J. Exp. Med. 2014 Vol. 211 No. 8 1551-1570
www.jem.org/cgi/doi/10.1084/jem.20132451
AD (FAD; amyloid precursor protein [APP]/presenilin 1 [PS1]) ameliorated the autopha-gocytic
1551
defect by restoring lysosomal biogenesis, resulting in improved AD clinical and
Alzheimer’s disease (AD) is the most common
form of dementia. It is characterized clinically
by progressive loss of memory, and pathologi-cally
by the presence of neuritic plaques and
neurofibrillary tangles (Selkoe, 2001). There are
profound biochemical alterations in multiple
pathways in the AD brain, including changes in
amyloid- (A) metabolism, tau phosphoryla-tion,
and lipid regulation, although to date the
underlying mechanisms leading to these complex
abnormalities, as well as the downstream conse-quences,
remain largely unknown (Yankner et al.,
2008; He et al., 2010; Mielke et al., 2012).
Sphingolipid metabolism is an important pro-cess
for tissue homeostasis that regulates the
formation of several bioactive lipids and second
messengers that are critical in cellular signaling
(Lahiri and Futerman, 2007; Wymann and
Schneiter, 2008). In the brain, the proper bal-ance
of sphingolipid metabolites is essential for
normal neuronal function, and subtle changes in
sphingolipid homeostasis may be intimately in-volved
in neurodegenerative diseases including
AD (Cutler et al., 2004; Grimm et al., 2005;
Hartmann et al., 2007; Grösgen et al., 2010;
Haughey et al., 2010; Mielke and Lyketsos, 2010;
Di Paolo and Kim, 2011; Tamboli et al., 2011).
Recently, our studies and those of others
(Katsel et al., 2007; He et al., 2010) have shown
that the activity of several sphingolipid metabolizing
enzymes, including acid sphingomyelinase
CORRESPONDENCE
Jae-sung Bae:
jsbae@knu.ac.kr
Abbreviations used: A, amyloid-;
AC, acid ceramidase; AD,
Alzheimer’s disease; ALP,
autophagy–lysosome pathway;
AMI, amitriptyline-hydrochloride;
AP, alkaline phosphatase;
ApoE4, apolipoprotein E4;
APP, amyloid precursor protein;
ASM, acid sphingomyelinase;
AV, autophagic vacuole; CM,
conditioned medium; EM,
electron microscope; FAD,
familial AD; i.c., intracerebral;
iPSC, induced pluripotent stem
cell; Lamp1, lysosomal-associated
membrane protein 1; LBPA,
lysobisphosphatidic acid; LC3,
microtubule-associated protein 1
light chain 3; M6P, mannose-6-
phosphate; NPD, Niemann-
Pick disease; PD, Parkinson’s
disease; PS1, presenilin 1;
SA--gal, senescence-associated-
-galactosidase; TFEB, tran-scription
factor EB. J.K. Lee and H.K. Jin contributed equally to this paper.
© 2014 Lee et al. This article is distributed under the terms of an Attribution–
Noncommercial–Share Alike–No Mirror Sites license for the first six months
after the publication date (see http://www.rupress.org/terms). After six months
it is available under a Creative Commons License (Attribution–Noncommercial–
Share Alike 3.0 Unported license, as described at http://creativecommons.org/
licenses/by-nc-sa/3.0/).](https://image.slidesharecdn.com/jemneurosciencespecialissue-141202045722-conversion-gate02/85/Jem-neuroscience-special_issue-81-320.jpg)
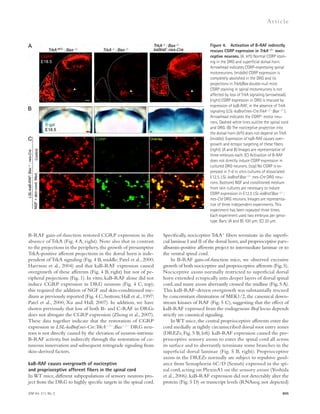
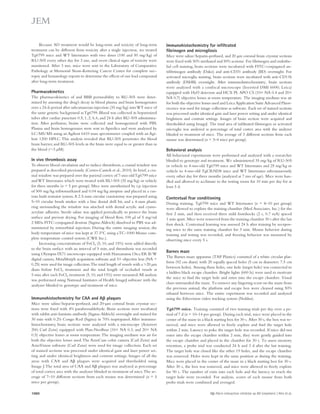
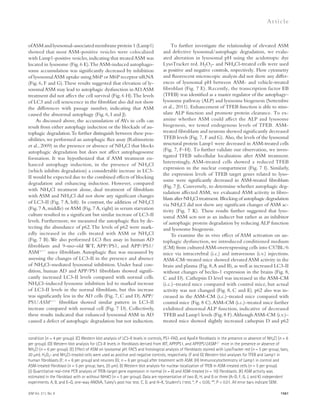
![ASM elevation causes defective autophagic
degradation by lysosomal depletion
To gain more direct insights into the relationship of ASM and
autophagic dysfunction, we treated human fibroblasts and neu-rons
with recombinant 1–10 μM ASM and determined the
LC3-II and p62 levels. ASM strongly accelerated LC3-II and
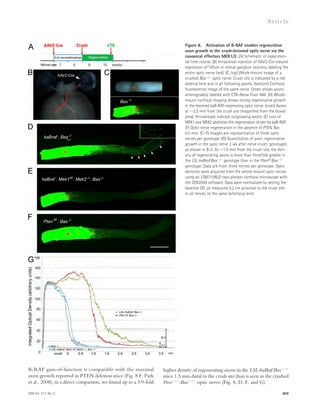
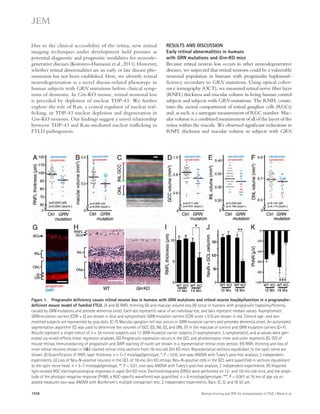
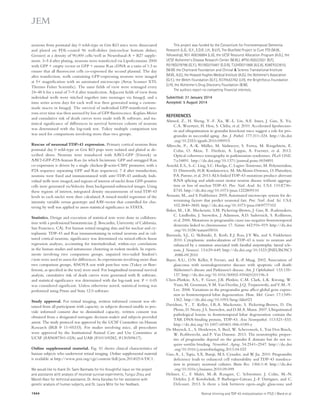
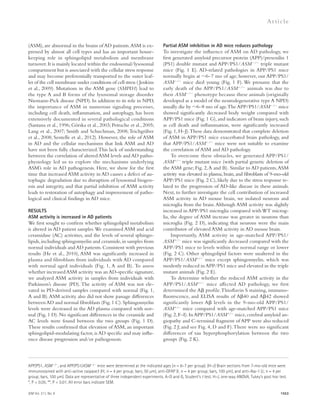
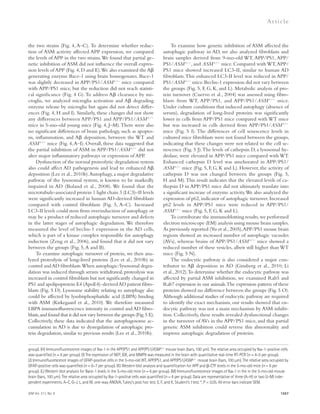
Figure 5. Partial genetic inhibition of
ASM reverses defective autophagy in
APP/PS1 mice. (A) Western blot analysis of
LC-3 and beclin-1 levels in controls, PS1-FAD,
and ApoE4 fibroblasts. (B) LC3-II and beclin-1
levels were quantified (n = 4 per group).
(C) Immunocytochemistry for LC3 in controls,
PS1-FAD, and ApoE4 fibroblast (n = 4–5 per
group; bars, 20 μm). (D) Degradation of long-lived
proteins was measured in controls, PS1-
FAD, and ApoE4 fibroblasts (n = 6 per group).
(E) Representative images and quantification
of LBPA in control, PS1-FAD, and ApoE4
fibroblast (n = 4 per group; bars, 50 μm).
(F) Western blot analyses for LC3, beclin-1,
p62, and cathepsin D in tail fibroblast derived
from WT, APP/PS1, ASM+/, and APP/PS1/
ASM+/ mice. (G) Densitometric analysis of
LC-3-II, beclin-1, p62, and cathepsin D (n =
7–8 per group). (H) Cathepsin D activity in
mice tail fibroblast (n = 4 per group). (I) Rates
of proteolysis of long-lived proteins in fibro-blasts
(n = 6 per group). (J) Representative
images and quantification data of SA--gal
staining in the mice tail fibroblasts (n = 5 per
group; bars, 50 μm). (K) Western blot analy-ses
for LC3, beclin-1, p62, and cathepsin D in
the brains of 9-mo-old WT, APP/PS1, ASM+/,
and APP/PS1/ASM+/ mice. (L) Densitometric
quantification of LC-3-II, beclin-1, p62, and
cathepsin D (n = 6–8 per group). (M) Cathep-sin
D activity in brain extracts of WT, APP/
PS1, ASM+/, and APP/PS1/ASM+/ mice (n = 4
per group). (N) EM images and quantifica-tion
data of cortical region. Higher magnifi-cation
of boxed area shows detail of AVs
(arrow; n = 5 per group; bars: [low magnifi-cation]
2 μm, [high magnification] 1 μm).
(O) Western blot analysis of Rab5 and Rab7
levels in the brain lysates (n = 5 per group).
Data are representative of two (A–E and N) or
three (F–M and O) independent experiments.
B–O, one-way ANOVA, Tukey’s post hoc test.
*, P 0.05. All error bars indicate SEM.
p62 levels in human fibroblasts and neurons in a concentration-dependent
manner (Fig. 6, A–C). The level of beclin-1 ex-pression
was not affected by ASM (Fig. 6, A and C), indicating
that the accumulation of autophagosomes was not due to the
biogenesis pathway. ASM is found in a secretory and a lysosomal
form ( Jenkins et al., 2009), and the mannose-6-phosphate (M6P)
1558 Role of ASM in the pathogenesis of AD | Lee et al.](https://image.slidesharecdn.com/jemneurosciencespecialissue-141202045722-conversion-gate02/85/Jem-neuroscience-special_issue-88-320.jpg)
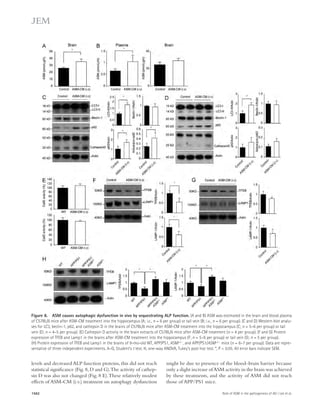
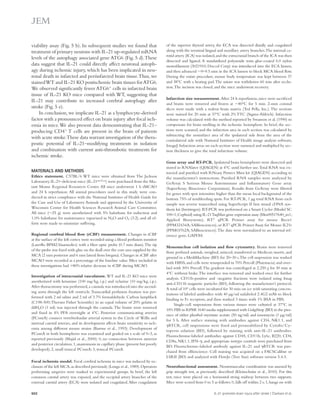
![To examine whether partial genetic inhibition of ASM
affected the ALP in APP/PS1 mice, we also analyzed TFEB
and Lamp1 levels in the brain samples derived from WT,
APP/PS1, ASM+/, and APP/PS1/ASM+/ mice. Compared
with WT, APP/PS1 mice showed significantly decreased TFEB
and Lamp1 expression, which were increased in APP/PS1/
ASM+/ mice (Fig. 8 H). Together, these findings show for
the first time a direct correlation of lysosomal ASM and the
function of the ALP, and suggest that abnormal autophagic
degradation in AD may be due to the effects of elevated ASM
expression on this pathway.
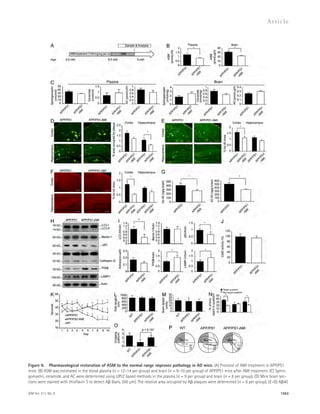
Pharmacological restoration of ASM to the
normal range improves pathology in AD mice
The ASM-mediated lysosomal/autophagic dysfunction in AD
prompted us to examine possible therapeutic implications of
this pathway. To decrease ASM in APP/PS1 mice, we undertook
pharmacological inhibition using amitriptyline-hydrochloride
(AMI) for 4 mo (Fig. 9 A). AMI is a known inhibitor of ASM
that can cross the blood–brain barrier. At 9 mo of age, AMI-treated
APP/PS1 mice exhibited decreased ASM activity
compared with vehicle-treated mice (Fig. 9 B). Other sphingo-lipid
metabolites were not changed (Fig. 9 C). A levels were
decreased in the AMI-treated APP/PS1 mice compared with
the nontreated littermates (Fig. 9, D–G). The levels of LC3-II,
p62, and cathepsin D were decreased in the AMI-treated APP/
PS1 mice (Fig. 9, H and I). Actual activity of cathepsin D was
not changed by AMI treatment (Fig. 9 J). AMI treatment sig-nificantly
increased TFEB and Lamp1 protein levels in APP/
PS1 mice (Fig. 9, H and I). Similarly, APP/PS1 mice treated
with AMI showed recovery of memory function (Fig. 9, K–P).
Overall, these positive but relatively moderate results (e.g., A
levels) in AMI-treated APP/PS1 mice might be due to under
dosing of the animals. We speculate that this may be improved
in the future by adjusting the dose or using modified, more
potent drugs of a similar class.
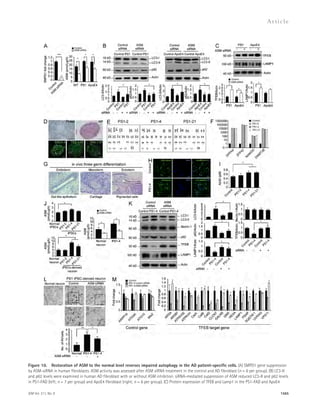
Restoration of ASM ameliorates autophagic
dysfunction in the AD patient–specific cells
To further validate our observation made by partial ASM in-hibition
in AD mice, we studied possible changes in autophagy
dysfunction in human AD fibroblast after ASM inhibition.
Elevated ASM levels in human AD fibroblasts (PS1–familial
AD [FAD] and ApoE4) were restored to normal range by ASM
siRNA treatment (Fig. 10 A). ASM siRNA-treated human
AD fibroblasts (PS1-FAD and ApoE4) showed decreased
LC3-II and p62 accumulation compared with control siRNA-treated
cells (Fig. 10 B). Also, ASM siRNA was able to increase
lysosome levels (as judged by Lamp1 expression) by activating
TFEB in the human AD fibroblasts (Fig. 10 C).
Many insights into the pathogenesis in neurodegenerative
disease have come from investigating postmortem brain tis-sues
due to the difficulty of invasive access to living human
CNS. The recent developments in induced pluripotent stem
cells (iPSCs) and induced neurons have allowed investigation
of pathogenesis of neurological diseases in vitro (Kondo et al.,
2013). To explore whether the observed effects of ASM in
previous results are paralleled by similar alterations in AD human
neurons, we first established iPSCs with PS1 mutation (PS1
iPSC-2, -4, and -21) by transduction of human fibroblast with
retroviruses encoding OCT4, SOX2, KLF4, and c-Myc. The
PS1-iPSC cell line was shown to be fully reprogrammed
to pluripotency, as judged by colony morphology, alkaline
phosphatase (AP) staining, expression of pluripotency-associated
transcription factors and surface markers, karyotype stability,
and generation of teratomas (Fig. 10, D–G). To establish
whether the PS1 mutation may affect neuronal differentia-tion,
PS1 iPSC and control iPSC lines were induced to dif-ferentiate
into neurons for 10 d. Consistent with previous
results (Kondo et al., 2013), no obvious differences in the abil-ity
to generate neurons were observed between control and
PS1-iPSCs (Fig. 10 H). A42 secretion level was increased in
PS1 iPSC-derived neurons compared with control iPSC-derived
neuron (Fig. 10 I).
Next, we investigated whether elevated ASM in fibroblasts
was also evident increased in PS1 iPSC and iPSC-derived
neurons. The ASM activity in PS1 iPSC was not changed ex-cept
for PS1-4 iPSC in comparison to those in control iPSC,
but the activity of ASM was significantly higher in PS1 iPSC-derived
neurons compared with control iPSC-derived neu-ron
(Fig. 10 J). Elevated ASM levels in PS1 iPSC-derived
neurons were restored to normal range by ASM siRNA treat-ment
(Fig. 10 J). Neurons from PS1-4 iPSCs also had signifi-cantly
higher abnormal autophagic markers than neurons
from control iPSC (Fig. 10 K). ASM siRNA treatment significantly
decreased the protein level of abnormal autophagic
markers in PS1 iPSC-derived neurons (Fig. 10 K). To corrob-orate
the immunoblotting results, we performed EM analysis
using control and PS1 iPSC-derived neurons. As expected,
PS1 iPSC-derived neurons exhibited increased AV accumula-tion,
whereas ASM siRNA-treated PS1 iPSC-derived neu-rons
showed a reduced number of these vesicles (Fig. 10 L).
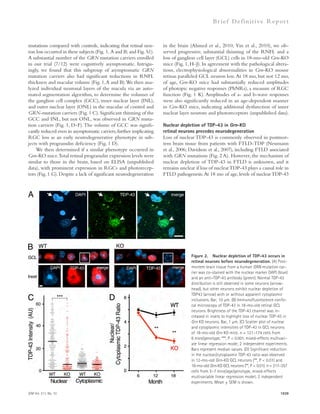
and A42 in the brains of AMI treated or nontreated APP/PS1 mice were assessed using immunofluorescence staining (E and F; n = 8 per group; bars,
200 μm) and ELISA kits (G; n = 6 per group). (H and I) Western blot analyses and quantification for LC3, Beclin-1, p62, cathepsin D, TFEB, and Lamp1 in
the brains of APP/PS1 mice treated with AMI or control (n = 6–8 per group). (J) Cathepsin D activity in the brain extracts of AMI-treated or nontreated
APP/PS1 mice (n = 4 per group). (K) Escape latencies of APP/PS1 mice treated with AMI or control over 10 d (WT, n = 14; nontreated APP/PS1, n = 10; and
AMI-treated APP/PS1, n = 12). (L–O) Probe trial day 11. (L and M) Path length (L) and swim speed (M) were recorded and analyzed. (N) Time spent in target
platform and other quadrants was measured. (O) The number of times each animal entered the small target zone during the 60-s probe trial. (P) Repre-sentative
swimming paths at day 10 of training. Data are representative three independent experiments. B–J and N, Student’s t test; K–M and O, one-way
ANOVA, Tukey’s post hoc test. *, P 0.05; **, P 0.01. All error bars indicate SEM.
1564 Role of ASM in the pathogenesis of AD | Lee et al.](https://image.slidesharecdn.com/jemneurosciencespecialissue-141202045722-conversion-gate02/85/Jem-neuroscience-special_issue-94-320.jpg)
![2007). Moreover, it has been shown that the abnormal au-tophagic
flux in AD may be due to dysfunction at the late au-tophagy
stage associated with the lysosome (Lai and McLaurin,
2012; Zhou et al., 2012). Similar to previous results (Lee et al.,
2010b; Lai and McLaurin, 2012), we found that the impaired
autophagic flux in AD was associated with reduced autopha-gic
degradation due to decreased ALP function. In addition,
we show for the first time that this is directly linked to ele-vated
ASM activity. Suppression of ASM expression or inhibi-tion
of its uptake and delivery to lysosomes using M6P reversed
abnormal autophagic degradation. These findings indicate
that increased lysosomal ASM plays a negative role in AD by
causing autophagic dysfunction, suggesting that therapeutic
strategies to restoring ASM activity to the normal range may
be beneficial for AD pathology.
This was further studied in the AD mice by finding that
partial genetic or systemic inhibition of ASM activities in these
animals largely reversed autophagic pathology by restoring
ALP function, as well as reducing the accumulation of incom-pletely
digested substrates within the autophagic-lysosomal
compartments (e.g., LC3-II and p62). A accumulation also
was reduced in response to ASM inhibition, as was cathepsin D
expression. There are several challenges associated with inter-pretation
of cathepsin D levels in AD. Although some reports
have shown that cathepsin D activities were decreased in AD
(Lee et al., 2010b), many studies indicate that cathepsin D is
elevated in AD and contributes to the pathogenesis, such as A
formation (Cataldo et al., 2004; Lai and McLaurin, 2012; Zhou
et al., 2012). A recent paper suggested that COP9 signalosome
deficiency increased cathepsin D levels but reduced the au-tophagic
degradation. They suggested that these results were
associated with a failure of lysosomal assembly of cathepsin D
because only a lysosomal cathepsin D could affect autophagic
degradation (Su et al., 2011). In this study, we have found that
maturation of cathepsin D was increased in AD mice, but the
actual enzyme activity was not changed between the groups.
This result indicated that the elevated levels of cathepsin D did
not ultimately translate into a significant increase of enzyme
activity. Based on these papers and our data, a plausible inter-pretation
of increased cathepsin D in our AD mice is that AD
microenvironment attempts to increase cathepsin D synthesis,
but this does not have a direct impact on lysosomal function
because the activity of the enzyme is unchanged. Therefore,
Decreased TFEB target genes in PS1 iPSC-derived neurons
were also significantly increased by ASM siRNA treatment
(Fig. 10 M). These results confirm that abnormal autophagy
observed in AD mice and human fibroblasts by ASM also
occur in AD patient neurons, and restoration of ASM back to
normal levels is able to ameliorate autophagic dysfunction by
restoring lysosomal biogenesis in AD patient cells.
DISCUSSION
Although the exact causes of AD are unknown, the complex
interactions of genetic and environmental factors are likely play
important roles in the pathogenesis. ASM activity is known to
be increased by environmental stress and in various diseases,
and is elevated in AD patients (He and Schuchman, 2012).
One downstream consequence of increased ASM is elevated
ceramide, contributing to cell death, inflammation, and other
common disease findings. Although elevated ASM is known
to occur in AD, the cellular mechanisms that link ASM and
AD have not been fully characterized. The data presented
here suggest a previously unknown role of ASM in the down-regulation
of lysosomal biogenesis and inhibition of lysosome-dependent
autophagic proteolysis. The findings also establish
proof of concept for ASM inhibitor therapy in AD.
Our previous study showed that sphingolipid metabolism
was severely impaired in the human AD brain, and that ASM
activity was positively correlated with the A levels (He et al.,
2010). Consistent with our previous study, we found that ASM
was significantly increased in fibroblasts, brain, and/or plasma
from patients with AD and in AD mice, although other sphin-golipid
factors were unaltered. There are some differences be-tween
the previous and this study. For example, the previous
results showed increased ceramide level in AD, but we could
not found significant changes of sphingolipid factors includ-ing
ceramide in AD compared with normal samples. These
differences might be related to the fact that once formed, ce-ramide
can rapidly enter several metabolic pathways. It may
be used for either the biosynthesis of complex lipids or bro-ken
down into sphingosine, which itself is rapidly converted
to sphingosine 1 phosphate.
Accumulation of abnormal AVs has been observed in AD
(Lee et al., 2010b; Nixon and Yang, 2011), and the autophagy
pathway is increasingly regarded as an important contributor
to A-mediated pathogenesis in AD (Yu et al., 2005; Nixon,
fibroblast after ASM inhibition (n = 5–6 per group). (D–G) Generation of PS1 iPSC lines from patient fibroblast. (D) Established iPSCs showed embryonic
stem cell–like morphology (Phase; bar, 1 mm), AP activity (bar, 200 μm), and expressed pluripotent stem cell markers SSEA4 (bar 100 μm), TRA1-60 (bar
100 μm), and TRA1-81 (bar 100 μm). (E) Normal karyotype of PS1 iPSC. (F) Quantitative real-time PCR analysis of hESC marker gene of PS1 iPSC (n = 3 per
group). (G) Gross morphology and hematoxylin-eosin staining of representative teratomas generated from PS1-4 iPSCs (bars, 50 μm). (H) Estimation of
neural differentiation from control and PS1-4 iPSCs. Representative images of immunocytochemical staining the -III tubulin after neural differentiation
(bars, 50 μm). (I) The amount of A42 secreted from control iPSC-derived neuron and PS1 iPSC-derived neuron (n = 5 per group). (J) Characterization of
ASM activity in the control and PS1 iPSC and iPSC-derived neurons (n = 6 per group). (K) Western blot analyses for LC3, beclin-1, p62, TFEB, and Lamp1 in
the control and PS1-4 iPSC–derived neuron after ASM siRNA treatment (n = 5–6 per group). (L) EM images and quantification data of control and PS1
iPSC-derived neurons. Higher magnification of boxed area shows detail of AVs (arrow; n = 4 per group; bars: [low magnification] 1 μm, [high magnifica-tion]
500 nm). (M) Quantitative real-time PCR analysis of TFEB-target gene expression in iPSC-derived neurons after ASM siRNA treatment (n = 5–6 per
group). Data are representative of two (A, D–G, I, and L), or three (B, C, H, J, K, and M) independent experiments. A, C, F, I, J, and M, Student’s t test. B, K,
and L, one-way ANOVA, Tukey’s post hoc test. *, P 0.05; **, P 0.01; ***, P 0.001. A–K, error bars indicate SEM. L and M, Error bars indicate SD.
1566 Role of ASM in the pathogenesis of AD | Lee et al.](https://image.slidesharecdn.com/jemneurosciencespecialissue-141202045722-conversion-gate02/85/Jem-neuroscience-special_issue-96-320.jpg)
![JEM Vol. 211, No. 8
Ar t icle
1567
enhanced cathepsin D level in our AD mice induced by in-creased
ASM is more likely a compensatory response to an
impaired lysosome system. The present study also provides the
first evidence of increased ASM activity and autophagic dys-function
in living human (iPSC-derived) neurons derived
from AD patients and that restoring normal levels of ASM in
AD neurons effectively blocks abnormal autophagy.
Overall, the data presented here show that increased ASM
activity in AD contributes to the abnormal lysosomal/au-tophagic
process by leading to dysfunction of ALP. This results
in an inability to break down appropriate substrates during
the autophagy process. Restoration of ASM effectively blocks
AD progression by increasing autophagic degradation. Al-though
the involvement of other ASM-related mechanisms in
AD remains to be explored, the data in this study demonstrate
that inhibition of ASM improves A clearance and rescues
impaired memory in a validated mouse model of AD, suggest-ing
this as a potential therapy for AD patients in the future.
MATERIALS AND METHODS
Mice. Transgenic mouse lines overexpressing the hAPP695swe (APP) and
presenilin-1M146V (PS1) mutations, respectively, were generated at GlaxoSmithKline
by standard techniques as previously described (Howlett et al.,
2004). In brief, a Thy-1–APP transgene was generated by inserting the 695 aa
isoform of human cDNA (APP695) harboring the Swedish double familial
mutation (K670N; M671L) into a vector containing the murine Thy-1 gene.
The Thy-1–PS-1 transgene was generated by inserting the coding sequence
of human PS-1 cDNA harboring the M146V familial mutation into a vector
containing the murine Thy-1 gene. Transgenic lines were generated by pro-nuclear
microinjection into fertilized oocytes from either C57BL/6xC3H
mice in the case of Thy-1-APP transgene, or into fertilized oocytes from pure
C57BL/6 mice in the case of Thy-1–PS-1 transgene. Thy-1 APPswe mice were
generated and backcrossed onto a pure C57BL/6 background before crossing
with TPM (PS-1 M146V) mice to produce heterozygote double mutant mice.
ASM+/ mice (C57BL/6 background; Horinouchi et al., 1995) were bred
with APP/PS1 mice to generate APP/PS1/ASM+/ mice. Because APP/PS1
mice show sex difference in disease progression, we used only male mice. Data
analysis of APP/PS1 mice was done at 5 or 9 mo old. Block randomization
method was used to allocate the animals to experimental groups. To eliminate
the bias, we were blinded in experimental progress such as data collection and
data analysis. SCID Beige mice (Charles River) were used for teratoma forma-tion
assay. Mice were housed at a 12 h day/12 h night cycle with free access to
tap water and food pellets. Mouse studies were approved by the Kyungpook
National University Institutional Animal Care and Use Committee (IACUC).
Plasma collection. Human plasma samples were obtained from individuals
with AD, PD, and age-matched, non-AD controls from Yonsei University
Severance Hospital (Table S1). Informed consent was obtained from all sub-jects
according to the ethics committee guidelines at the Yonsei University
Severance Hospital.
Cell culture. Human fibroblast lines (normal, PS1, ApoE4, and PD) ac-quired
from the Coriell Institute were maintained in DMEM with 15% FBS.
The human cortical neuronal cell line HCN-2 was acquired from ATCC.
Cells with a passage number 10–15 were used in this study. To obtain CM
containing ASM, 5 × 10⁵ Chinese hamster ovary cells overexpressing human
ASM (He et al., 1999) were cultured in DMEM for 2 d. Cells were washed
with PBS and changed with new media. 24 h later, the CM was collected,
centrifuged, and filtered using a 0.22 μm filter. We isolated WT, APP/PS1,
APP/PS1/ASM+/, and ASM+/ mouse tail fibroblasts as previously de-scribed
(Takahashi et al., 2007a) from 9-mo-old mice. For some experiments,
cells were treated with purified, recombinant ASM or ASM siRNA to mea-sure
autophagy regulation. NH4Cl was used to inhibit the autophagic flux.
For the inhibition of lysosomal ASM uptake, 10 mM M6P or M6P receptor
siRNA were added to the fibroblast culture media at the same time as ASM.
Drug or CM treatments. 4-mo-old APP/PS1 mice received 100 μg/g body
weight AMI (Sigma-Aldrich) per os in their drinking water for 4 mo, and a
control group received water without drug. 3-mo-old C57BL/6 mice were treated
with ASM-CM via i.v. (100 μl) or i.c. (3 μl) injections on 10 consecutive days.
Immunofluorescence. Thioflavin S staining was done according to previ-ously
described procedures (Lee et al., 2012). We used anti-20G10 (mouse,
1:1,000, provided by D.R. Howlett, GlaxoSmithKline, Harlow, Essex, UK)
for A 42, anti-G30 (rabbit, 1:1,000, provided by D.R. Howlett) for A40,
rabbit anti–Iba-1 (1:500; Wako), rabbit anti-GFAP (1:500, Dako), mouse
anti–-SMA (1:400; Sigma-Aldrich), rabbit anti-AT8 (1:500; Thermo Fisher
Scientific), and rabbit anti–active caspase3 (1:50; EMD Millipore). The sec-tions
were analyzed with a laser-scanning confocal microscope (FV1000;
Olympus) or with a BX51 microscope (Olympus). MetaMorph software
(Molecular Devices) was used to quantification.
Ab ELISA. For measurement of A40 and A42, we used commercially
available ELISA kits (BioSource). Hemispheres of mice were homogenized
in buffer containing 0.02M guanidine. ELISA was then performed for A40
and A42 according to the manufacturer’s instructions.
Behavioral studies. We performed behavioral studies to assess spatial learn-ing
and memory in the Morris water maze as previously described (Lee et al.,
2012). Animals were given four trials per day for 10 d to learn the task. At 11 d,
animals were given a probe trial in which the platform was removed. Fear
conditioning was conducted as previously described techniques (Kojima et al.,
2005). On the conditioning day, mice were individually placed into the con-ditioning
chamber. After a 60-s exploratory period, a tone (10 kHz, 70 dB)
was delivered for 10 s; this served as the conditioned stimulus (CS). The CS co-terminated
with the unconditioned stimulus (US), a scrambled electrical foot-shock
(0.3 mA, 1 s). The CS-US pairing was delivered twice at a 20-s intertrial
interval. On day 2, each mouse was placed in the fear-conditioning chamber
containing the same exact context, but with no administration of a CS or foot
shock. Freezing was analyzed for 5 min. On day 3, a mouse was placed in a test
chamber that was different from the conditioning chamber. After a 60-s ex-ploratory
period, the tone was presented for 60 s without the footshock. The
rate of freezing response of mice was used to measure the fear memory.
Quantitative real-time PCR. RNA was extracted from the brain homog-enates
and cell lysates using the RNeasy Lipid Tissue Mini kit and RNeasy
Plus Mini kit (QIAGEN) according to the manufacturer’s instructions.
cDNA was synthesized from 5 μg of total RNA using a commercially avail-able
kit (Takara Bio Inc.). Quantitative real-time PCR was performed using
a Corbett research RG-6000 real-time PCR instrument. Used primers are
described in Table S2.
EM. Brain tissues and cells were fixed in 3% glutaraldehyde/0.1 M phosphate
buffer, pH 7.4, and postfixed in 1% osmium tetroxide in Sorensen’s phosphate
buffer. After dehydration in ethyl alcohol, the tissue and cells were embedded
in epon (Electron Microscopy Sciences). Samples were cut serially and placed
on copper grids and analyzed using a transmission EM (Tecnai). Images were
captured on a digital camera and Xplore3D tomography software.
Intracellular protein degradation measurement. Total protein degrada-tion
in cultured cells was measured by pulse-chase experiments with 48 h
pulse with 2 μCi/ml [3H]-leucine for 48 h to preferentially label long-lived
proteins (Lee et al., 2010b).
Western blotting. Samples were immunoblotted as previously described
(Settembre et al., 2011; Lee et al., 2012). Primary antibodies to the following](https://image.slidesharecdn.com/jemneurosciencespecialissue-141202045722-conversion-gate02/85/Jem-neuroscience-special_issue-97-320.jpg)
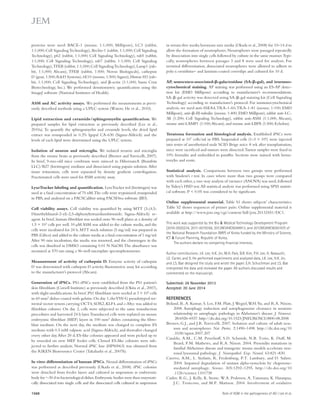
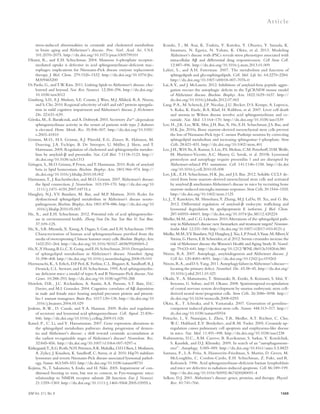

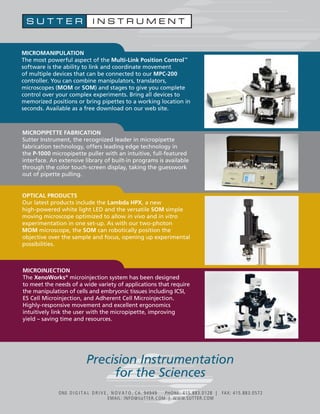

The document summarizes recent publications from The Journal of Experimental Medicine focusing on neuroscience. It highlights several studies: one finding that monocyte-derived macrophages initiate myelin destruction in multiple sclerosis, while microglia-derived macrophages clear debris; another activating B-RAF kinase to promote axon regeneration after nerve injury; and one showing that blocking interleukin-21 reduces brain injury following stroke in mice. It also summarizes studies on retinal thinning in frontotemporal dementia and targeting neurovascular pathology in Alzheimer's disease models.