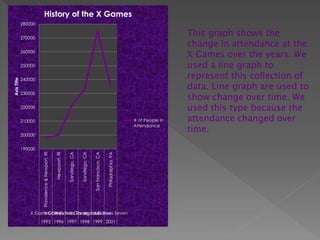
Janea Cali

Javarus Barrett
MOST POPULAR iTUNES DOWNLOADED
        Hung Up, Madonna                        Run It!, Chris Brown
        My Humps, Black Eyed Peas               Photograph, Nickelback
        Stickwitu, The Pussycat Dolls           Laffy Taffy, D4L
        Dance, Dance, Fall Out Boy              Gold Digger, Kanye west
        Sugar, We're Going Down, Fall Out Boy   There It Go!, Juelz Santana

                                           7%
                                     7%
                                                15%
                               8%
                                                      14%
                                     9%
                                                  11%
                                 9%
                                          10%   10%


This Graph is about which songs are downloaded
the most on iTunes. The percent's represent the
downloaded frequency of each song. I chose this
graph because it shows the songs that were
downloaded the most in percent's. Pie charts are
used to show what an item represents in a
percent.
History of the X Games
             280000


             270000
                                                                                                                                                      This graph shows the
                                                                                                                                                      change in attendance at the
             260000
                                                                                                                                                      X Games over the years. We
             250000                                                                                                                                   used a line graph to
             240000
                                                                                                                                                      represent this collection of
Axis Title


                                                                                                                                                      data. Line graph are used to
                                                                                                                                                      show change over time. We
             230000


             220000                                                                                                                                   used this type because the
             210000                                                                                                                  # of People in   attendance changed over
                                                                                                                                                      time.
                                                                                                                                     Attendance

             200000


             190000
                                                                Sandiego, CA

                                                                               Sandiego, CA


                                                                                                                  Philadalphia, PA
                                                 Newpoort, RI


                                                                                              San Francisco, CA
                      Providence & Newport, RI


                 X Games One Two Games Four Five Seven
                      X Games X Three X Games
                          X Games   Xgames
                      1995 1996 1997 1998 1999 2001
MTV Total Request Live
                  Invisible-Clay Aiken
                Feeling This-Blink 182
               Leave (Get out)-JoJo
                 The Way-Clay Aiken
           Hold On-Good Charlottte
             So Yesterday-Hilary Duff
                Toxic-Brittany Spears
 Song-Artist


           Everytime-Brittany Spears
              Naughty Girl-Beyonce
                         My Band-D12
                        Roses-Outkast
                 Untitled-Simple Plan
        Hollaback Girl-Gwen Stefani
                 Wake Up-Hilary Duff
 Don't Forget About Us-Miriah Carey
                 Hung Up- Madonna
                                         0   10     20      30       40   50
                                             Number of Weeks at #1


This graph shows how many weeks a particular song was
at #1. I chose this graph because it how long a song
stayed at #1. Bar graphs are used to show amounts, or
number of times a value occurs.
Comic Book Orders
             250000

                                                        This graph shows the
                                                        amount of comic books sold
             200000
                                                        by a store. The horizontal
                                                        axis represents a different
                                                        comic book. We used the
                                                        scatter plot to represent this
             150000                                     data. Scatter plots are used
                                                        to show trends. We used it
Est. Sales


                                                        for this data to show what
             100000                                     comic books are trending.


              50000


                  0
                      0     5    10    15     20   25

Janea&javarus powerpoint

  • 1.
  • 2.
    MOST POPULAR iTUNESDOWNLOADED Hung Up, Madonna Run It!, Chris Brown My Humps, Black Eyed Peas Photograph, Nickelback Stickwitu, The Pussycat Dolls Laffy Taffy, D4L Dance, Dance, Fall Out Boy Gold Digger, Kanye west Sugar, We're Going Down, Fall Out Boy There It Go!, Juelz Santana 7% 7% 15% 8% 14% 9% 11% 9% 10% 10% This Graph is about which songs are downloaded the most on iTunes. The percent's represent the downloaded frequency of each song. I chose this graph because it shows the songs that were downloaded the most in percent's. Pie charts are used to show what an item represents in a percent.
  • 3.
    History of theX Games 280000 270000 This graph shows the change in attendance at the 260000 X Games over the years. We 250000 used a line graph to 240000 represent this collection of Axis Title data. Line graph are used to show change over time. We 230000 220000 used this type because the 210000 # of People in attendance changed over time. Attendance 200000 190000 Sandiego, CA Sandiego, CA Philadalphia, PA Newpoort, RI San Francisco, CA Providence & Newport, RI X Games One Two Games Four Five Seven X Games X Three X Games X Games Xgames 1995 1996 1997 1998 1999 2001
  • 4.
    MTV Total RequestLive Invisible-Clay Aiken Feeling This-Blink 182 Leave (Get out)-JoJo The Way-Clay Aiken Hold On-Good Charlottte So Yesterday-Hilary Duff Toxic-Brittany Spears Song-Artist Everytime-Brittany Spears Naughty Girl-Beyonce My Band-D12 Roses-Outkast Untitled-Simple Plan Hollaback Girl-Gwen Stefani Wake Up-Hilary Duff Don't Forget About Us-Miriah Carey Hung Up- Madonna 0 10 20 30 40 50 Number of Weeks at #1 This graph shows how many weeks a particular song was at #1. I chose this graph because it how long a song stayed at #1. Bar graphs are used to show amounts, or number of times a value occurs.
  • 5.
    Comic Book Orders 250000 This graph shows the amount of comic books sold 200000 by a store. The horizontal axis represents a different comic book. We used the scatter plot to represent this 150000 data. Scatter plots are used to show trends. We used it Est. Sales for this data to show what 100000 comic books are trending. 50000 0 0 5 10 15 20 25