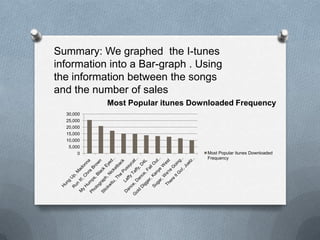
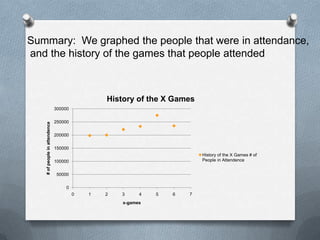
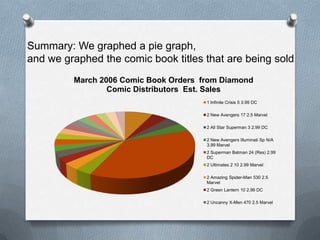
By: Yesenia Cervantes, Diana
  Luong, and Andre Beard
Summary: We graphed the I-tunes
information into a Bar-graph . Using
the information between the songs
and the number of sales
           Most Popular itunes Downloaded Frequency
  30,000
  25,000
  20,000
  15,000
  10,000
   5,000
       0                          Most Popular itunes Downloaded
                                  Frequency
Purpose:
 The bar graph shows the frequency's of
 the amount of songs that are being
 downloaded.
Analysis:
 It is easier to understand the numbers of
 downloads
Summary: We graphed the people that were in attendance,
and the history of the games that people attended


                                                History of the X Games
                               300000

                               250000
   # of people in attendence


                               200000

                               150000
                                                                          History of the X Games # of
                               100000                                     People in Attendence


                                50000

                                    0
                                        0   1   2   3     4   5   6   7
                                                    x-games
Purpose:
 We chose a scatter plot because it shows
 a trend in the data of the history of the x-
 games.
Analysis:
 To make it easier to read the numbers of
 people that attended.
Summary: We graphed a pie graph,
and we graphed the comic book titles that are being sold
         March 2006 Comic Book Orders from Diamond
                 Comic Distributors Est. Sales
                                       1 Infinite Crisis 5 3.99 DC

                                       2 New Avengers 17 2.5 Marvel

                                       2 All Star Superman 3 2.99 DC

                                       2 New Avengers Illuminati Sp N/A
                                       3.99 Marvel
                                       2 Superman Batman 24 (Res) 2.99
                                       DC
                                       2 Ultimates 2 10 2.99 Marvel

                                       2 Amazing Spider-Man 530 2.5
                                       Marvel
                                       2 Green Lantern 10 2.99 DC

                                       2 Uncanny X-Men 470 2.5 Marvel
Purpose:
 We chose the Pie graph because it shows
  the sales of the comic book .
Analysis:
 to set it easier to read the price of the
  comic books
Purpose:
 We chose the Line graph because it gave
  us the weeks and the Labels.

Analysis:
 It shows the changes that people
 requested on MTV.

four types of graphs

  • 1.
    By: Yesenia Cervantes,Diana Luong, and Andre Beard
  • 2.
    Summary: We graphedthe I-tunes information into a Bar-graph . Using the information between the songs and the number of sales Most Popular itunes Downloaded Frequency 30,000 25,000 20,000 15,000 10,000 5,000 0 Most Popular itunes Downloaded Frequency
  • 3.
    Purpose:  The bargraph shows the frequency's of the amount of songs that are being downloaded. Analysis:  It is easier to understand the numbers of downloads
  • 4.
    Summary: We graphedthe people that were in attendance, and the history of the games that people attended History of the X Games 300000 250000 # of people in attendence 200000 150000 History of the X Games # of 100000 People in Attendence 50000 0 0 1 2 3 4 5 6 7 x-games
  • 5.
    Purpose:  We chosea scatter plot because it shows a trend in the data of the history of the x- games. Analysis:  To make it easier to read the numbers of people that attended.
  • 6.
    Summary: We grapheda pie graph, and we graphed the comic book titles that are being sold March 2006 Comic Book Orders from Diamond Comic Distributors Est. Sales 1 Infinite Crisis 5 3.99 DC 2 New Avengers 17 2.5 Marvel 2 All Star Superman 3 2.99 DC 2 New Avengers Illuminati Sp N/A 3.99 Marvel 2 Superman Batman 24 (Res) 2.99 DC 2 Ultimates 2 10 2.99 Marvel 2 Amazing Spider-Man 530 2.5 Marvel 2 Green Lantern 10 2.99 DC 2 Uncanny X-Men 470 2.5 Marvel
  • 7.
    Purpose:  We chosethe Pie graph because it shows the sales of the comic book . Analysis:  to set it easier to read the price of the comic books
  • 9.
    Purpose:  We chosethe Line graph because it gave us the weeks and the Labels. Analysis:  It shows the changes that people requested on MTV.