Downloaded 11 times

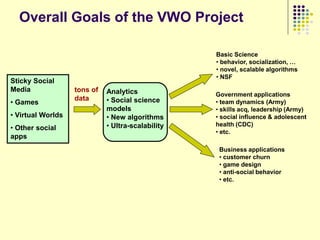
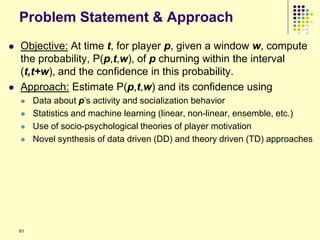
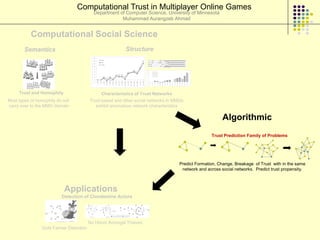
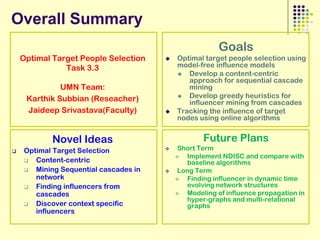
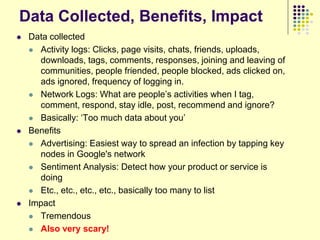
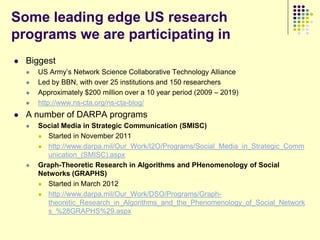
![What have been it‟s key scientific successes?
In classical social sciences numerous results
„Six degree of separation‟ [Milgram]
Popularized by the „Kevin Bacon game‟
„The strength of weak ties‟ [Granovetter]
„Online networks as social networks‟ [Wellman, Krackhardt]
„Dunbar Number‟
Various types of centrality measures
Etc.
In the Web era
„The Bow-Tie model of the Web‟ [Raghavan]
„Preferential attachment model‟ [Barabasi] (Yes and No)
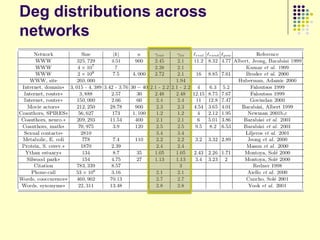
„Powerlaw of degree distribution‟ [Lots of people] (NO!)
Etc.](https://image.slidesharecdn.com/jaideep-130409021357-phpapp01/85/Jaideep-5-320.jpg)
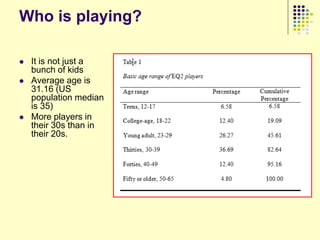
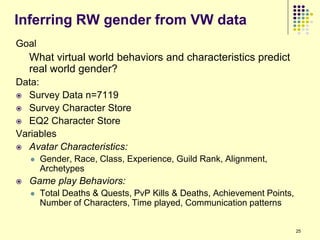
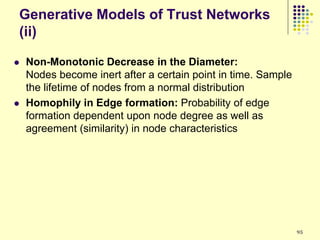
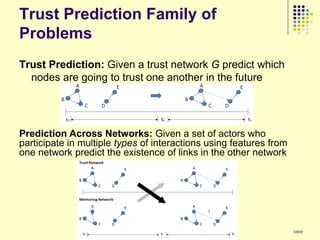
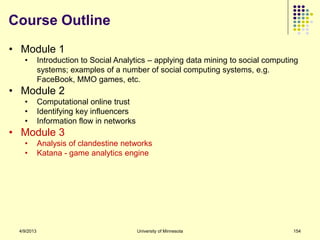
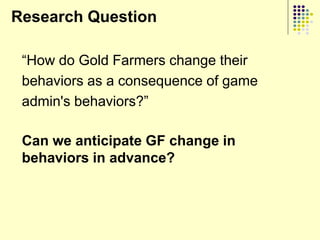
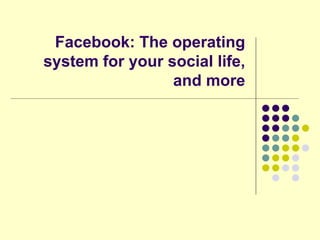
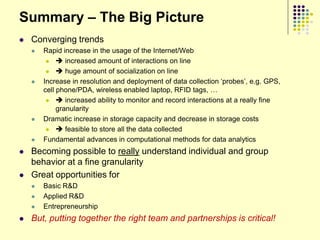
![Implications of this „addiction‟
3 billion hours a week are being spent playing online
games
Jane McGonigal in “Reality is Broken”
Labor economics
What is the impact of so much labor being removed from the pool
[Castranova]
Entertainment economics
If MMO players can get 100 hrs/month of entertainment by spending
$25 or so, what will happen to other entertainment industries?
Psychological/Sociological
Is it an addiction – the prevailing view (Chinese government‟s „detox
centers‟ for kids)
Are they fulfilling a deeper need that real world is not (McGonigal)
Societal
A trend far too important to not be taken seriously!](https://image.slidesharecdn.com/jaideep-130409021357-phpapp01/85/Jaideep-9-320.jpg)


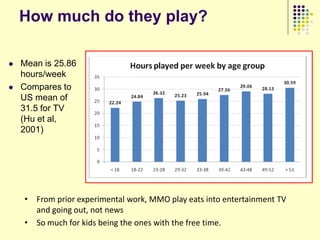
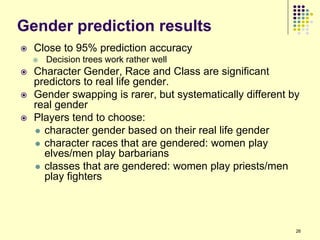


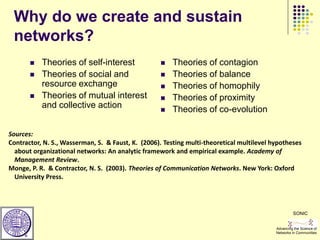
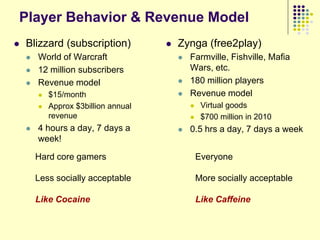
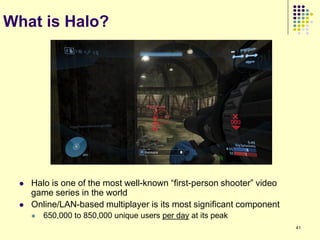
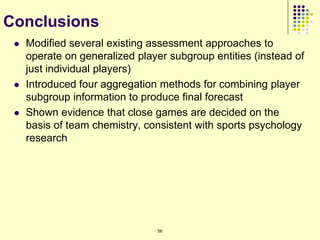
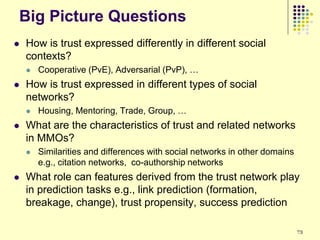
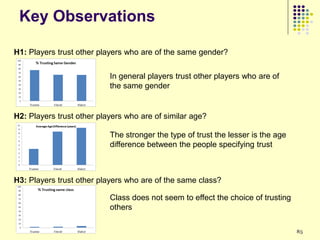
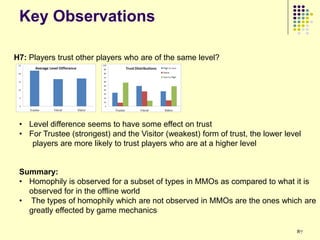
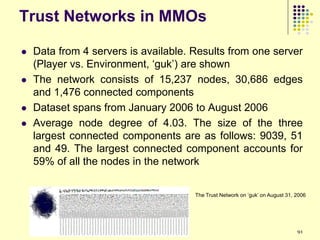
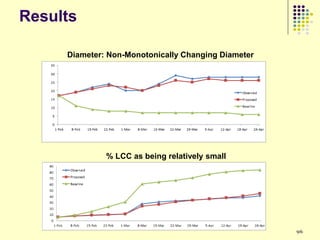
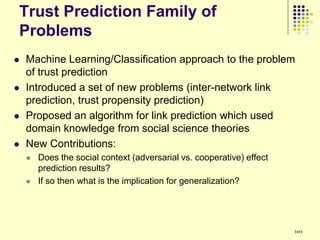
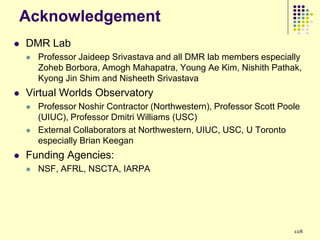
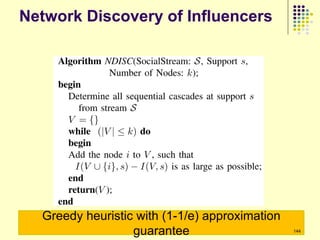
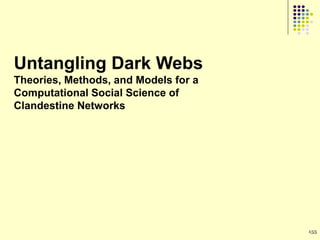
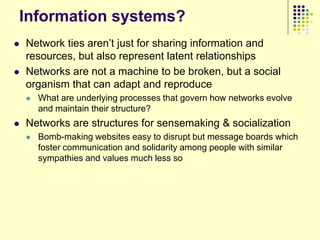
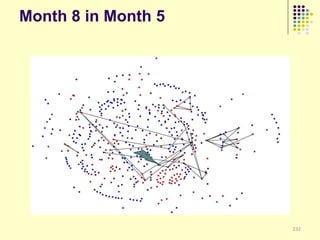
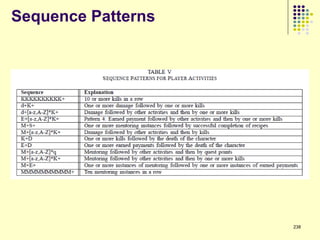
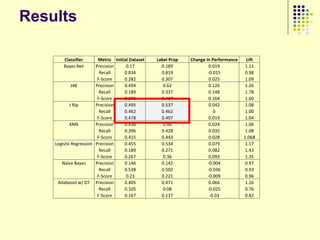
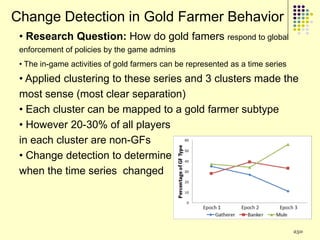
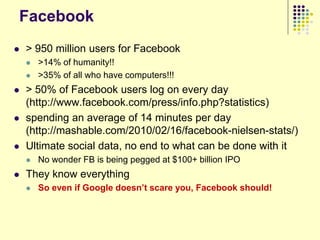
![Results
Clusters 1 and 4 are similar
Groups kill fewer monsters
Group members in cluster 4 do not communicate much
Group members in cluster 1 generally limit their communication to just
one other person in the group
Most people belong to these two clusters
Consistent with previous research - users in virtual environments are
less likely to interact with strangers
[N. Ducheneaut, N. Yee, E. Nickell and R. Moore, “Alone Together?” Exploring
the social dynamics of massively multiplayer online games, Proceedings
CHI06, ACM Press, New York, 407-416.]
Cluster 5 groups have many 1-edge and 2-out stars
Most of the communication is one way possibly indicating presence of
central people
Maximum number of monsters killed out of all clusters
Performance of the groups is very good
Minimal communication
It is possible that cluster 5 consists of groups more focused on playing
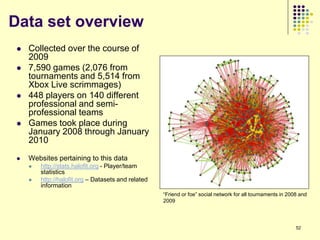
and performing well in the game and less on socializing](https://image.slidesharecdn.com/jaideep-130409021357-phpapp01/85/Jaideep-37-320.jpg)
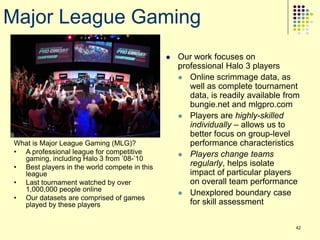
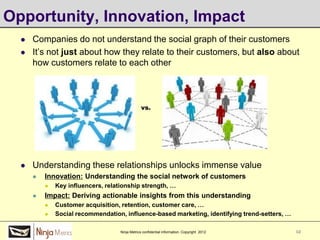
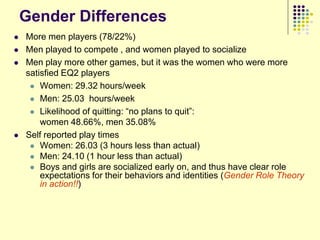
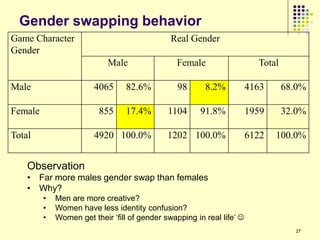
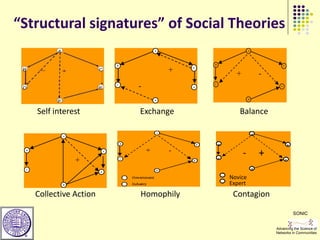
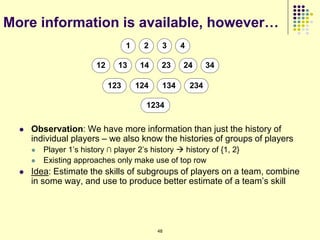
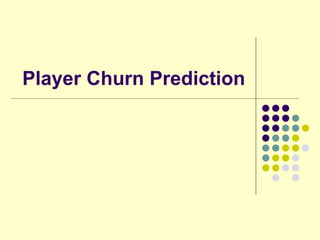
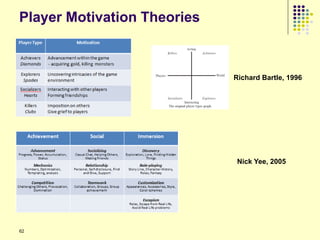
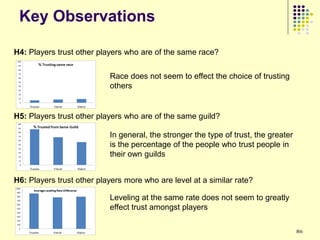
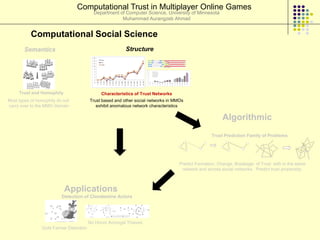
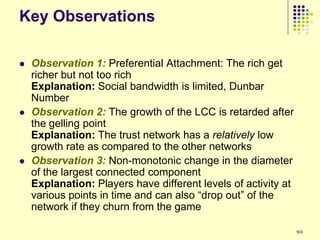
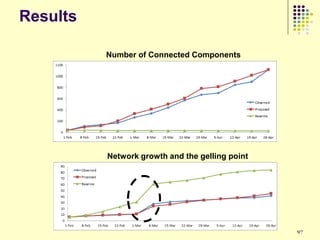
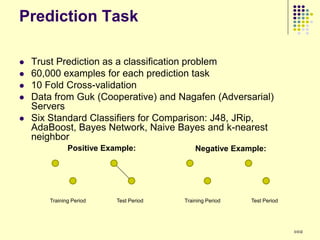
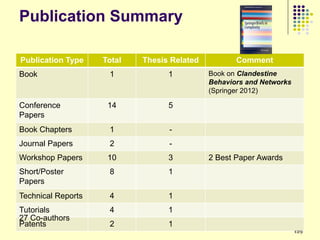
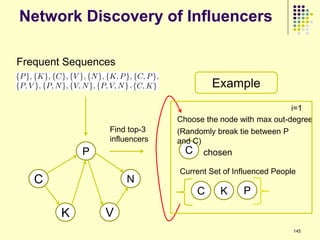
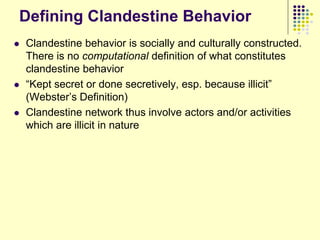
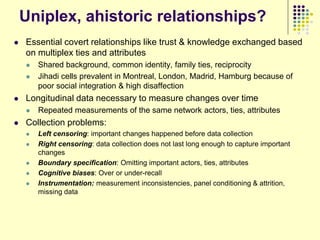
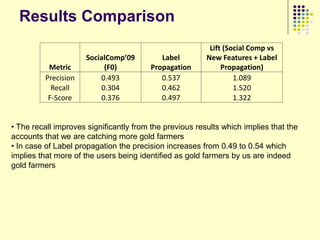
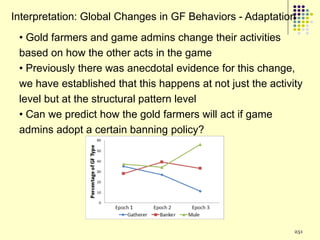
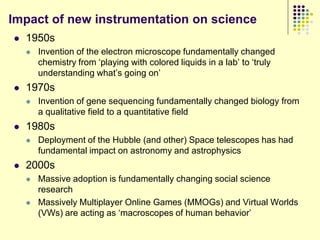
![Issues with current approaches
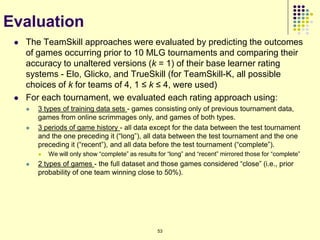
1 2 3 4
+
1234
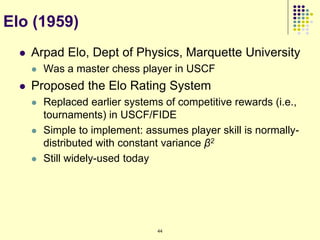
Basic idea
Given: skill ratings of each team member, i.e., si ~ N(μi, σi2)
Sum across all team members
Not intuitive: Team chemistry is a well-known concept in team-based
competition [Martens 1987, Yukelson 1997] and it is not captured in
any of these models
Can think of it as the overall dynamics of a team resulting from
leadership, confidence, relationships, and mutual trust
Independence assumption not realistic in teams, especially at
high levels of play
47](https://image.slidesharecdn.com/jaideep-130409021357-phpapp01/85/Jaideep-47-320.jpg)
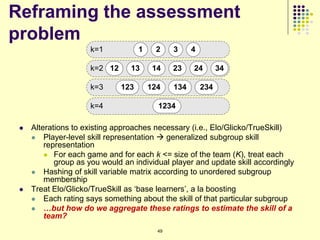

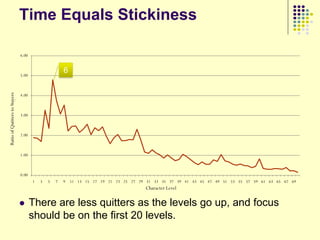


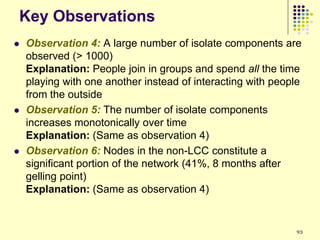


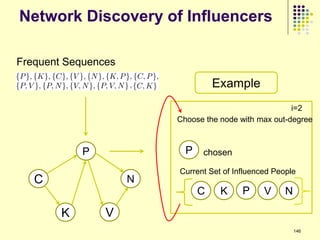
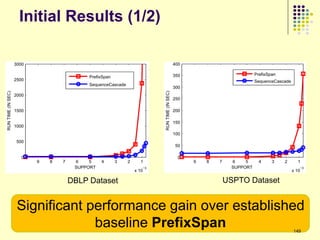
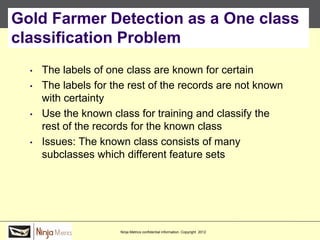
![Current Approaches (1/2)
Assume a certain model for propagation of influence [1]
Independent Cascade Model
Each node is independently influences the neighbor
using a biased coin toss
Linear Threshold Model
Each node picks a random threshold
Each node infects the neighbor by a specified
amount
All of them need to know the
propagation probability 135](https://image.slidesharecdn.com/jaideep-130409021357-phpapp01/85/Jaideep-135-320.jpg)
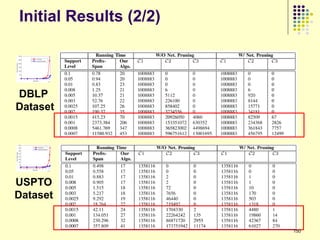
![Current Approaches (1/2)
Use a two step approach
Step 1: Choose influence Model
Step 2: Find the subset of top-k nodes that maximizes
the influence
Bad News: Step 2 is NP-Hard [2]
Popular method for step 2: Greedy Heuristics
Greedy heuristics gives (1-1/e) approximation
Address scalability issues in the second step [3][4][5][6]
CELF [3]: Influence maximization function follows law
of diminishing returns (sub-modular)
136](https://image.slidesharecdn.com/jaideep-130409021357-phpapp01/85/Jaideep-136-320.jpg)
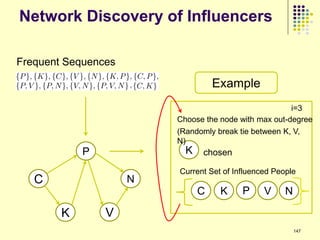
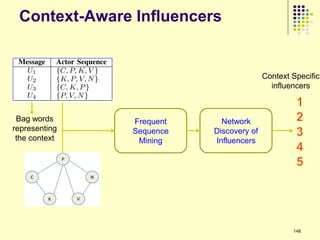
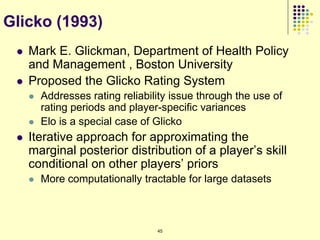
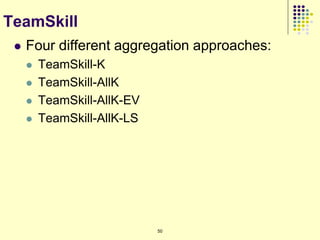
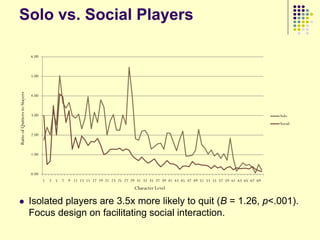
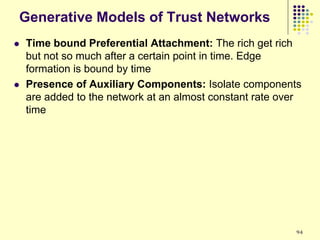
![Top Influencers
DBLP USPTO
*
Dataset Dataset
Thomas Huang Dieter Freitag
Professor, UIUC CTO, FRX Polymers
American Plastics Hall of Fame
Philip Yu Akira Suzuki
Professor, UIC 2010 Nobel Prize winner
In Chemistry
*
Elisa Bertino
Professor, Purdue Wilhelm Brandes
Scientist, Bayer Crop Science
151
* Prolific inventors 1988-1997 as per USPTO announcement [7]](https://image.slidesharecdn.com/jaideep-130409021357-phpapp01/85/Jaideep-151-320.jpg)
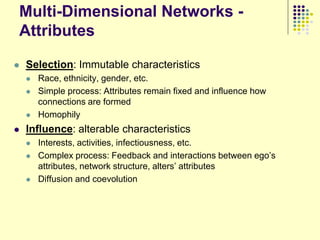
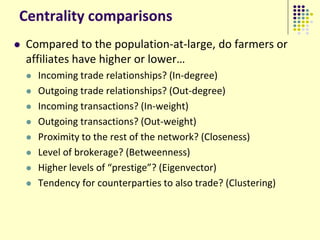
![Clandestine organizations as
networks
Networks are more flexible organizational forms than
markets or hierarchies
[Powell 1990; Podolny 1998; Brass, Galaskiewicz, et al. 2004; Robins 2009]
Criminals are embedded within organizations
supporting division of labor and specialization
[Cressy 1972; Canter & Alison 2000; Waring 2002]
Trust relations mediate functional relations like
grouping, exchange, & communication
[McIntosh 1974; von Lampe 2004]
Balancing security vs. efficiency; time-to-task; resilience
vs. flexibility
[Milward & Raab 2003, 2006; Morselli, Giguere, & Petit 2007]](https://image.slidesharecdn.com/jaideep-130409021357-phpapp01/85/Jaideep-158-320.jpg)
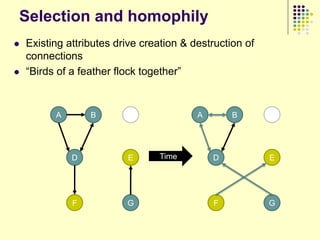
![Clandestine networks are
complex
Multiple types of relationships [Stohl & Stohl 2007]
Networks have multiplex and dynamic relations – trust, exchange,
communication, authority, and other relationships
Networks are temporary, dynamic, emergent, adaptive, flexible
Networks are local, glocal, global, and heterogeneous – different ideologies,
motivations, goals lead to different structures & processes
Descriptive network analysis does not address
underlying processes of how networks emerge, stabilize,
dissolve
Goal: To disrupt network, understand and attack the
processes which create and stabilize](https://image.slidesharecdn.com/jaideep-130409021357-phpapp01/85/Jaideep-169-320.jpg)
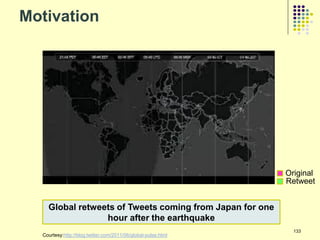
![Data collection issues
Data on clandestine organizations are doubly hard to
obtain
Clandestine networks by definition seek to avoid detection or identification
Law enforcement prohibited from collecting some types of data, reluctant to disclose
extant data to prevent adaptation
Criminal network studies to date generally rely on:
Evidence entered into court proceedings [Sparrow 1991; Baker & Faulkner 1993]
Imputation from secondary or tertiary sources [Krebs 2002; Sageman 2004]](https://image.slidesharecdn.com/jaideep-130409021357-phpapp01/85/Jaideep-190-320.jpg)
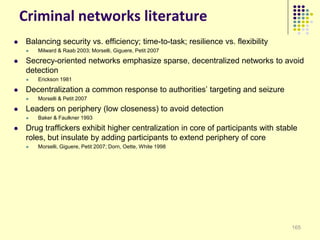
![Problems with approaches
Collection of incomplete network
data seriously compromises
reliability of findings [Wasserman & Faust
1994]
Boundary specification of nodes –
peripheral & legitimate actors often
omitted despite playing crucial roles
Censored data – only one type of
interaction recorded; earlier & later ties
may be impossible to capture
Lack of attributes – occupation, gender,
affiliation, personality, psychological
states strongly influence tie-formation
behavior over time [Robins 2009]
Krebs 2002](https://image.slidesharecdn.com/jaideep-130409021357-phpapp01/85/Jaideep-191-320.jpg)

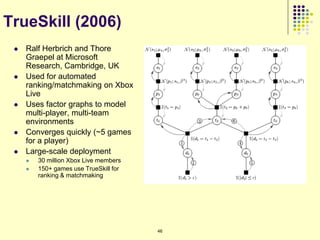
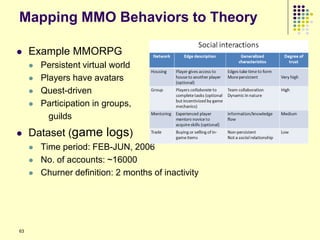
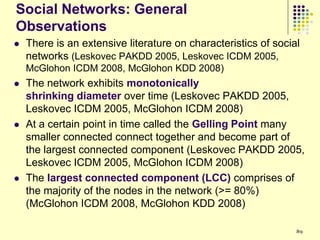
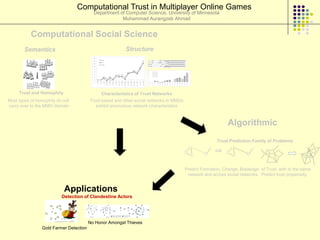
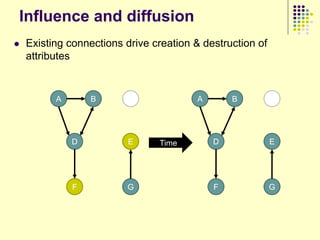
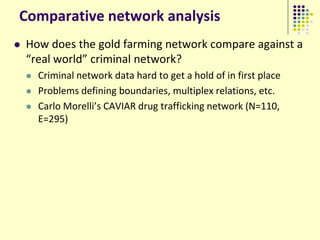
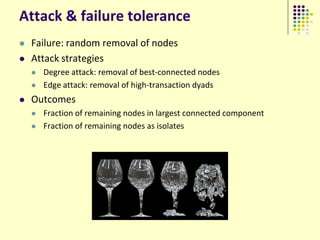
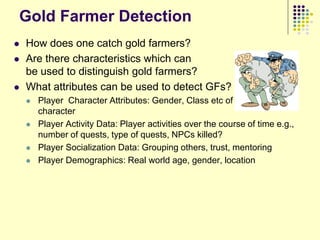
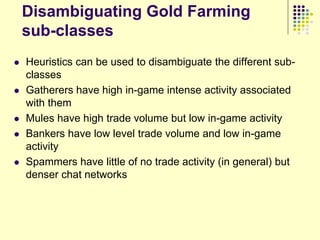
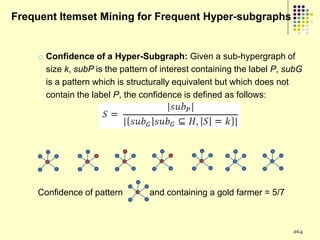
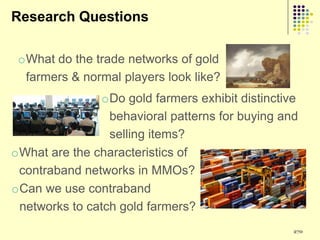
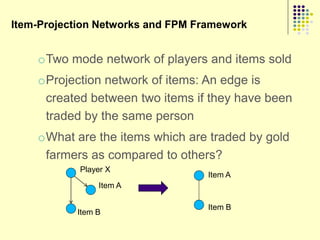
![Gold farming
• Gold farming and real money trade
involve the exchange of virtual in-game
resources for “real world” money
• Laborers in China and S.E. Asia paid to
perform repetitive in-game practices
(“farming”) to accumulate virtual wealth
(“gold”)
• Western players purchase farmed gold to
obtain more powerful items/abilities and
open new areas within the game
• Market for real money trade exceeds $3
billion annually [Lehdonvirta & Ernkvist 2011]
194](https://image.slidesharecdn.com/jaideep-130409021357-phpapp01/85/Jaideep-194-320.jpg)

![Implications
Social organization and behavioral
patterns of clandestine activity as
co-evolutionary outcomes
Using online behavioral patterns to inform
and develop metrics/algorithms for
detecting offline clandestine activity
Clandestine networks as “dual use”
technologies – ethical and legal
implications of improving detection?
[Keegan, Ahmad, et al. 2011]](https://image.slidesharecdn.com/jaideep-130409021357-phpapp01/85/Jaideep-267-320.jpg)

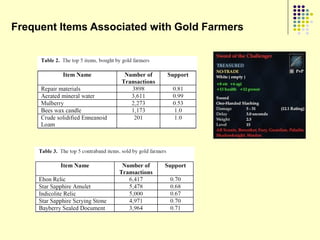
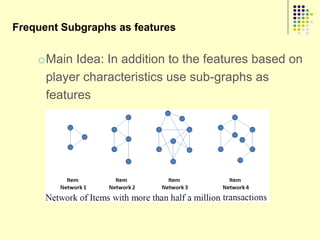
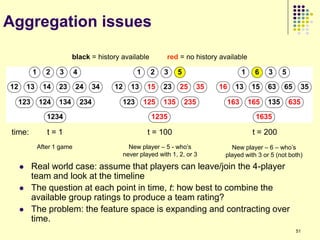
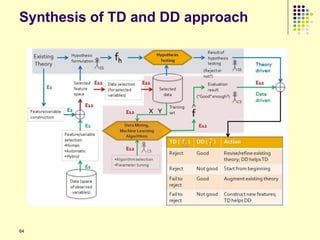
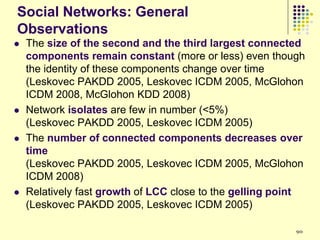
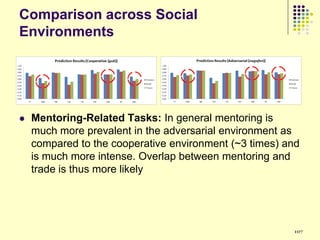
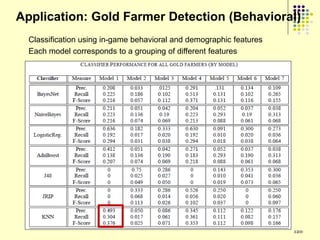
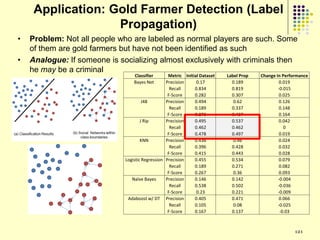
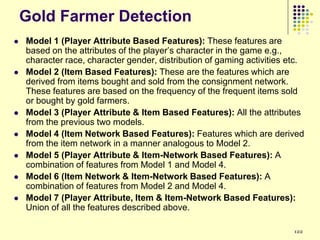
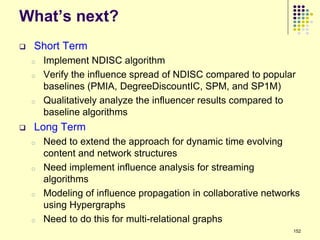
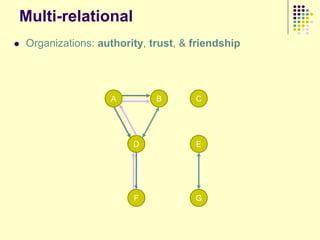
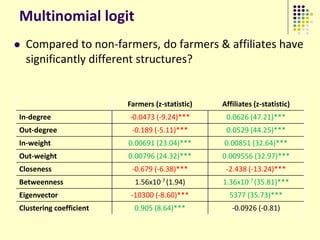
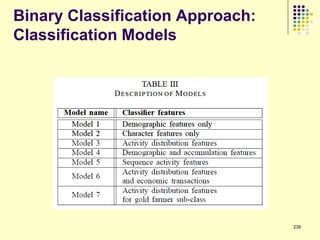
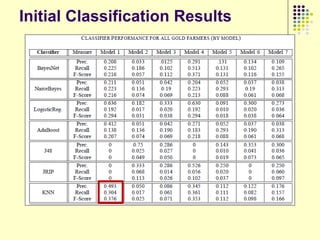
![Prediction Models
Model 1 (Player Attribute Based Features): These features are based on the attributes of the player‟s
character in the game e.g., character race, character gender, distribution of gaming activities etc. These
are the same features which were used by Ahmad et al [SocCom‟09].
Model 2 (Item Based Features): These are the features which are derived from items bought and sold
from the consignment network. These features are based on the frequency of the frequent items sold or
bought by gold farmers.
Model 3 (Player Attribute & Item Based Features): All the attributes from the previous two models.
Model 4 (Item Network Based Features): Features which are derived from the item network in a
manner analogous to Model 2.
Model 5 (Player Attribute & Item-Network Based Features): A combination of features from Model 1
and Model 4.
Model 6 (Item Network & Item-Network Based Features): A combination of features from Model 2 and
Model 4.
Model 7 (Player Attribute, Item & Item-Network Based Features): Union of all the features described
above.](https://image.slidesharecdn.com/jaideep-130409021357-phpapp01/85/Jaideep-281-320.jpg)
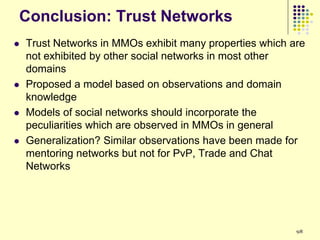
![Legal questions
If moral, ethical, and legal boundaries that constrain
behavior are indistinct or unenforceable in virtual world,
who defines regulations to define and curb excesses?
Some normative rules hard-wired into code, others permitted by code
[Lastowka & Hunter 2006; Grimmelmann 2006; Ondrejka 2006]
From false positives to due process
Responsibility to disclose proprietary methodological approaches?
Heightened or different burden of proof given superabundance of data?
Expectations of privacy?
Demonstrating intent?
Right to representation and due process?](https://image.slidesharecdn.com/jaideep-130409021357-phpapp01/85/Jaideep-286-320.jpg)


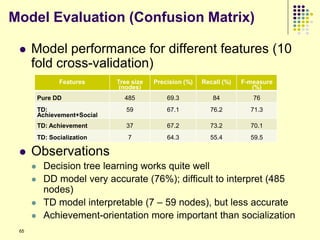
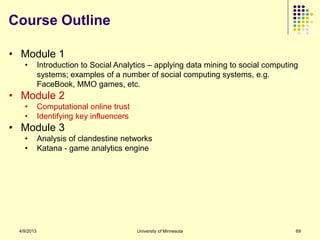
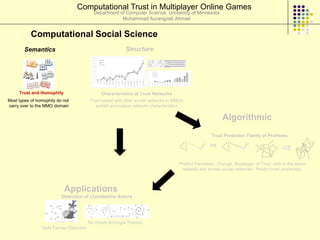
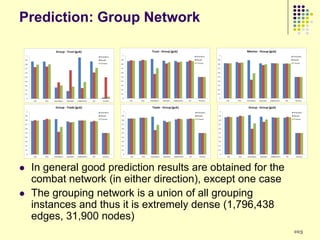
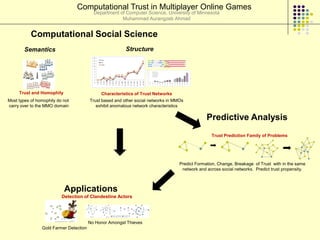
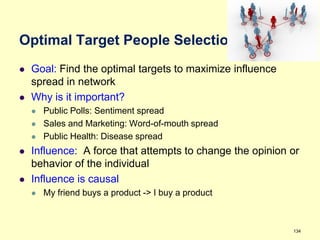
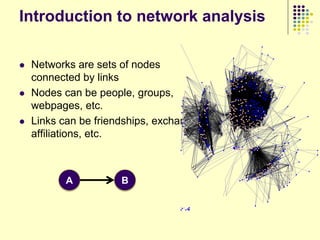
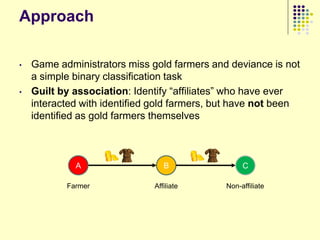
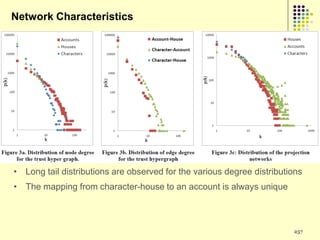
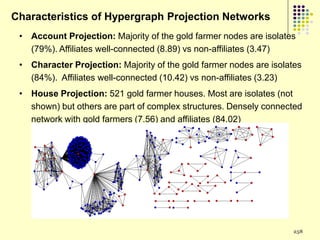
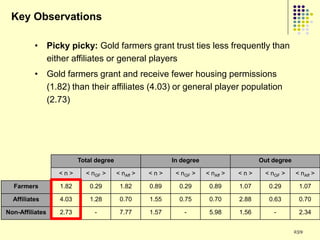
This document provides an outline for a course on social analytics. The course will have 3 modules that cover: (1) an introduction to social analytics and examples of social computing systems, (2) computational online trust, key influencers, and information flow in networks, and (3) analysis of clandestine networks and game analytics. The document also provides background information on social network analysis and its successes in both classical social sciences and more recent web-based applications.


